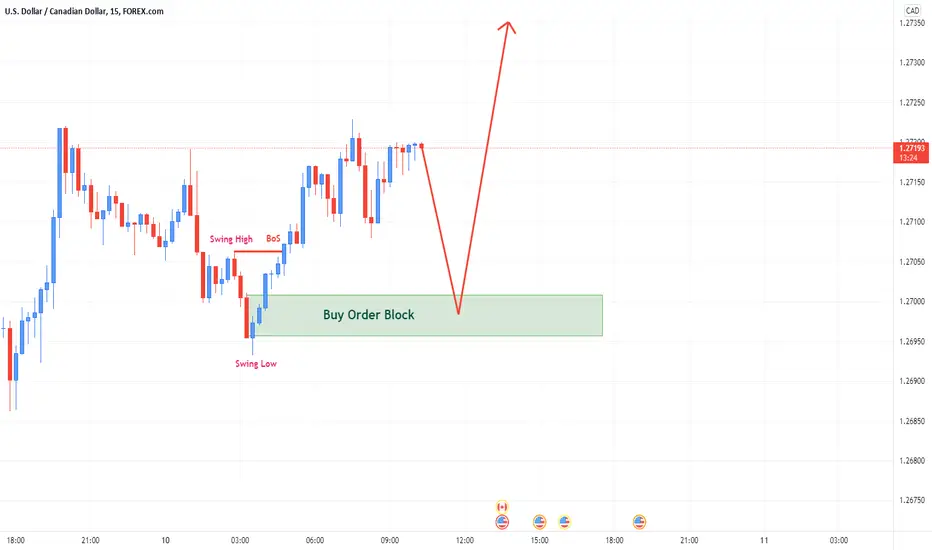
USDCAD Idea M15Here is my view for USDCAD on M15. The price should go up, you can put a pending order on the Order block or find an entry on LTF within OB Zone. Trade Safe!
Usdcadsignal

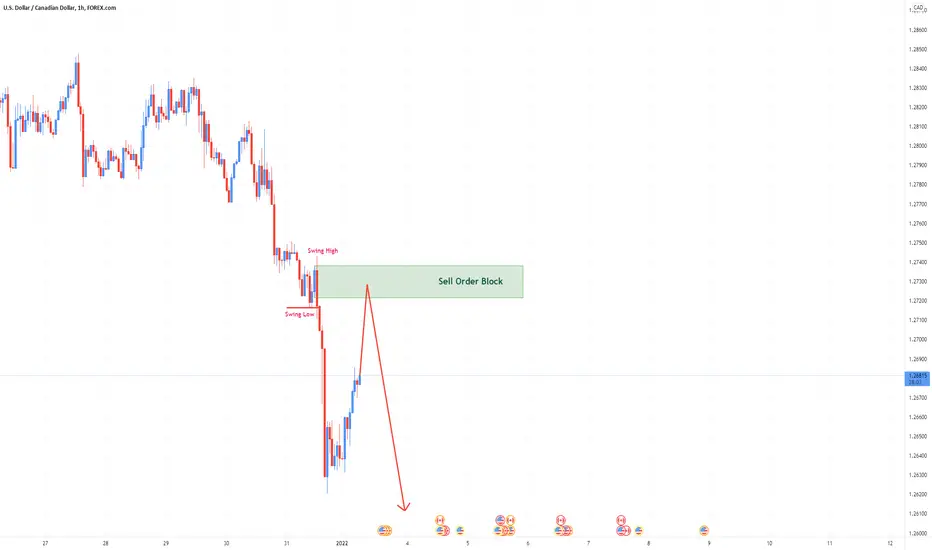
USDCAD Idea H1Here is my view for USDCAD on H1. The price should go down, you can put a pending order on the Order block or find an entry on LTF within OB Zone. Trade Safe!

USDCAD Idea H1Here is my view for USDCAD H1. The price should go down, you can put a pending order on the Order block or find an entry on LTF within OB Zone. Trade Safe!
USDCAD is in buy zone!!USDCAD has been bounced from weekly and daily support and is likely to uprise. A buying opportunity arises as per the sketch.
Leave a comment below if you have any questions and press the like the button if you find value in this analysis.

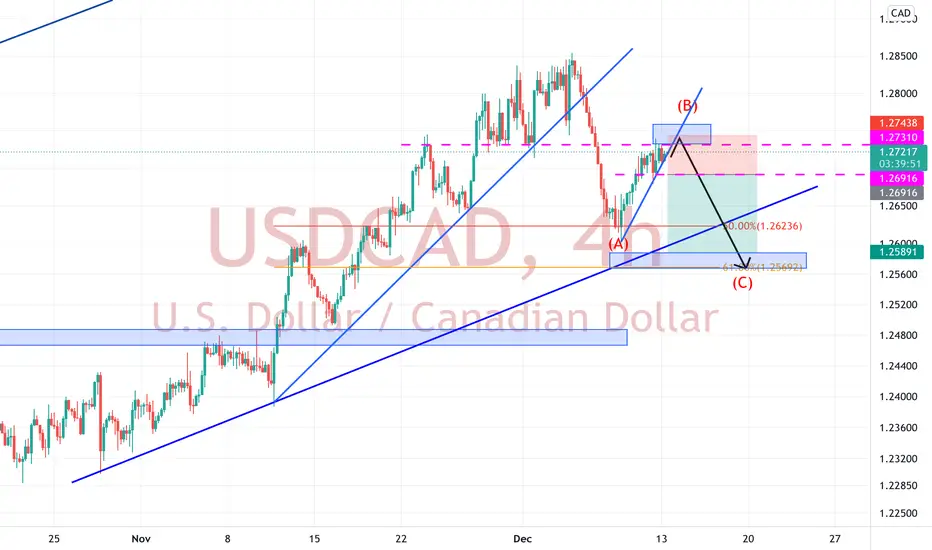
USDCADI expect the price behavior to be in wave 2 and branches 2 and 3 remain corrected. Do you agree?

USDCAD Idea D1Here is my view for USDCAD on D1. The price should go down, you can put a pending order on the Order block or find an entry on LTF within OB Zone. Trade Safe and happy new year!

usdcad long 4hrsusd cad has a great support and expect a great reversal point in long entry
advance happy new year happy trading
waut for the breakout

USD/CAD Forecast: USD Drifting Lower Against CADThe US dollar rallied ever so slightly on Friday against the Canadian dollar but did give back quite a bit of the gains to form an inverted hammer. While it was a slightly positive candlestick, the reality is that we are probably going to go looking a little bit lower for some type of support that we can take advantage of.
If we break above the top of the Friday candlestick, then I think the market will probably go looking towards the 1.30 handle, which is my longer-term target. The 1.28 level looks to be a potential support level, so I am going to watch this over the next couple of days and see if we get a bit of a turnaround. If we do, then I am willing to get long again as well. That being said, the lack of liquidity over the next couple of days will make reading too much into the candlesticks a bit dangerous, so I will also use the oil markets as a proxy for what could happen next as well.
The market being able to break above the 1.30 level could kick off a longer-term “buy-and-hold” situation, but that something that would more than likely happen well after New Year’s Day. That is why I am using the candlestick for the session on Friday being broken to the upside as a starting point, but I would not put huge amounts of money into this market. That being said, if we do get that move and then eventually take out 1.30, then I would become aggressively long.
To the downside, if we take out the 50 day EMA, then I will start shorting and aiming towards the 1.24 level underneath. Needless to say, we would probably coincide with a rising oil market, but we do not necessarily have to. With that in mind, I have a couple of parameters that am paying close attention to and will be acting upon. The next couple of days will more than likely be more along the lines of observation, but if I do get that trade triggered, I would use a position that would be equal to 25% of my normal risk just due to the fact that the illiquid conditions can cause massive spikes sometimes.

USD/CAD Forecast: USD Continues to Pull Back Against LoonieThe US dollar has pulled back again during the trading session on Thursday against northern counterpart. The Loonie has been a bit oversold as of late, so this is not a huge surprise. The question now is whether or not this is going to be a simple correction, or is it going to be something bigger? A lot of this could come down to the oil market as per usual, but there are also other things that could move the Canadian dollar.
Keep in mind that these two economies are highly intertwined, so that is why quite often this market tends to be very difficult to trade. However, it appears to me that the pullback from the 1.30 level was very deliberate, but I do not necessarily know that it means we are changing directions again. As things stand right now, it simply looks like we are chopping along and try to butt up the necessary momentum to break out to the upside. If we can clear the 1.30 level on a daily candle, that would be a very bullish sign and could send this pair much higher. It is worth noting that we bounced from the 1.20 level, an area that has been crucial on longer-term charts. The question now is whether or not we are actually going to try to revisit that? I highly doubt it at this point.
That being said, the 50 day EMA is where I draw a line in the sand, and as long as we can stay above that I think you have to be looking for buying opportunities. It currently sits at the 1.2677 level and is rising quite rapidly due to the extreme momentum that we had seen in the market over the last several weeks. For what it is worth, oil does look a little bit tired at the moment, but with the lack of liquidity in the markets, you cannot read too much into any of these moves over the next couple of days. For me, this is all about the 1.30 handle and whether or not we can break above it. If we can, then it becomes a “buy-and-hold” type of market that I will look for opportunities to add to. I suspect that probably comes sometime in early January, perhaps after the nonfarm payroll numbers.
For me, this is all about the 1.30 handle and whether or not we can break above it.

USDCAD ShortYou can see a divergence in USDCAD and it has retraced from channel top.
Looking to go for a sell trade from here to the OB below.
Details given on chart.

USDCAD top-down analysisHello traders, this is the full breakdown of this pair. We will take this trade if all the conditions are satisfied as discussed in the analysis. Smash the like button if you find value in this analysis and drop a comment if you have any questions or let me know which pair to cover in my next analysis.

USDCAD top-down analysisHello traders, this is the full breakdown of this pair. We will take this trade if all the conditions are satisfied as discussed in the analysis. Smash the like button if you find value in this analysis and drop a comment if you have any questions or let me know which pair to cover in my next analysis.

USDCAD | Technical Analysis | Good Buy Opportunity If you find this technical analysis useful, please like & share our ideas with the community. Coming to the technical analysis of USDCAD, I think we are going to see an upward movement. If you are going to go long now, make sure to place the stop below the previous support area .
What do you think is more likely to happen? Please share your thoughts in comment section. And also give a thumbs up if you find this idea helpful. Any feedback & suggestions would help in further improving the analysis.
Good Luck!
Disclaimer!
This post does not provide financial advice. It is for educational purposes only! You can use the information from the post to make your own trading plan for the market. But you must do your own research and use it as the priority. Trading is risky, and it is not suitable for everyone. Only you can be responsible for your trading.

USDCAD News H4Here is my view for USDCAD on H4. The price should go up, you can put a pending order on the Order block or find an entry on LTF within OB Zone. Trade Safe!


USDCAD short trade idea UPDATES!!Still holding my short bias on USDCAD after been stopped at break even on Friday, we are getting a nice reaction from that 1.27300 retracement area showing that it is holding some sort of significance. At the start of the week I will be watching price and trying to get into the best opportunity I can to hopefully catch the large move to the downside.

USDCAD Price Prediction M15Here is my analysis for USDCAD on M15. The price should go up, you can put a pending order on the Order block or find an entry on LTF within OB Zone. Trade Safe!
USDCAD continuation area soon Not really much happening on USDCAD, we are now just seeing price make a retracement like I expected, then ill be watching for hopefully the next short wave down.

USDCAD PredictionHere is my view for USDCAD on H4. The price should go up, you can put a pending order on the Order block or find an entry on LTF. Trade Safe!

USDCAD SHORT UPDATES!Now that price has reached first minor target area I think from this support we may see another push back up to make another failed spike up or a retracement to follow the possible new downtrend. If we see this retracement move I may look at adding further short trades.

USD/CAD 4HR CHART POSS SELL SET UPHi everyone this is my trade set up for the USD/CAD
USD/CAD possible short TRADE is going against the trend so slightly risky, wait for a confirmation candle or pattern to form look for something concrete then if it meets your criteria for a trade then execute
This is my analysis only please trade with caution and risk management in place
good luck for this weeks trading
please like and comment both are welcome

USDCAD short area!!I'm still holding the bias of seeing a further push down but now its just getting into the best entry point, after been stopped at breakeven from last night ill be watching for entry's again today! Price usually gives you more then one opportunity and we still haven't broken upside trend structure so I defiantly wouldn't look at taken shorts from current price, be patient and snipe those best entry points. Good luck!
