USDCAD running into resistance (short area)Will 1.28000 be the resistance that gives the much needed pullback on USDCAD? Ill just be monitoring price at the start of the week and hopefully price can shape nicely for either a bigger retracement or even possible reversal.
Usdcadsignal

USDCAD is following its higher targetsThe candlestick pattern shows a weakness in bullish trend, a short-term rest is expected for USDCAD. The level 0.61 of Fib-Ret will be the next target at 1.29784. According to Chart Patterns, an ascending triangle would be detected at the mentioned level. Final target could be at 1.37. Please share and enjoy trading!


USDCAD SHORT TRADE UPDATESo hopefully some of you guys may be in this trade, as expected price is pushing down and looking like we may see a deeper pull back to go with the overall uptrend or possibly making a reversal for some further downside. Even though I'm not in the trade I will update later in the week.

USDCAD SHORTS TAKENHoping to see another much needed deeper pull back or possible trend change on USDCAD, I've just entered and like I said moving stops to entry point as soon as a few pips in profit as I'm not forgetting the overall 4hr uptrend!

USDCAD STILL HOLDING SHORTS UPDATE!Firstly I apologies for my voice I'm currently trying not to lose it LOL, anyway I've still got my short trade open but moving stops to breakeven, we seen price get a bit choppy Friday and I do expect weakness from the dollar... so a sell off or push down on USDCAD I feel is coming, the hard part is getting the best position with the lest risk. Ill monitor price at the start of the week and if I get stopped at break even I will start to map out next short areas.

USD/CAD 4HR CHART BUY SET UPHi everyone this is my trade set up for the USD/CAD for the new week ahead
USD/CAD i think will push higher i am expecting a pullback to the order block zones and will be looking for a buy trade
look for pullback to zones lined off on chart then if it meets your criteria for a trade then execute
This is my analysis only please trade with caution and risk management in place
good luck for this weeks trading
please like and comment both are welcome

USDCAD SHORT TRADESo I've just taken short trades on USDCAD and hoping to see a quick move down where ill be moving my stop loss to entry point and hopefully catching a nice risk free short to finish the week on USDCAD.

USDCAD Short term bearish for 1.2480#usdcad, price retracing downward by hitting supply zone. supply zone 1.2635-50, stop loss 1.2670, target 1.248

USDCAD H1 BUYWe have 4 hours of Hayden Diver positive material. The price is above the uptrend line and the pullback is over Therefore, the price rises to the previous ceiling after crossing the specified line

USD/CAD CHART4HR SELL SET UPHi everyone this is my trade set up for the USD/CAD for the new week ahead
USD/CAD i think will push higher i am expecting a pullback to the order block zones and will be looking for a buy trade
look for pullback to zones lined off on chart then if it meets your criteria for a trade then execute
This is my analysis only please trade with caution and risk management in place
good luck for this weeks trading
please like and comment both are welcome

USDCAD is likely to breakdown!!Hello traders, USDCAD has tested the long-term trend line as resistance and rejected to the downside. This weekly price has opened with a gap and it is highly likely that this instrument may break to the downside.


USDCAD short new placeAfter breaking the SL, I marked a new position to be shorted. Now I am waiting for the price to return to the short zone

USDCAD: Elliot Wave of USDCADthe end of 5th wave down trend and end of B wave at 1.22025=FIB 0.786 wave A and we going to uptrend to end of wave C of bigger wave.

Possible Short opportunity on USDCADAccording To Fibo Extension + Channel
USDCAD VS OIL Price
TP And SL
Usdcad Sell setup with Stop loss HuntingPeople using stop loss on high point people expecting sell from supply but i m expecting after stop loss hit then reversal

USDCAD intra-day shorts Here on USDCAD Ill be looking for a short position if price can reject the top of this consolidation range I've drawn on and then look at taking out 1.23000 again where ill then be looking at possible buy trades.

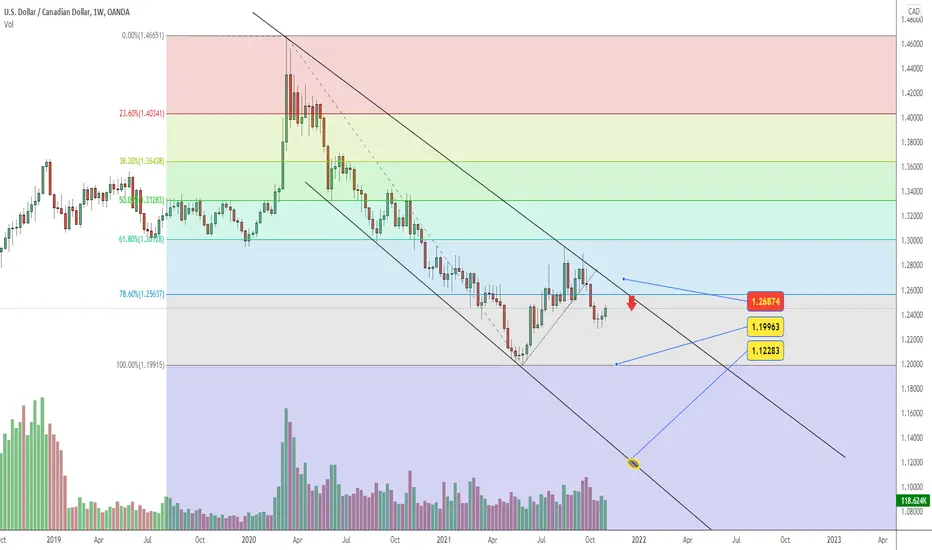
UsdCad- Great R:R medium term tradeUndoubtedly, since mid-March, CAD has dominated the market, and with USD has strengthened more than 2500 pips, reaching a local low at 1.2 at the end of May.
A first leg of correction has followed and a new drop after this.
However, this new drop has found bids in 1.23 zone and we have 2 Doji candles on our weekly chart that can signal a higher low is in place.
I expect a new leg up from UsdCad and the price could reach and test 1.3 resistance.
Such trade can have a 1:5 risk to reward ratio and is negated with a daily close under the last recent low


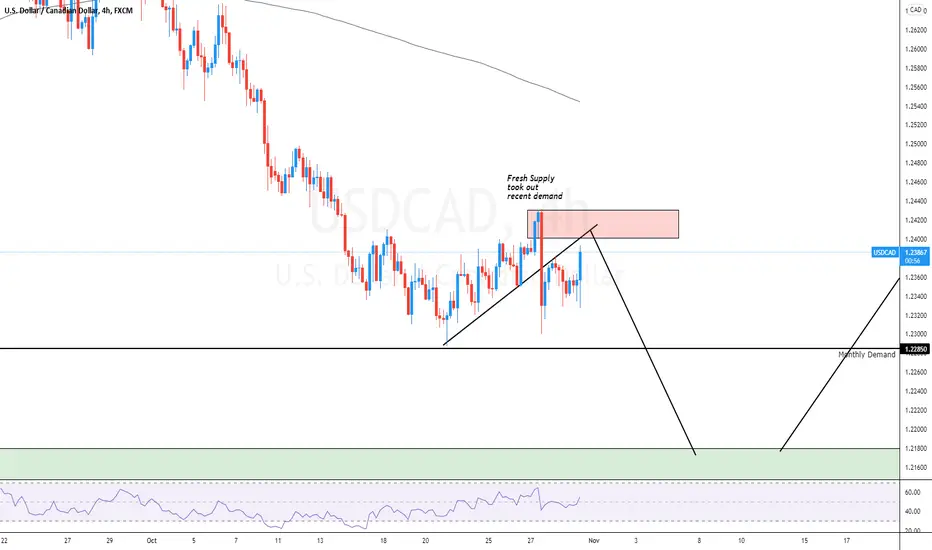
USDCAD - H4 - Bearish reversal USDCAD - H4- Price broke multiple demand zones yesterday and voided my long bias off the daily chart. Now im looking at more downside on this pair before a big bullish rebound.
USDCAD - Daily - Bullish continuation upsideUsdcad - Daily - price pulled down to a monthly demand zone and now looks set to reverse back to the upside and give us a 300-400 pips rally. Lets ride it

Hawkish and No More QE Sends the USDCAD LowerJust now, Bank of Canada delivered a hawkish stance and decided to end to the quantitative easing which sent the USDCAD drops 100 pips in 2 hours.
Based on the 1H chart, the drop of USDCAD was coincided by the test on the level of 0.236 Fibonacci which could indicate a continuation of the downtrend of USDCAD.
