USDCAD shortI marked the place earlier and published the analysis on short. Unfortunately, I did not have time to open the position, but there is a chance that they will return to the price and then I will join the downward movement
Usdcadsignal

USDCAD pivotal points (long term sell)USDCAD previously rejected a major support/resistance level as well as a weekly fib level and the weekly 200ema.
The way i trade is from one major level to another, so the next tp is 1.20255. But before that, i knew that price could stop and react to this 1.2300 support level , which it did. i entered after seeing the 1H and 4H charts were illustrating a rising wedge , which is a sign that price is indeed going back up, temporarily. The rsi on both timeframes was below 30 (oversold) and the rsi on the 4h was even showing divergence .
I took opportunity of this retracement to what’s most likely a fib level to enter a short term buy before we continue down. Once the buy TP is reached, i’ll look for signs of rejection and take it back down to the original sell TP .

USDCAD SELL ideaUSDCAD has been making higher lows in the recent week, however I've noticed it has been trading in a consolidation
There are 2 entries here where the aggressive one is based on these confluences:
Retest of Trendline
Test of 61.8% Fib
Higher Low Created
Bullish Engulfing/Momentum Candle
Conservative entry would be on a break and retest of the consolidation box

USD/CAD Forecasted Hit 75% Profits Bagged in. (6th Dec 2020)My educational Analysis worked perfectly in 4 hr and 15 mins timeframe. And it took with the help of a pitchfork tool.
follow me for more analysis.

USDCAD / Long opportunityPrice has reached an area of support where it has rejected from in the past
Currently waiting for a structure break on a lower timeframe to enter a long position
Please feel free to follow for more ideas

USDCAD Entries + Exits! REVERSE IS SECURED IF PLAYED CORRECTLYThe ENTRY/TP zones are your entries as well as your exits.
Everything above the current candlestick is resistance, you would treat every zone above as a sell/potential buy break.
Everything below the current candlestick is support, which you would then treat every zone below as a buy/potential sell break if it hits the pip rule.
More info on the strategy and how to play it:
How To Play The Chart Entries/Exits:
Buy at green support entry, if it breaks by -35 pips (count it out) then enter a sell and ride to TP1, 2 and 3. Trail stop at each TP which means place your stop loss in profit but with enough room to be able to continue the sell if it continues. Same thing at resistance, sell but if broken by 35 pips then enter the buy and ride to TP1. Each TP is a support or resistance zone , so you could then even take a sell after TP1 for the buys have been hit and if it breaks out then just repeat.
All likes/comments and feedback are very much appreciated! Thank you to all of those who support me on a weekly basis, it really does mean a ton to me!

USDCAD top-down analysisHello traders, this is the full breakdown of this pair. We will take this trade if all the conditions are satisfied as discussed in the analysis. Smash the like button if you find value in this analysis and drop a comment if you have any questions or let me know which pair to cover in my next analysis.

#USDCAD SELL OPPORTUNITY LONG TERMIf price fail to come higher than 1H EMA and also rejected from this area which is our static Resistance zone and manage to come lower than 1.26268 means short term bullish corrective move has ended and price can start another drop to 1.25630 and after that because of higher time frame bearish move can also see lower prices.
price at the moment is sitting on 1H & 4H EMA and also we can see bearish divergence which all suggest its a good area for looking to short this pair.
But we should remember if price goes higher than 1.26555 this analysis has failed and our short term trend has confirmed to be bullish.

USDCAD Entries + Exits! REVERSE IS GUARENTEED IF PLAYED CORRECTHow To Play The Chart Entries/Exits:
Buy at green support entry, if it breaks by -35 pips (count it out) then enter a sell and ride to TP1, 2 and 3. Trail stop at each TP which means place your stop loss in profit but with enough room to be able to continue the sell if it continues. Same thing at resistance, sell but if broken by 35 pips then enter the buy and ride to TP1. Each TP is a support or resistance zone , so you could then even take a sell after TP1 for the buys have been hit and if it breaks out then just repeat.
All likes/comments and feedback are very much appreciated! Thank you to all of those who support me on a weekly basis, it really does mean a ton to me!

USDCAD | Perspective for the new week | Follow-up detailsAs price moved in our direction since my last publication on this pair, we scooped over 350pips (see link below for reference purposes) before the reversal setup began. As at the moment, it appears that we are on the verge of a risk of further decline in the coming week(s) as the Dollar lost all it gained during the month of September 2021 and with the appearance of Head & Shoulder look alike, the possibility of a reversal increases.
The Greenback may continue to decline in the coming week as the U.S. yields dropped despite stronger than expected inflation and consumer spending.
Tendency: Downtrend (Bearish)
Structure: Supply & Demand | Trendline | Reversal pattern (Head and Shoulder)
Observation: i. The Loonie has been on a downward spiral since mid last year and the appearance of a reversal pattern at exactly 38.2% retracement of the Bearish Impulse leg cited on the weekly chart might be a signal confirming a risk of further decline in the coming week(s).
ii. The visual representation of a line drawn under pivot lows reveals the bullish momentum of price action since the month of June 2021 but a drop in momentum can be seen in the recent pivot point as the price did not launch as high as the previous before the second breakdown of Trendline.
iii. A baseline noted on the chart with three peaks, where the outside two are close in height and the middle is highest describes a specific formation that predicts a bullish-to-bearish trend reversal.
iv. Completion of the reversal pattern can be confirmed at Breakdown/Retest of Neckline in the coming week as below C$1.26300 remains a comfortable level to sell the Dollar.
v. It is worthy to note that C$1.263000 has a memory for selling opportunities in recent times (April 2021).
vi. A Breakdown of the Neckline and Key level is a confluence for selling opportunities in the coming week with an option to add to our existing position at Breakdown/Retest of C$1.25000 level.
NB: It is very possible that the projected decline in price might be a short term trend... Trade consciously!😊
Trading plan: SELL confirmation with a minimum potential profit of 300 pips.
Risk/Reward : 1:4
Potential Duration: 3 to 10days
NB: This speculation might be considered to make individual decisions on the lower timeframe.
Watch this space for updates as price action is been monitored.
Risk Disclaimer:
Margin trading in the foreign exchange market (including commodity trading, CFDs, stocks etc.) has a high risk and is not suitable for all investors. The content of this speculation (including all data) is organized and published by me for the sole purpose of education and assistance in making independent investment decisions. All information herein is for your reference only and I take no responsibility.
You are hereby advised to carefully consider your investment experience, financial situation, investment objective, risk tolerance level, and consult your independent financial adviser as to the suitability of your situation prior to making any investment.
I do not guarantee its accuracy and is not liable for any loss or damage which may result directly or indirectly from such content or the receipt of any instruction or notification therewith.
Past performance is not necessarily indicative of future results.

USDCAD 15MIN TIMEFRAME ANALYSIS (BUY) We consider buying this USDCAD pair because of a strong support below. We know what we are doing and we do what the market is doing. This is more than an institutional analysis. Invest wisely. Thank you for following me on tradingview.

USDCAD Head & Shoulder Pattern?I've noticed a head and shoulder forming on USDCAD, with rejection on Major Level 1.28000.
We will have to wait and see what the reaction of price does on level 1.26000 before any decision is made.

USDCAD 15min TIMEFRAME ANALYSIS (SELL)We consider selling this USDCAD pair because of a strong resistance above. We know what we are doing and we do what the market is doing. This is more than an institutional analysis. Invest wisely. Thank you for following me on tradingview.

USDCAD Falling IdeaUSDCAD price Falling to 1.2620 - 1.2600. It can take 24 hours and during this time we can have sales trades.
Please pay attention to the GBPUSD chart that I published on last Thursday.

USDCAD My Prophecy has happened !!Hello everyone, as we all know the market action discounts everything :)
_________________________________Make sure to Like and Follow if you like the idea_________________________________
On July 20 I posted my analysis on the market and told u that a cup and handle pattern has formed and the market is looking Bullish
Then on the 2nd of September, i posted an idea about how the market will probably move for the next period of time, and Today we see that the market moved exactly like I said it would .....
Today The USD/CAD pair added to its strong intraday gains and climbed to one-month tops, further beyond the 1.2800 mark heading into the European session.
The market is still showing Bullish signs all over, and if we use the Elliot wave theory we see that we are having an impulsive wave right now that could push the market to the 1.3002 level.
Scenario :
The market is getting close to the first resistance line at 1.2826 where a battle between the Bears and Bulls will happen and the outcome will probably be in favor of the Bulls. if the price breakout that line then the trend will go on and that which give us a good confirmation that the movement will be headed to the 1.3002 level soon.
Technical indicators show :
1) The market is above the 5 10 20 50 100 and 200 MA and EMA (Strong Bullish sign)
2) The RSI is at 63.07 showing Great strength in the market, No divergences were found between the market and the indicator
3) The ADX is at 18.45 showing that the market is gaining more strength but it didn't reach the trending phase yet. A positive crossover is happening between DI+ (28.32) and DI- (14.76)
Daily Support and Resistance :
support Resistance
1) 1.2759 1) 1.2777
2) 1.2751 2) 1.2787
3) 1.2741 3) 1.2795
Weekly Support and Resistance :
support Resistance
1) 1.2651 1) 1.2826
2) 1.2537 2) 1.2887
3) 1.2475 3) 1.3002
Fundamental point of view :
The USD/CAD returned to its best level in a month as markets anticipate the Federal Reserve will confirm that a bond taper is planned this year and the close Canadian election is not expected to produce any major policy shift, whatever its political result.
That promise of higher US interest rates has been the main support for the US dollar over the past month.
Canadian inflation was slightly higher in August than expected though the Bank of Canada core rate was a bit lower than forecast, though it increased over July.
In the US, the Consumer Price Index for August showed the first indication that price increases may be slackening. Retail Sales in August rebounded smartly from their decline the month before.
Polls for Canada’s federal election on Monday between Prime Minister Justin Trudeau’s Liberals and the Conservatives of Erin O’Toole show neither party winning an outright majority in the 338-seat parliament. According to FXstreet
This is my personal opinion done with technical analysis of the market price and research online from Fundamental Analysts and News for The Fundamental point of view, not financial advice.
If you have any questions please ask and have a great day !!
Thank you for reading.

USDCAD IdeaCurrently it's in a consolidation between 1.270 and 1.260
So we can have a sell trade up to 1.2600 or 1.2620

USDCAD H1 TIMEFRAME ANALYSIS (BUY) We consider buying this USDCAD pair because of a strong support below. We know what we are doing and we do what the market is doing. This is more than an institutional analysis. Invest wisely. Thank you for following me on tradingview.

USDCAD Short into 1.24350Confluences
a. FIB
b. Major key level
c. Break of trendline and consolidation

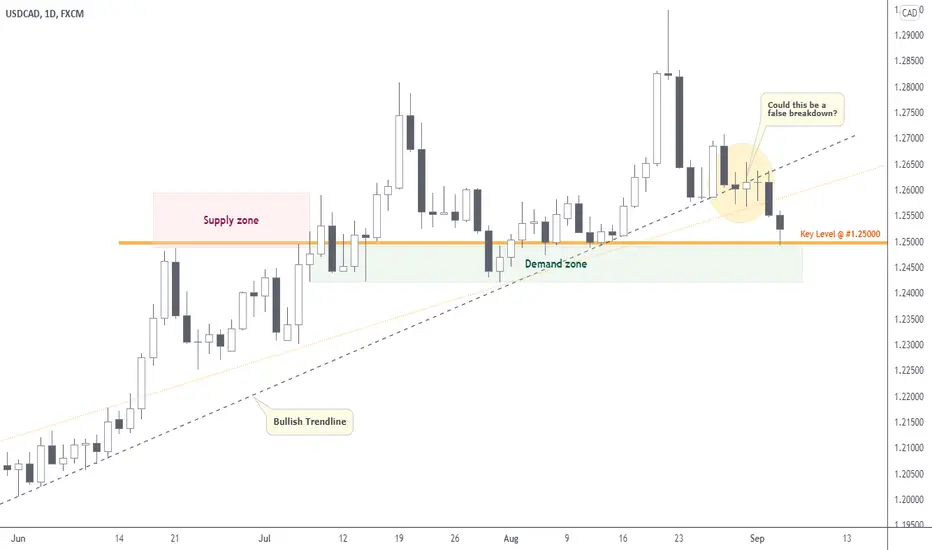
USDCAD | Perspective for the new weekMy last speculation saw the price move over 150pips in our direction before the bulls took over ( see link below for reference purposes). Since breaking above the $1.25000 level in July 2021, I am labelling this level to be a very strong demand zone for the Greenback considering that the obvious that it has held price "supported' in the last couple of months. Since the value of the Loonie is directly connected to the oil situation. It is important to take into consideration that oil inventories are currently down from what they used to be prior to the Covid-19 pandemic. Coupled with the Hurricane Ida situation, there is more supply than demand which could have a negative impact on the Loonie in the coming week(s).
Tendency: Uptrend (Bullish)
Structure: Supply & Demand | Trendline
Observation: i. Since hitting a peak @ $1.29500 on the 20th of August 2021, the price of USD have tumbled drastically and it is finally at our Demand zone.
ii. The visual representation of a line drawn under pivot lows reveals the prevailing direction of price since June 2021. However, a sudden Breakdown of this Trendline (whatever way you draw your line) during last week trading session cast some doubt on the Bullish tendency on this pair.
iii. At this juncture it is indeed appropriate that we remain patient and observe how price reacts to the Major Demand zone @ $1.25000/1.24200 area for confirmations.
iv. To support my Bullish expectation on this pair, I shall be looking for rejections or engulfing candles off of the Key level @ $1.25000 (above key level - safe haven) in the coming week(s).
v. Should price drop below Key level, then this will make the Breakdown of Bullish Trendline valid. Hence, a retest shall give me no choice but to switch bias in support of the Bears... Trade consciously!😊
Trading plan: BUY confirmation with a minimum potential profit of 250 pips.
Risk/Reward : 1:4
Potential Duration: 3 to 7days
NB: This speculation might be considered to make individual decisions on the lower timeframe.
Watch this space for updates as price action is been monitored.
Risk Disclaimer:
Margin trading in the foreign exchange market (including commodity trading, CFDs, stocks etc.) has a high risk and is not suitable for all investors. The content of this speculation (including all data) is organized and published by me for the sole purpose of education and assistance in making independent investment decisions. All information herein is for your reference only and I take no responsibility.
You are hereby advised to carefully consider your investment experience, financial situation, investment objective, risk tolerance level, and consult your independent financial adviser as to the suitability of your situation prior to making any investment.
I do not guarantee its accuracy and is not liable for any loss or damage which may result directly or indirectly from such content or the receipt of any instruction or notification therewith.
Past performance is not necessarily indicative of future results.
USDCAD DAILY TIMEFRAME ANALYSIS (BUY) We consider buying this USDCAD pair because of a strong support below. We know what we are doing and we do what the market is doing. This is more than an institutional analysis. Invest wisely. Thank you for following me on tradingview.

Signal USDCAD Week 01/9/2021Chart D1 Usdcad up trend
Chart H4 Harmonic Pattern
Entry 1.26123
SL: 1.2554
TP1: 1.2702
TP2: 1.2804
TP3:1.2900

USDCAD: SIGNAL & Movement ScenariosI have buy entry on support line.
Expect price grow up more than 200 pips and now seems consolidation price tilll next week.
If you have any idea leave comment below here.
Glad to hear that.

