USDCAD - LONG; Buy it up!! (Correction of the previous post!) Disregard the previous ("EURJPY - LONG; Buy it up for 400 pips!") post!! - It was mean to be this one - USDCAD Long.
The Weekly;
Usdcadsignal


USDCAD | Perspective for the new week | Follow-upCAD appears to have gained some ground after a strong employment report last week which brings me to re-visit my existing stance on this pair.
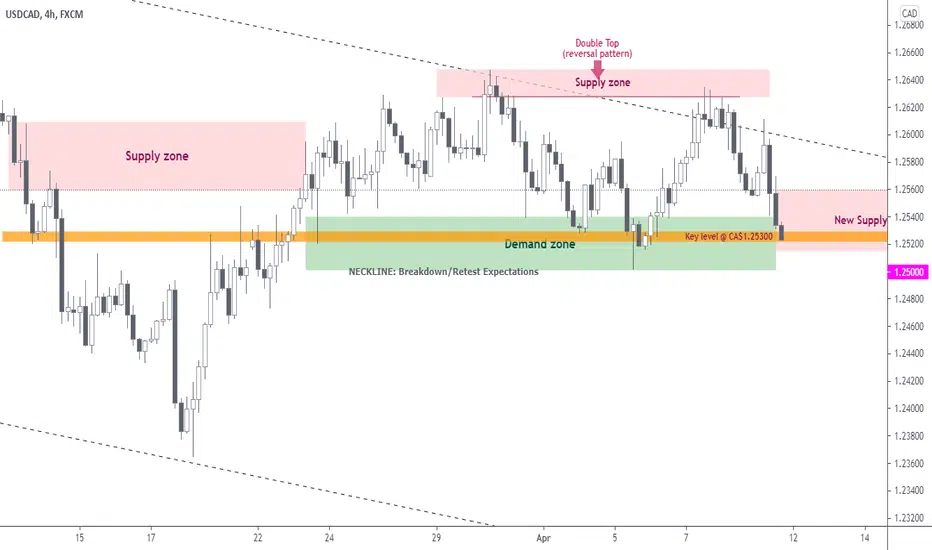
The price moved over 160pips in our direction since my last publication before meeting selling pressure @ CA$1.265000 followed by rejection at this same area during last week trading session to make a complete Reversal pattern (Double Top) at exactly the peak of the Channel Trendline (see link below for reference purposes). This feat completely emphasizes that price action is about respecting the Descending Channel (See chart below) one more time as I look forward to a breakdown/Retest of Neckline which is also my Key level @ CA$1.25300 for confirmation in the coming week(s)!
Tendency: Downtrend ( Bearish )
Structure: Breakdown | Supply & Demand | Reversal Pattern (Double Top)
Observation: i. Since the last quarter of last year, the price has been fluctuating between consistent highs and lows within a Channel in a downward trend.
ii. Double Top: The appearance of an extremely bearish technical reversal pattern that formed after price touched a high @ around CA$1.26500/1.26350 area two consecutive times with a moderate decline between the two highs calls for a Bearish bias in the coming week(s).
iii. As at the time of this analysis, price is hovering in a Demand area (CA$1.25300 - neckline) that might thrust price up hereby making us revert to my previous bias ( see link below).
iv. Opening a sell position on this pair can only be confirmed below Key level. Waiting for a significant Breakdown/retest of Neckline @ CA$1.25300 (Demand zone) is the only means of confirming that the Bears have come to stay at this juncture... trade consciously :)!
Trading plan: SELL confirmation with a minimum potential profit of 250 pips.
Risk/Reward : 1:5
Potential Duration: 5 to 10days
NB: This speculation might be considered to make individual decisions on the lower timeframe.
Watch this space for updates as price action is been monitored.
Risk Disclaimer:
Margin trading in the foreign exchange market (including foreign exchange trading, CFDs, etc.) has a high risk and is not suitable for all investors. The content of this speculation (including all data) is organized and published by me for the sole purpose of education and assistance in making independent investment decisions. All information herein is for your reference only and I take no responsibility.
You are hereby advised to carefully consider your investment experience, financial situation, investment objective, risk tolerance level, and consult your independent financial adviser as to the suitability of your situation prior to making any investment.
I do not guarantee its accuracy and is not liable for any loss or damage which may result directly or indirectly from such content or the receipt of any instruction or notification therewith.
Past performance is not necessarily indicative of future results.
USD/CAD - It will be a good opportunity to open long position🔥The sixth time the price is trying to break the resistance line. It's starting to work out a little bit. I expect an entry point after retest.
Write in the comments all your questions and instruments analysis of which you want to see.
Friends, push the like button, write a comment, and share with your mates - that would be the best THANK YOU.
P.S. I personally will open entry if the price will show it according to my strategy.
Always make your analysis before a trade

#USDCAD a break above resistance will confirm SHS pattern#USDCAD a break above resistance will confirm SHS pattern

USDCAD - to the 1.2800Strong Buy Force leading to at least the 1.28000
daily 20ma crossing, buy signal.
wedge being broken,
forcing major trendline to break
combination

USDCAD: Ready to go shortI expect fall of usd and downtrend channel continuous in this pair. so i take this trade fast

USDCAD Possible INVERSE HEAD & SHOULDERSHere is a possible quick setup for you guys!
FX:USDCAD
Overall trend on larger timeframes is showing prices headed downwards to possibly create an inverse head & shoulder signifying a possible reversal to the upside if price finds strong enough USD support to break the neckline. I applied our Fibonacci Retracement tool on the following levels, from the HIGH of Mar 30th @1.2647 to the LOW of March 31st @1.2365.
(If you didn't know Fibonacci Retracement tool is used to find and visualize better entry and exit points in a trending market wave.)
Here is my suggestion,
Low risk Swing/Intraday Setups with possibility of massive gains if USD strength can continue to the upside. I will be monitoring DXY(DOLLAR INDEX) closely. As of right now the DOLLAR has been falling for 2 days but I expect it to find some solid support soon. This explains this pull back DOWN we are seeing on USD/CAD. Tomorrow's FOMC MEETING MINUTES (NEWS) & oil reports may cause some havoc for this pair since Canada also has a direct correlation to OIL. Make sure to trade with CAUTION. WE DO NOT chase the markets. Try your best to patiently allow the market to come to our entries. If our entries are not triggered that is OK, I will update analysis & give new entries. I REPEAT WE ARE WAITING FOR ENTRIES TO TRIGGER , WE ARE NOT YET IN A TRADE. We want the lowest RISK set up possible with the possibility of a high reward.
Risk anywhere from 1-3% ONLY of your total capital by placing small LONG orders on each of these below retracement levels:
23.6% = 1.2580 (LONG) 0.10% Risk
38.2% = 1.2539 (LONG) 0.15% Risk
50.0% = 1.2506 (LONG) 0.20% Risk
61.8% = 1.2472 (The Ideal trade) (LONG) 0.25% Risk (MY ENTRY #1)
78.6% = 1.2425 (PERFECT Sniper entry) (LONG) 0.30% RISK (MY ENTRY # 2)
Stop Loss: @ 1.2364 (1:3)(TP 3) Risk to Reward
(1:2)(TP 2) Risk to Reward
Take Profit #1 @ 1.2594 (Close 50-75% of total trade positions and allow the rest to run risk FREE)
Take Profit #2 @ 1.2683
Take Profit #3 @ 1.2785
Keep your TOTAL risk at a minimum of 1-3% per trade.
If these trades are triggered, I will be updating the analysis via comments so be on the look out. :)
If you like these quick informative post/tips please drop a LIKE & make sure to FOLLOW ME!!

Start dumping the CAD!! Long USDCAD, AUDCAD for 750 pipsSpeculators (Loonie longs) are starting to have a difficult time here to get any more skewed than they already are. (and all for what?!)
Also, they are unlikely be able to take too much heat, in what is The Weakest FX (long) positioning in the civilized world, before a spectacular implosion.
This one (title chart) is a severe liquidity issue, at best;
The USDCAD Weekly;
The AUDCAD Long is all about plain (insurmountable) capital flows - i.e. common sense;


USDCAD SELL | Going downHello Traders, here is the full analysis for this pair.
Watch strong action at the current levels for SELL GOOD LUCK! Great SELL opportunity USDCAD .
I still did my best and this is the most likely count for me at the moment.
Support the idea with like and follow my profile TO SEE MORE.
Traders, if you liked this idea or if you have your own opinion about it, write in the comments. I will be glad 🤝
Patience is the If You Have Any Question, Feel Free To Ask 🤗

USDCADs I said on February 14 at the last technical analysis ...I am waiting for a rejection confirmation up to the trend line area and I will search again for BUY up to the 1.29400 area!
THIS WEEK...I will wait to see if it closes March over the trend line and I will set my long-term BUY option to the 1.29400 area, from where I think it will go down again to the trend line formed in the last 10 years!
NOTE: Please, give a LIKE if you find this idea useful!
GREAT ATTENTION:
Our analyzes have an accuracy of over 91% but due to market manipulations during this period we will avoid putting exact values on SL!
We also recommend avoiding short-term trades during this period because news can appear at any time that can destabilize the market.
*This information is not a Financial Advice.

USDCAD | Perspective for the new week | Follow-upThe price moved against us since my last publication ( see link below for reference purposes) as CA$1.26000 level was unable to hold on the back of crude oil volatility. The Bearish run that has lasted exactly a year appears to be building a reversal pattern with my Key level @ CA$1.24900 representing a Neckline.
With the present simple structure, it appears that the Greenback will likely move higher over the next couple of weeks as the price is expected to remain supported in the long term around my Key level considering the fact that crude oil market volatility is calming down.
Tendency: Uptrend ( Bullish )
Structure: Breakout | Supply & Demand | Reversal pattern
Observation: i. Since the Breakdown of Key level @ CA$1.29400 on the 12th of March 2021, the price finally shows signs of Breaking and closing above this level during last week trading session.
ii. Even as the possibility of a correction move that might extend deep into CA$1.24500 might happen in the coming week, buying above Key level is most sensible in this setup. Why?
iii. We have been on a Downtrend for an extended period of time and it will only make sense that we are patient to confirm that the Buyers have finally taken over hence anywhere above Key level seems very reasonable.
iv. In case you find yourself buying above Key level before the deep, it is advisable to opt-out once the price deep below $1.24800 with the intention of planning a re-entry... Trade consciously!
Trading plan: BUY confirmation with a minimum potential profit of 250pips.
Risk/Reward : 1:4
Potential Duration: 4 to 10 days
NB: This speculation might be considered to make individual decisions on the lower timeframe.
Watch this space for updates as price action is been monitored.
Risk Disclaimer:
Margin trading in the foreign exchange market (including foreign exchange trading, CFDs, etc.) has a high risk and is not suitable for all investors. The content of this speculation (including all data) is organized and published by me for the sole purpose of education and assistance in making independent investment decisions. All information herein is for your reference only and I take no responsibility.
You are hereby advised to carefully consider your investment experience, financial situation, investment objective, risk tolerance level, and consult your independent financial adviser as to the suitability of your situation prior to making any investment.
I do not guarantee its accuracy and is not liable for any loss or damage which may result directly or indirectly from such content or the receipt of any instruction or notification therewith.
Past performance is not necessarily indicative of future results.

USDCAD: Good Entry for take a short term signalA clear fix descending trend is drawed; so we take this

USDCAD BUY1. Reversal zone with reversal pattern HCH
2. Fibonacci resistance 61% 78% zone
3. Retrecement pattern breakout and retest

Multiple Bottom On The USDCADWe have are seeing a multiple bottom on the USDCAD Pair and I think price is ready to shoot up to the moon.
Long positions at market price
Stop loss at 1.26517
Target at 1.2975
Note: I have closed my other sell signal on the pair.

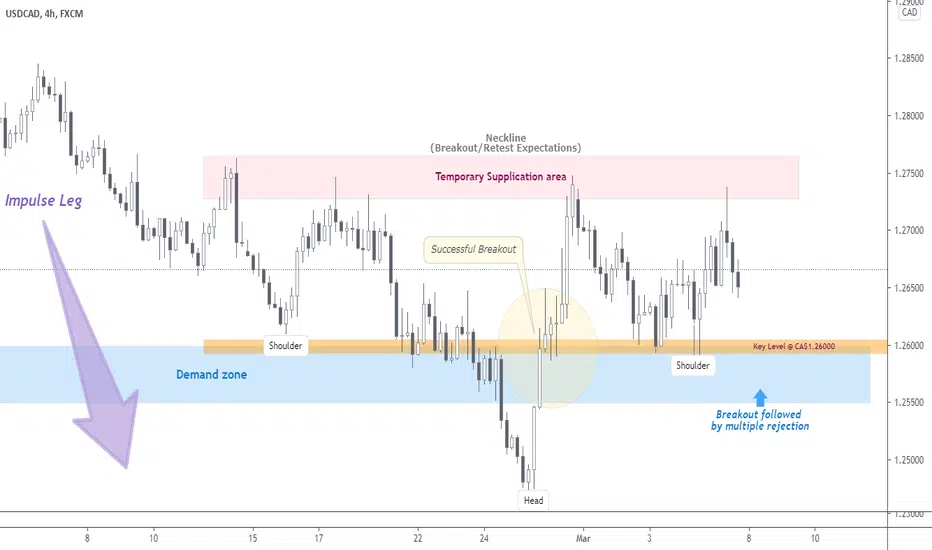
USDCAD | Perspective for the new week | Follow-upThe Bearish trend that began in October 2020 appears to have found a bottom @ around CA$1.24500 as the pattern transpose into what looks like an Inverse Head and Shoulder - a very strong reversal pattern.
My last publication on this pair still holds as I continue to look for Bullish expectations (see link below for reference purposes) following signs of positive expectations from the Greenback as the Non-Farm Payrolls report indicated that the U.S. economy added 379,000 jobs in February, a report that significantly exceeded analyst expectations.
Tendency: Uptrend ( Bullish )
Structure: Breakout | Supply & Demand | Reversal pattern (Inverse H & S)
Observation: i. Breakout of my Key level @ CA$1.26000 late February 2021 followed by multiple rejections of this level during last week trading session supports the expectation of a rally in the nearest future as the price remains supported at this level.
ii. After a significant Bearish Impulse leg, the appearance of an Inverse Head & Shoulder keeps my expectation LONG in the coming week(s).
iii. Bearish Leg that began Oct. 2020 falls to make a Shoulder and then rises to the Neckline(CA$1.27500); price then falls again and below the former Shoulder to make a Head and then rises again; finally, the price falls again but not as far as the second Shoulder with a good possibility of a Breakout/Retest expectation of Neckline @ CA$1.27500.
iv. Even as the CA$1.26000/1.25500 area remains a strong Demand area for me, a Breakout/Retest confirmation of Neckline might be a very good area you might want to join the rally.
Trading plan: BUY confirmation with a minimum potential profit of 350 pips.
Risk/Reward : 1:3.5
Potential Duration: 8 to 15days
NB: This speculation might be considered to make individual decisions on the lower timeframe.
Watch this space for updates as price action is been monitored.
Risk Disclaimer:
Margin trading in the foreign exchange market (including foreign exchange trading, CFDs, etc.) has a high risk and is not suitable for all investors. The content of this speculation (including all data) is organized and published by me for the sole purpose of education and assistance in making independent investment decisions. All information herein is for your reference only and I take no responsibility.
You are hereby advised to carefully consider your investment experience, financial situation, investment objective, risk tolerance level, and consult your independent financial adviser as to the suitability of your situation prior to making any investment.
I do not guarantee its accuracy and is not liable for any loss or damage which may result directly or indirectly from such content or the receipt of any instruction or notification therewith.
Past performance is not necessarily indicative of future results.
SELL USD/CAD LONG-TERM TRADE IDEAAfter USDCAD has been moving in a downtrend, it has paused a bit to retrace to a resistance which touched the trendline and a major level which it was resisting for quite a long time, I am looking forward to selling this currency pair on Monday for a long term trade but I will first have to wait for a good price on lower time-frames...But overall I think it's still continuing with its Bearish trend
The MACD supports this
The resistance level
The Bearish/Downtrend movement
The last closing candle on the resistance was a 1D bearish candle, a Bearish pin-bar
anyways we never know where the market will head on Monday but all the best if you decide to take this trade


USDCADHello Guys Welcome back to another profit week
If you like my idea please give me a like and comment, Thats will be a great appreciation to do more predictions
Here is the full analysis for this pair, Let me know in the comment section below if you have any questions, the entry will be taken only if all rules of the strategies will be satisfied. I suggest you keep this pair on your watchlist and see if the rules of your strategy are satisfied.
USDCAD near to touch the resistant zone there will be a big chance for a sell iff not break the channel
Remember this analysis is not 100% accurate No single analysis is To make a decision follow your own thoughts.
The information given is not a Financial Advice.
Please support this idea with a like, if you find it useful
have a good profit week guys

USD/CAD Short From Resistance This has retraced nicely to the point I marked out in my previous analysis for the pair. This is a good shorting entry to the target of 1.22500 with SL just above the resistance level. MACD is still below 0 so that signifies this is still bearish and EMA's are very close to crossing but I expect this to drop from here.

