USDCADTime = 2H
– Structure = Downtrend
– Pattern = Descending Triangle
– Tendency = Downtrend
Price might move above slightly in-search of Clear resistance, but the trend is Downtrend
GOOD LUCK
-----------------------
DISCLAIMER: This is NOT an Investment Signal, Trade at your Own Risk.
Usdcadsignal

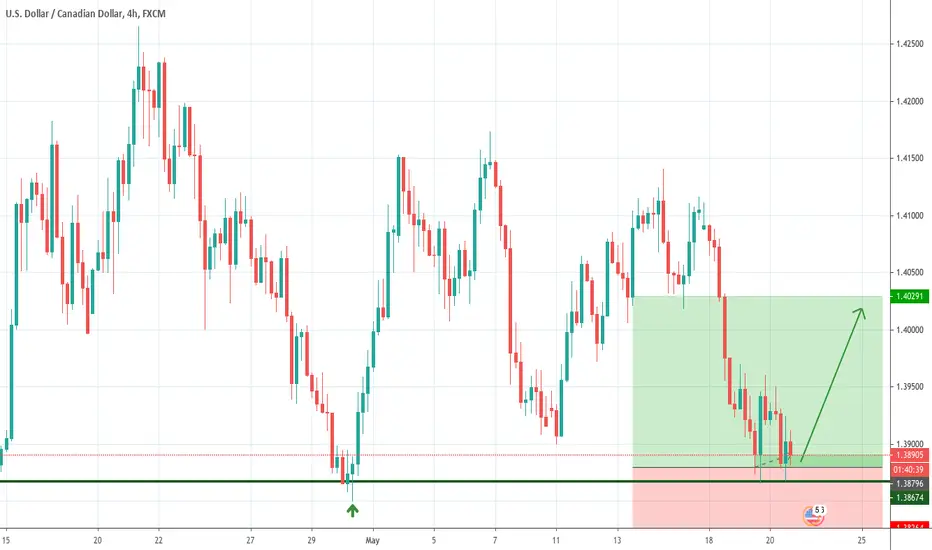
USDCAD bounced from support, potential for a further rise!
USDCAD bounced off 1.37399 where it could potentially rise further to 1.38730.
Trading CFDs on margin carries high risk.
Losses can exceed the initial investment so please ensure you fully
understand the risks.

USD/CAD, price action speaks Bearish languageUSD/CAD has recently broken support area. After daily close, this will become new resistance for the price. If the price retests this, we will be looking for shorts with our members.


USDCAD Long D1 Entry Further to my previous analysis on the USDCAD D1 chart.
I see an entry today and add on to this at the break of the box later.
Please note TradingView is NOT my trading platform. I trade on my MT4 platform.
Previous Idea linked below

USDCAD BUY- A strong buyLikes and comments if you want more trading setup. Thank you!
Visit our channel!
We are seeing price has a
strong support.
A double bottom was formed,
which confirmed the buy, and
the price went up, responding
positively to the support.

USD/CAD short/sell idea almost 80 pips move...In the name of ALLAH who is most merciful and the master...
I strictly take trading as a business, not a gambling stuff.
I have calculated approximate risk to reward ratio on every single trade with predefined profit/loss levels.
Please note:
-> Never go beyond 1.5% risk of your total trading capital on a single trade,
-> Always move your stops to your entry levels after the price moves 26 pips towards target,
-> Always close 71% of your trade position after market makes half movement towards target.
Every one has a right to earn a lot of money, but it can only be done by following the rules and principles very strictly!!!
REMEMBER:
I practice patience in trading.
NO EMOTIONS. NO GREED. NO FEAR at all... that's how I do this business...
My Risk to Reward Ratio is usually more than 1:3 therefore if I loose a trade, I loose small capital...
But when I win, I win really really big...
Day after day... Weak after weak... I GROW...
---------------------
REQUEST:
Please take out some proportion of money from your profits and donate to the poor people...

USDCAD Long (Support)Based on previous moves from the support lines, for sure worth the risk/reward ratio.

USD/CAD, expect price to hit bottom of the Symmetrical TriangleUSD/CAD is rejecting resistance Trend so there is a great chance for some bearish price action which can lead the price to the downside.

USD/CAD short/sell idea almost 170 pips move...In the name of ALLAH who is most merciful and the master...
We strictly take trading as a business, not a gambling stuff.
We have calculated approximate risk to reward ratio on every single trade with predefined profit/loss levels.
Please note:
-> Never go beyond 1.5% risk of your total trading capital on a single trade,
-> Always move your stops to your entry levels after the price moves 100 pips towards target,
-> Always close 75% of your trade position after market makes half movement towards target.
Every one has a right to earn a lot of money, but it can only be done by following the rules and principles very strictly!!!
REMEMBER:
We practice patience in trading.
NO EMOTIONS. NO GREED. NO FEAR at all... that's how we do this business...
Whenever we loose a trade, no issue, we loose small capital...
But when we win, we win really really big...
Day after day... Weak after weak... WE GROW...
---------------------
REQUEST:
Please take out some proportion of money from your profits and donate to the poor people...

USD/CAD short/sell idea almost 140 pips move...In the name of ALLAH who is most merciful and the master...
We strictly take trading as a business, not a gambling stuff.
We have calculated approximate risk to reward ratio on every single trade with predefined profit/loss levels.
Please note:
-> Never go beyond 1.5% risk of your total trading capital on a single trade,
-> Always move your stops to your entry levels after the price moves 100 pips towards target,
-> Always close 75% of your trade position after market makes half movement towards target.
Every one has a right to earn a lot of money, but it can only be done by following the rules and principles very strictly!!!
REMEMBER:
We practice patience in trading.
NO EMOTIONS. NO GREED. NO FEAR at all... that's how we do this business...
Whenever we loose a trade, no issue, we loose small capital...
But when we win, we win really really big...
Day after day... Weak after weak... WE GROW...
---------------------
REQUEST:
Please take out some proportion of money from your profits and donate to the poor people...

USD/CAD Long PositionHypothetical scenario (11/05 - 15/05):
(1) Entry @ 1.39290 (Buy Limit)
(2) Stop Loss @ 1.38990 | 30 pips
(3) Target @ 1.39890 |60 pips
(4) R:R = 1:2

USD/CAD TRADE SHORTUSD / CAD will break its support line and will go to the specified arrow.
FOLLOW ME. STAY INFORMED UNTILL THE ANALYSIS IS DONE.

On his way to the resistance #USDCADA very interesting pattern of support and resistance was created with 3 support points and 3 resistance points, because of our proximity to the support line and the margin we have until reaching the resistance line we recommend buying
The bullish trend supports our model
Target: 1.4120


USD/CAD Long Position
Hypothetical scenario (11/05 - 15/05):
(1) Entry @ 1.38660 (Buy Limit)
(2) Stop Loss @ 1.38360 | 30 pips
(3) Target @ 1.39260 |60 pips
(4) R:R = 1:2


USD/CAD short/sell idea almost 180 pips move...In the name of ALLAH who is most merciful and the master...
We strictly take trading as a business, not a gambling stuff.
We have calculated approximate risk to reward ratio on every single trade with predefined profit/loss levels.
Please note:
-> Never go beyond 1.5% risk of your total trading capital on a single trade,
-> Always move your stops to your entry levels after the price moves 100 pips towards target,
-> Always close 75% of your trade position after market makes half movement towards target.
Every one has a right to earn a lot of money, but it can only be done by following the rules and principles very strictly!!!
REMEMBER:
We practice patience in trading.
NO EMOTIONS. NO GREED. NO FEAR at all... that's how we do this business...
Whenever we loose a trade, no issue, we loose small capital...
But when we win, we win really really big...
Day after day... Weak after weak... WE GROW...
---------------------
REQUEST:
Please take out some proportion of money from your profits and donate to the poor people...


USD/CAD short/sell idea almost 150 pips move...In the name of ALLAH who is most merciful and the master...
We strictly take trading as a business, not a gambling stuff.
We have calculated approximate risk to reward ratio on every single trade with predefined profit/loss levels.
Please note:
-> Never go beyond 1.5% risk of your total trading capital on a single trade,
-> Always move your stops to your entry levels after the price moves 100 pips towards target,
-> Always close 75% of your trade position after market makes half movement towards target.
Every one has a right to earn a lot of money, but it can only be done by following the rules and principles very strictly!!!
REMEMBER:
We practice patience in trading.
NO EMOTIONS. NO GREED. NO FEAR at all... that's how we do this business...
Whenever we loose a trade, no issue, we loose small capital...
But when we win, we win really really big...
Day after day... Weak after weak... WE GROW...
---------------------
REQUEST:
Please take out some proportion of money from your profits and donate to the poor people...

USD/CAD long/buy idea, almost 170 pips move...In the name of ALLAH who is most merciful and the master...
We strictly take trading as a business, not a gambling stuff.
We have calculated approximate risk to reward ratio on every single trade with predefined profit/loss levels.
Please note:
-> Never go beyond 1.5% risk of your total trading capital on a single trade,
-> Always move your stops to your entry levels after the price moves 100 pips towards target,
-> Always close 75% of your trade position after market makes half movement towards target.
Every one has a right to earn a lot of money, but it can only be done by following the rules and principles very strictly!!!
REMEMBER:
We practice patience in trading.
NO EMOTIONS. NO GREED. NO FEAR at all... that's how we do this business...
Whenever we loose a trade, no issue, we loose small capital...
But when we win, we win really really big...
Day after day... Weak after weak... WE GROW...
---------------------
REQUEST:
Please take out some proportion of money from your profits and donate to the poor people...

USD/CADHI
The USD / CAD has reacted to its support level and will move upwards.
And it's the best time to trade.
HAVE A GOOD DAY.
