Usdcadsignal


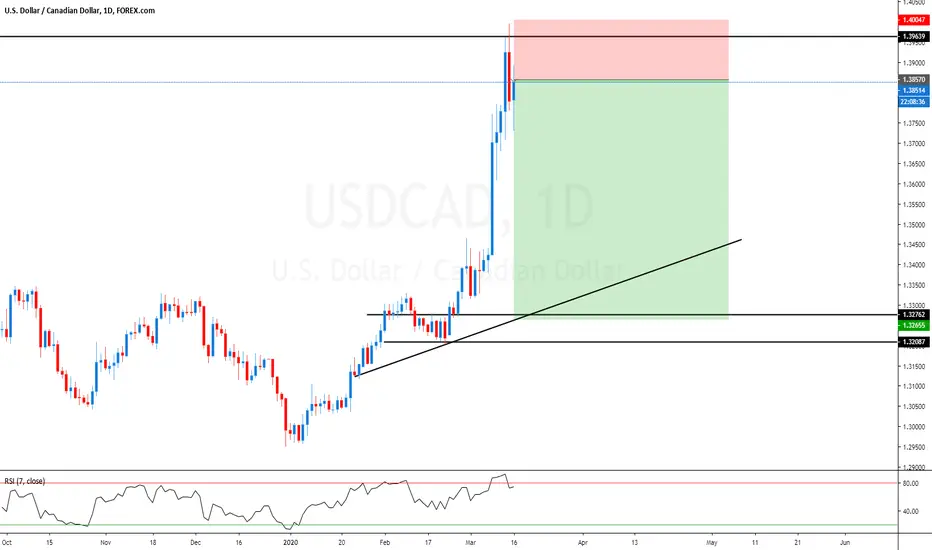
USDCAD, SELL on H4- A potential FULL Flag formation
- if close above the channel high, confirms the breakout the bull flag
- if close below the short ascending channel, might expose 1.3750

USD/CAD short/sell idea, almost 80 pips move...In the name of ALLAH who is most merciful and the master...
We strictly take trading as a business, not a gambling stuff.
We have calculated approximate risk to reward ratio on every single trade with predefined profit/loss levels.
Please note:
-> Never go beyond 1.5% risk of your total trading capital on a single trade,
-> Always move your stops to your entry levels after the price moves 100 pips towards target,
-> Always close 75% of your trade position after market makes half movement towards target.
Every one has a right to earn a lot of money, but it can only be done by following the rules and principles very strictly!!!
REMEMBER:
We practice patience in trading.
NO EMOTIONS. NO GREED. NO FEAR at all... that's how we do this business...
Whenever we loose a trade, no issue, we loose small capital...
But when we win, we win really really big...
Day after day... Weak after weak... WE GROW...
---------------------
REQUEST:
Please take out some proportion of money from your profits and donate to the poor people...

SHORT (SELL) on USDCAD at MARKETUSDCAD has hit the brick wall that is WR1 resistance at 1.4164. With USD weakening in the late afternoon US session this SHORT trade could play out. On the higher time frames the price is what I call "hanging" D1 being a good example of this. Price has bounced at 1.3848 but the downward pattern looks incomplete and the BEARS could possibly drive the price lower but CAD is still suffering from the crushing jobs numbers yesterday.This trade has a 54 pip STOP (entry 1.4136 and STOP at 1.4190) . TARGET is provisionally 1.3950 but will have to be reconsidered depending on whether the trade survives the Asian session tonight

USDCAD ENTER NOWHI, TRADERS
MY NAME IS KD
TODAY I HAVE A GOOD STRATEGY PUBLISH TO ALL OF YOU :)
YOU CAN CLOSE YOUR TRADE ANYTIME AFTER YOU SEE PROFIT.
THERE IS NO OBLIGATION TO CLOSE AT TARGET TP.
RISK MANAGEMENT IS VERY IMPORTANT :)
HAPPY TRADING~
_________________________________________________
WANT TO LEARN MORE OR RECEIVE ACCURATE AND IMMEDIATE SIGNAL?
Telegram: KDEZ00


USD/CAD short/sell idea, almost 530 pips move...In the name of ALLAH who is most merciful and the master...
We strictly take trading as a business, not a gambling stuff.
We have calculated approximate risk to reward ratio on every single trade with predefined profit/loss levels.
Please note:
-> Never go beyond 1.5% risk of your total trading capital on a single trade,
-> Always move your stops to your entry levels after the price moves 100 pips towards target,
-> Always close 75% of your trade position after market makes half movement towards target.
Every one has a right to earn a lot of money, but it can only be done by following the rules and principles very strictly!!!
REMEMBER:
We practice patience in trading.
NO EMOTIONS. NO GREED. NO FEAR at all... that's how we do this business...
Whenever we loose a trade, no issue, we loose small capital...
But when we win, we win really really big...
Day after day... Weak after weak... WE GROW...
---------------------
REQUEST:
Please take out some proportion of money from your profits and donate to the poor people...

U.S. DOLLAR / CANADIAN DOLLAR (USDCAD) DailyDates in the future with the greatest probability for a price high or price low

U.S. DOLLAR / CANADIAN DOLLAR (USDCAD) WeeklyDates in the future with the greatest probability for a price high or price low

U.S. DOLLAR / CANADIAN DOLLAR (USDCAD) MonthlyDates in the future with the greatest probability for a price high or price low

USDCAD Oil prices are plummeting which will skyrocket USDCAD to BoC easing and Oil prices are plummeting which will skyrocket USDCAD to 1.45 near.
A rate cut will occur in near future, COVID-19 and World Economy along with US is declining. USDCAD pair will touch our TP 1.45 / 1.46


USDCAD : Will it turn BearishUSDCAD ;
Trade : Short/Sell
Profit Target : 7% < 15% (Swing & Long term)
Trade Type : Reversal

USDCAD SELL SHORTS from pink box zone given await rejection then enter, if it doesn't reject this trade set up is then invalid
SMALL LOT SIZES

USDCAD at top side resistanceUSDCAD
CAD pairs are mostly influenced by the price movements in oil market
USDCAD has break the major resistance zone 1.41000 and run up to 1.46800 and stalled
The upward trend-line was broken in One hour chart
We can expect short term fall back as its in overbought condition
We can enter at the 1.44700 level which is 78.6% Fibonacci level
Potential take profit will be 1.41750 which is 50.0 % Fibonacci level
In between this level there is major deciding level is there which is 6.8% Fibonacci
Leave your valuable comments below

USDCAD short trade ideaPlan : wait for the rejection candle pattern to form e.g. bearish engulfing, pinbar, etc --> SELL
**Disclaimer** the content on this analysis is subject to change at any time without notice, and is provided for the sole purpose of assisting traders to make independent investment decisions.
Traders!! if you like my ideas and do take the same trade like i do, please write it in comment so we can manage the trade together.
_____________________________________________________________________________________________________________________
Thank you for your support ;)
GWBFX


USDCAD-opposite to the safe heaven assetsUSDCAD
The CAD movement is mostly based on the movement in oil market.
As the Canada is one of the major oil exporting countries and their economy is also depends on this type of oil based industries
After touching the march low which is 1.33250 it has reached almost 1.40000 level
We can expect short term fall back towards 1.36400 which is also a 50% Fibonacci
Suitable long positions may opened at this level
Potential take profit will be 1.40000
Stop lose may placed below the 100 EMA zone as i marked in the chart
Leave your valuable comments related to this pair

USDCAD - DAILY - SHORT SETUPUsdcad has been uptrend for over 3 weeks and now its at a monthly supply level so we can see a correction on the way on daily and H4 timeframes.
#USDCAD, Keep buyingThe USDCAD is above the important moving average lines (100,200).
The candles are located above the Ichimoku cloud
The trend is a definite upward trend
Target: The USDCAD will look for a resistance line and this line is at 1.3980 so that will be our target.
