Usdcadsignal

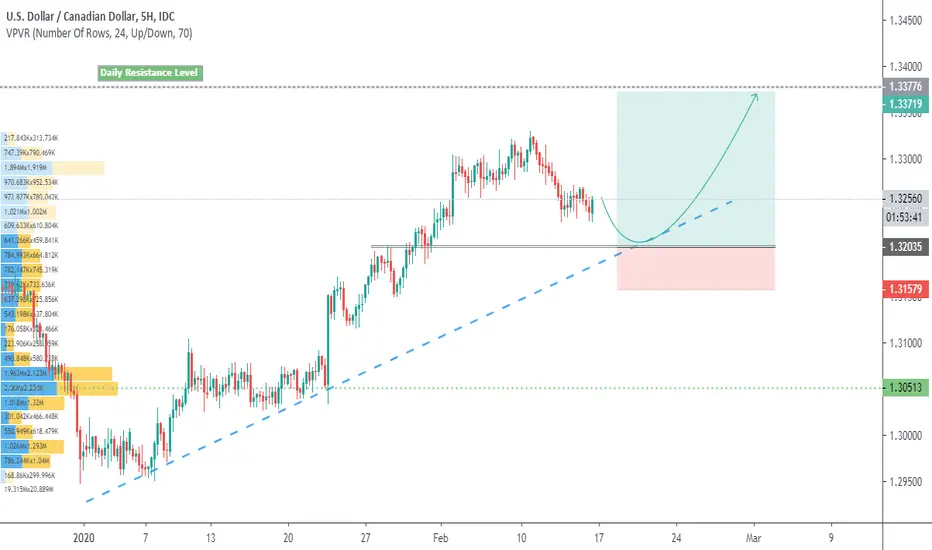
USDCAD buy on H5we might see a potential continuation trend if price be able to bounce from 1.3200 support level which align with trendline support.
Plan : wait for price to bounce off from horizontal or trendline support --> wait for the rejection candle pattern to form e.g. bullish engulfing, pinbar etc --> BUY
**Disclaimer** the content on this analysis is subject to change at any time without notice, and is provided for the sole purpose of assisting traders to make independent investment decisions.
Traders!! if you like my ideas and do take the same trade like i do, please write it in comment so we can manage the trade together.
_____________________________________________________________________________________________________________________
Thank you for your support ;)
GWBFX
USD/CAD LONG SET UPUSD/CAD BUY
Entry 1 1.32444
Entry 2 1.32380
Sl 1.32280
Tp.1 1.32644
Tp.2 1.32844
Tp.3 1.33044

USDCAD has broken its trend channel! whats next?USDCAD has caught my attention these past few days (pls take a look at my roadmap! link attached below) and its trend channel development is also similar to USDSGD, price reacts to the daily key resistance level and we will wait for price retracement before placing any sell order.
Plan : wait for prices to bounce off from key resistance level --> wait for the rejection candle pattern to form e.g. bearish engulfing, pinbar etc --> SELL
**Disclaimer** the content on this analysis is subject to change at any time without notice, and is provided for the sole purpose of assisting traders to make independent investment decisions.
Traders!! if you like my ideas and do take the same trade like i do, please write it in comment so we can manage the trade together.
_____________________________________________________________________________________________________________________
Thank you for your support ;)
GWBFX

USDCAD - DAILY - MAJOR SHORT SETUPUsdcad - Daily - The time has come for a bearish reversal on this pair.. great R2R and setup..

USDCAD - Waiting...I think we have to wait for a correction, then make a decision, because we are in a huge downtrend in 1D.

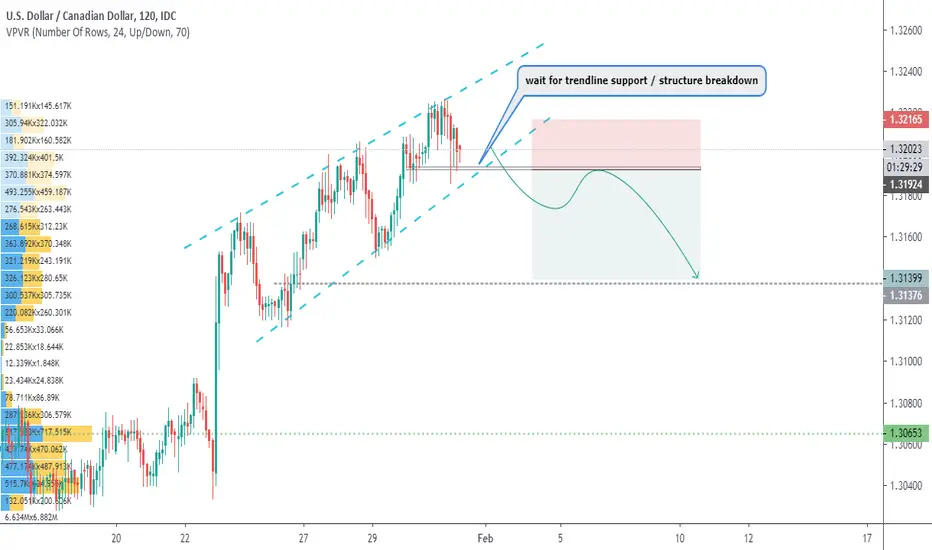
USDCAD, price inside a rising wedge pattern!Plan : trendline breakdown --> wait for prices to bounce off horizontal resistance --> wait for the rejection candle pattern to form e.g. bearish engulfing , pinbar etc --> SELL
**Disclaimer** the content on this analysis is subject to change at any time without notice, and is provided for the sole purpose of assisting traders to make independent investment decisions.
Traders!! if you like my ideas and do take the same trade like i do, please write it in comment so we can manage the trade together.
_____________________________________________________________________________________________________________________
Thank you for your support ;)
GWBFX
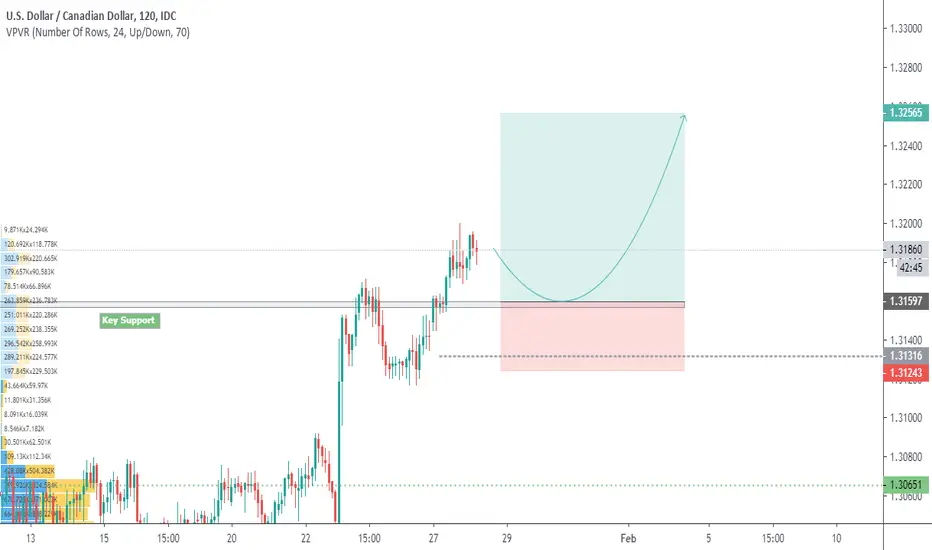
USDCAD trade idea on H2Plan : wait for prices to bounce off horizontal key support --> wait for the rejection candle pattern to form e.g. bullish engulfing , pinbar etc --> BUY
**Disclaimer** the content on this analysis is subject to change at any time without notice, and is provided for the sole purpose of assisting traders to make independent investment decisions.
Traders!! if you like my ideas and do take the same trade like i do, please write it in comment so we can manage the trade together.
_____________________________________________________________________________________________________________________
Thank you for your support ;)
GWBFX
My Idea on USDCAD for the weekIm looking for buys but first Im specting price to reach heavy zones of rejection also keeping on mind the reversal patterns

CATHC THE DROP ON USDCADANALYSIS ON USDCAD
Welcome to my analysis
-
4 HR CHart
-
Interesting Point of interest In the USD/CAD pair.
- Price below 200 day EMA.
- look for sell signals.
- possibility of 1 more move to the upside.
- Watch 1.31150 for sell signs.
- MACD showing hidden bearish divergence
Long term i am expecting move to the Downside. Will update soon
Stay Tuned

Another Idea on USDCAD Ill be looking for buying opportunities but only if price breaks zone meanwhile market might go side ways keeping a look out on this pair.

USDCAD 100 Pips pullback possible??bounce form important support level so expected at least to touch the trend lone
USD CAD Signal? Still to go Down?My Analysis on USD CAD, H3 & H4 Timeframe, My Analysis Can be Wrong too don't consider as a signal. Wait For the confirmation and Strong entry reason for it.
I am Waiting For Pushback till resistance level and strong entry reason for shorten trade Opportunity. What About You Please tell me in comment. I Would Love to hear your suggestions....

USDCAD AnalysisWait for Breakout
**Disclaimer**
the content on this analysis is subject to change at any time without notice, and is provided for the sole purpose of assisting traders to make independent investment decisions.
_________________________________________________________________________________________________________________________________________
Thank you for your support!
Tradewithsam

USDCAD LONG TERM SELL-WEEKLY CHARTUSDCAD
This pair felled more then 4% in 2019 and the bearish trend will continue in 2020 also and the recent tensions in middle east also supports the oil prices and this will benefits the CAD pairs also. We can sell after the short term pullback at 1.30970 and potential take profit will be 1.28930. Stop lose may placed at 1.32020.
This pair trading in a downtrend channel


USDCAD sell on H5Plan : wait for prices to bounce off horizontal / trendline resistance --> wait for the rejection candle pattern to form e.g. bearish engulfing , pinbar etc --> SELL
**Disclaimer** the content on this analysis is subject to change at any time without notice, and is provided for the sole purpose of assisting traders to make independent investment decisions.
Traders!! if you like my ideas and do take the same trade like i do, please write it in comment so we can manage the trade together.
_____________________________________________________________________________________________________________________
Thank you for your support ;)
GWBFX
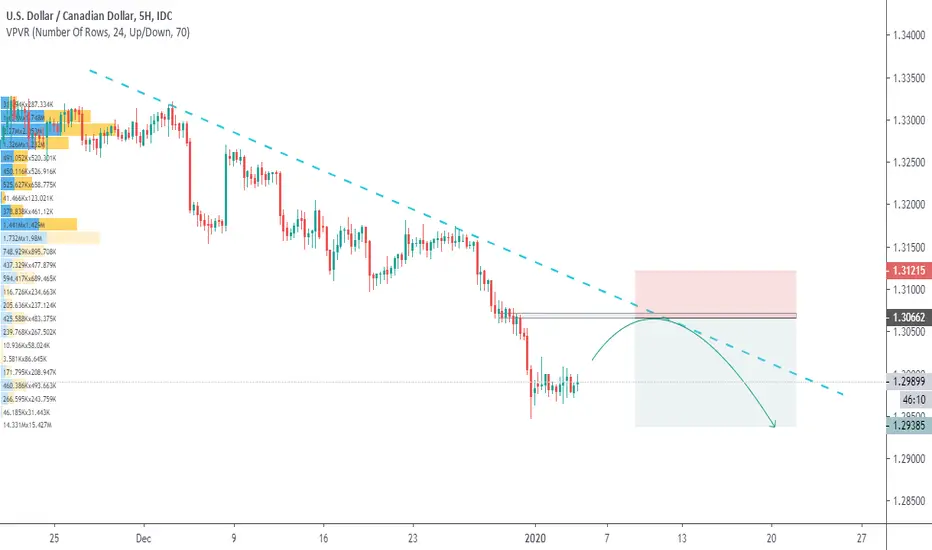
USDCAD (Potential 40 pips - 70 pips)USDCAD (Potential 40 pips - 70 pips)
This my personal view for USDCAD..MY VIEW in DOWN
Red Line = Stop Loss
Green Line = Best Entry Sell
Green Line = Take Profit

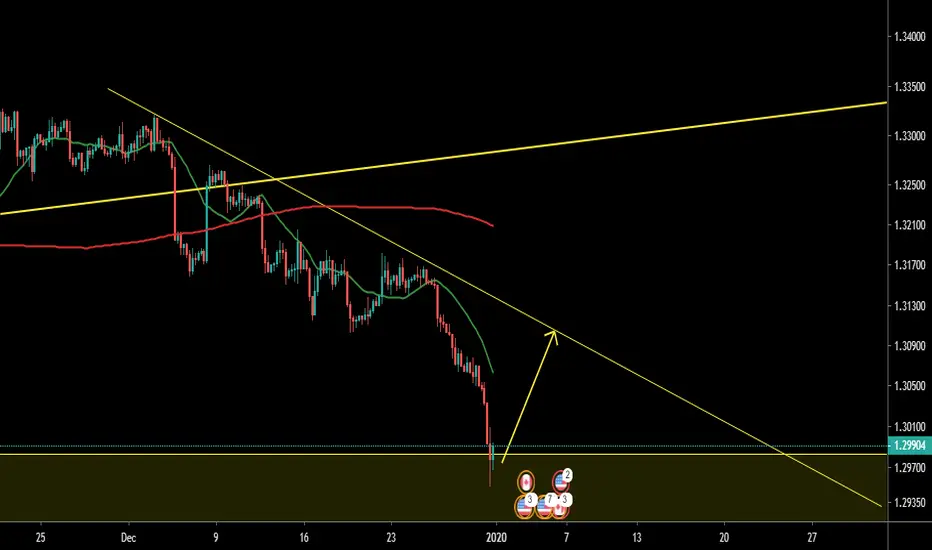
USDCAD in Support Zone: POTENTIAL BUY USDCAD is approaching a support zone from where we could see a rapid movement in the upward direction once the volumes come back in January 2020.
Based on Bullish price action in lower time frames, Traders can look for BUYS between 1.3010-1.3055 with SL below 1.2980. TPs can be set at
1.3180 and 1.3320 respectively.

USDCAD buy on H1Plan : trendline breakout --> wait for prices to bounce off horizontal / trendline support --> wait for the rejection candle pattern to form e.g. bullish engulfing , pinbar etc --> BUY
**Disclaimer** the content on this analysis is subject to change at any time without notice, and is provided for the sole purpose of assisting traders to make independent investment decisions.
Traders!! if you like my ideas and do take the same trade like i do, please write it in comment so we can manage the trade together.
_____________________________________________________________________________________________________________________
Thank you for your support ;)
GWBFX

USDCAD LONG @ DAY CHARTUSDCAD
Due to the trade deal truce the oil prices are shoot up because of that the CAD also gaining some positive momentum at this time
In day chart the 100EMA and 200EMA has crossed towards downward this will attract more sell
The next target for bear is 1.30400 level
From this pint we can initiate the buy orders
And the potential take profit will be 1.33300 its around 290 pips
Stop lose may placed at 1.29900 level for high risk reward ratio
leave your valuable comments..

USDCAD buy on H2, long forecast updateNote : as I had previously predicted there would be a breakout in the trendline resistance (link below)
Plan : wait for prices to bounce off trendline support --> wait for the rejection candle pattern to form e.g. bullish engulfing , pinbar etc --> BUY
**Disclaimer** the content on this analysis is subject to change at any time without notice, and is provided for the sole purpose of assisting traders to make independent investment decisions.
Traders!! if you like my ideas and do take the same trade like i do, please write it in comment so we can manage the trade together.
_____________________________________________________________________________________________________________________
Thank you for your support ;)
GWBFX

My Idea on USDCAD looking for sales I'm looking for potential sells if I see reversal patterns but meanwhile it seems like momentum is breaking the market, we are on a price rage that everyone looks to buy/sells
