USDCAD TREND LINE TRADE SETUPHello traders ,
This my idea. USDCAD. I am waiting for market on the trend line .
once trend line Sell candle confirm then i go for Short.
If you need more my ideas follow me.
Usdcadsignal

USDCAD Signals: Bullish Breakout Above 1.3000USDCAD – technical overview
Above 1.3000 signals an end to a period of longer-term bearish consolidation and suggests the market is in the process of carving out a more significant longer-term base. Next key resistance now comes in up into the 1.4000 area. Setbacks should be very well supported down into the 1.3000 area.
R2 1.3847 – 16 April/2024 high – Strong
R1 1.3792 – 11 June high – Medium
S1 1.3662 – 7 June low – Medium
S2 1.3586 – 10 May low – Strong
USDCAD – fundamental overview
The Canadian Dollar is coming out of a rare session in which it outperformed its peer group. Canada housing data was behind the relative strength after May housing starts accelerated at the fastest pace since September 2023. Key standouts on Tuesday’s calendar come from Eurozone and German sentiment reads, Eurozone CPI, US retail sales, US industrial production, and Fed speak.
Exclusive FX research from LMAX Group Market Strategist, Joel Kruger

#USDCAD: 550+ Pips Buying Opportunity! Do not miss out! FX:USDCAD
Price has started rebound from the area that we had previously had anticipated. However, we will now wait for price to breakthrough the inducement. The news on Thursday and NFP on Friday will be crucial for future of the pair.
**If you like our ideas, then please like, comment and follow us which will encourage to bring more educational ideas like this**
Team Setupsfx_

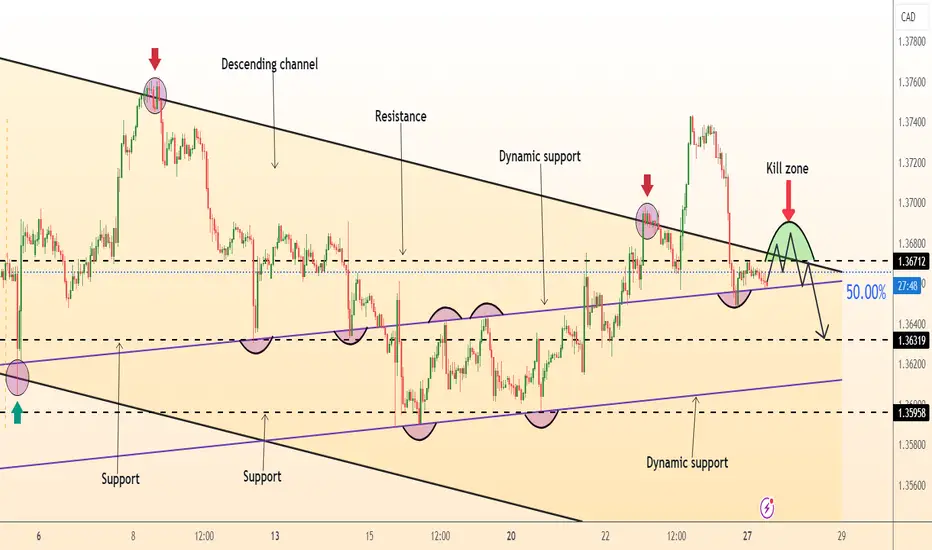
DeGRAM | USDCAD decline from the border in the channelUSDCAD is moving above the trend line in a descending channel.
After a false breakout of the upper boundary, the price has returned to the channel.
The chart is holding under the 50% retracement level of the last bullish impulse.
We expect a decline in the channel after a retest of resistance.
-------------------
Share your opinion in the comments and support the idea with like. Thanks for your support!
USDCAD : Short Trade , 4hHello traders, we want to check the USDCAD chart. The price is moving in a descending channel and has pulled back to the ceiling of the channel and the specified key level. We expect the price to maintain its downward trend and the price will fall to around 1.36000. Good luck.

USDCAD Bank Money Heist Plan To Become a Rich TraderMy Dear Robbers / Traders,
This is our master plan to Heist USDCAD Bank based on Thief Trading style Technical Analysis.. kindly please follow the plan I have mentioned in the chart. Our target is Red Zone that is High risk Dangerous Level, market is overbought / Consolidation / Trend Reversal at the level Bearish Robbers / Traders gain the strength. Be safe and be careful and Be rich.
Note: If you've got a lot of money you can get out right away otherwise you can join with a swing trade robbers and continue the heist plan,
Loot and escape on the target 🎯 Swing Traders Plz Book the partial sum of money Use Trailing Stop To Protect Looted Money and wait for next breakout of dynamic level / Order Block, Once it is cleared we can continue our heist plan to next new target it will update after the Breakouts.
support our robbery plan we can easily make money & take money 💰💵 Join your hands with US. Loot Everything in this market everyday.

USDCAD Top-down analysis Hello traders, this is a complete multiple timeframe analysis of this pair. We see could find significant trading opportunities as per analysis upon price action confirmation we may take this trade. Smash the like button if you find value in this analysis and drop a comment if you have any questions or let me know which pair to cover in my next analysis.

USDCAD BUY | Idea Trading AnalysisUSDCAD is trading along the rising support
And as the pair will soon retest it I am expecting the price to go up To retest the supply levels above at
Hello Traders, here is the full analysis.
Price reversal going up, levels for BUY. Great BUY opportunity USDCAD. ! GOOD LUCK!
I still did my best and this is the most likely count for me at the moment.
-------------------
Traders, if you liked this idea or if you have your own opinion about it, write in the comments. I will be glad 🤝

USDCAD Pair : USDCAD ( U.S Dollar / Canadian Dollar )
Description :
Break of Structure
Head and Shoulder
Bullish Channel as Corrective Pattern in Short Time Frame
RSI - Divergence
Completed " 1234 " Impulsive Waves

usdcad shortThe Canadian Dollar (CAD) eased against the Greenback on Tuesday after the American market session kicked the day off with a risk-off push after US wages outpaced expectations. Investors are gearing up for the US Federal Reserve’s (Fed) latest rate call, slated for Wednesday
USD/CAD is the forex ticker that represents the US Dollar-Canadian Dollar currency pair. The USD/CAD rate, as indicated on the live chart, shows traders how many Canadian Dollars are required to buy one US Dollar. Follow the USD/CAD chart for live prices and stay up to date with the latest USD/CAD news, forecasts and analysis. Our expert industry insights will give you the edge to conduct thorough fundamental and technical analysis to trade this popular currency pair

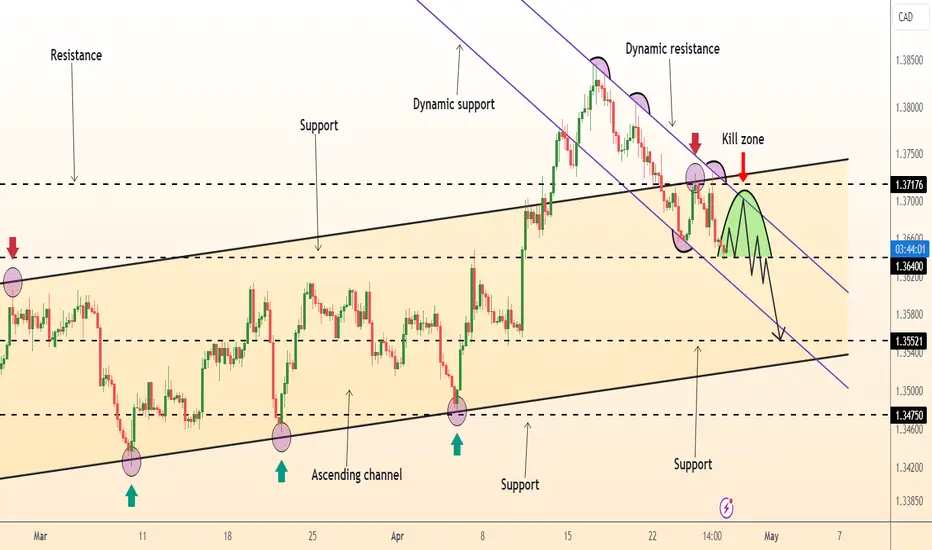
DeGRAM | USDCAD channel pullbackUSDCAD is back within the channel.
The price chart retested the channel boundaries and dynamic resistance.
We expect a decline within the channel after overcoming the current level.
-------------------
Share your opinion in the comments and support the idea with like. Thanks for your support!
USDCAD- Short IdeaEntry: Price broke through the swing low and the trendline with volume. Entry at the bearish zone.
Stop Loss: Slightly above the bearish zone. Give stop loss some room to breathe.
Take Profit: At TP, the nearish bullish zone.

usdcad chartUSD/CAD is the forex ticker that represents the US Dollar-Canadian Dollar currency pair. The USD/CAD rate, as indicated on the live chart, shows traders how many Canadian Dollars are required to buy one US Dollar. Follow the USD/CAD chart for live prices and stay up to date with the latest USD/CAD news, forecasts and analysis. Our expert industry insights will give you the edge to conduct thorough fundamental and technical analysis to trade this popular currency pair. usdcad confirm signal

USDCAD is Ready to Go Up(➡️RR=2.48)🏃♂️ USDCAD is moving in a Descending Channel and is currently near the Uptrend line and🟢 Support zone(1.3704 CAD_1.3618 CAD) 🟢.
💡Also, we can see Regular Divergence(RD+) between two Consecutive Valleys .
🔔I expect USDCAD to rise to at least 1.384 CAD after breaking the upper line of the descending channel.
--------------------------------------------------------------------------
USDCAD
🟢Position: Long
✅Entry Point: 1.37163 CAD (Limit Order)
⛔️Stop Loss: 1.36660 CAD
💰Take Profit:
🎯1.38047 CAD👉Risk-To-Reward: 1.76
🎯1.38411 CAD👉Risk-To-Reward: 2.48
⚠️Please don't forget to follow capital management.
⚠️Please pay attention to the style of opening the position.
--------------------------------------------------------------------------
U.S.Dollar/Canadian Dollar (USDCAD), 1-hour time frame ⏰.
Do not forget to put Stop loss for your positions (For every position you want to open).
Please follow your strategy; this is just my idea, and I will gladly see your ideas in this post.
Please do not forget the ✅' like '✅ button 🙏😊 & Share it with your friends; thanks, and Trade safe

usdcad long USD/CAD is the forex ticker that represents the US Dollar-Canadian Dollar currency pair. The USD/CAD rate, as indicated on the live chart, shows traders how many Canadian Dollars are required to buy one US Dollar. Follow the USD/CAD chart for live prices and stay up to date with the latest USD/CAD news, forecasts and analysis. Our expert industry insights will give you the edge to conduct thorough fundamental and technical analysis to trade this popular currency pair.

usdcad buy USD/CAD is the forex ticker that represents the US Dollar-Canadian Dollar currency pair. The USD/CAD rate, as indicated on the live chart, shows traders how many Canadian Dollars are required to buy one US Dollar. Follow the USD/CAD chart for live prices and stay up to date with the latest USD/CAD news, forecasts and analysis. Our expert industry insights will give you the edge to conduct thorough fundamental and technical analysis to trade this popular currency pair. confirm usdcad signal

usdcad chartThe USD/CAD tells the trader how many Canadian dollars (the quote currency) are needed to purchase one U.S. dollar (the base currency). This currency pair is known as the "Loonie", a nickname derived from the picture of a loon, a distinctive bird which appears on one side of Canada's gold-coloured, one Dollar coin.
In Canada, the organizations and people that affect the most the moves of the USD/CAD pair are:
USD/CAD is the forex ticker that represents the US Dollar-Canadian Dollar currency pair. The USD/CAD rate, as indicated on the live chart, shows traders how many Canadian Dollars are required to buy one US Dollar. Follow the USD/CAD chart for live prices and stay up to date with the latest USD/CAD news, forecasts and analysis. Our expert industry insights will give you the edge to conduct thorough fundamental and technical analysis to trade this popular currency pair.

USDCAD I Correction of recent bullish impulse in progressWelcome back! Let me know your thoughts in the comments!
** USDCAD Analysis - Listen to video!
We recommend that you keep this pair on your watchlist and enter when the entry criteria of your strategy is met.
Please support this idea with a LIKE and COMMENT if you find it useful and Click "Follow" on our profile if you'd like these trade ideas delivered straight to your email in the future.
Thanks for your continued support!

USDCAD : Short Trade , 4hHello traders, we want to check the USDCAD chart. The price is moving in an ascending channel and has reached the specified resistance level. We expect this level to stop the upward trend of the price and the price will fall to around 1.36600. Good luck.

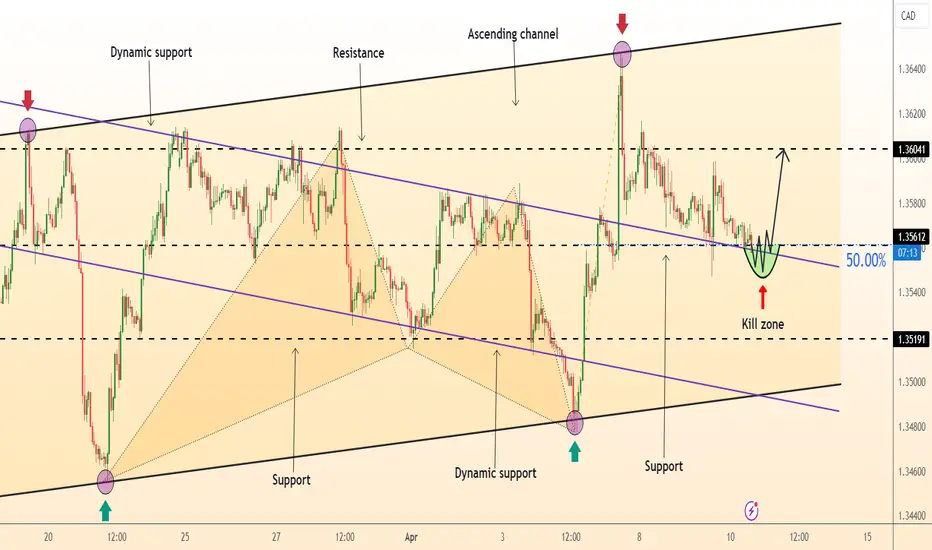
DeGRAM | USDCAD rebound from the retracement levelUSDCAD is moving in an ascending channel.
The volatility of price movement has decreased.
The chart has reached the 50% retracement level of the last upward impulse.
The price is above the level of dynamic support.
We expect a rebound after a retest of the current support.
-------------------
Share your opinion in the comments and support the idea with like. Thanks for your support!
USD CAD chartUSD/CAD is the forex ticker that represents the US Dollar-Canadian Dollar currency pair. The USD/CAD rate, as indicated on the live chart, shows traders how many Canadian Dollars are required to buy one US Dollar. Follow the USD/CAD chart for live prices and stay up to date with the latest USD/CAD news, forecasts and analysis. Our expert industry insights will give you the edge to conduct thorough fundamental and technical analysis to trade this popular currency pair. confirm signal

USDCAD SELL | Idea Trading AnalysisHello Traders, here is the full analysis.
I think we can soon see more fall from this range! GOOD LUCK! Great SELL opportunity USDCAD
I still did my best and this is the most likely count for me at the moment.
Support the idea with like and follow my profile TO SEE MORE.
Traders, if you liked this idea or if you have your own opinion about it, write in the comments. I will be glad 🤝
Patience is the If You Have Any Question, Feel Free To Ask 🤗
Just follow chart with idea and analysis and when you are ready come in THE GROVE | VIP GROUP, earn more and safe, wait for the signal at the right moment and make money with us💰

USDCAD next MovePair : USDCAD ( U.S Dollar / Canadian Dollar )
Description :
Bullish Channel as an Corrective Pattern in Long Time Frame
Break of Structure
RSI - Divergence
Completed " 12 " Impulsive Waves
Demand Zone
