USD/CHF H4 | Downward trajectory to extend deeper?USD/CHF is rising towards a pullback resistance and could potentially reverse off this level to drop lower.
Sell entry is at 0.7962 which is a pullback resistance that aligns with the 23.6% Fibonacci retracement.
Stop loss is at 0.8030 which is a level that sits above the 38.2% Fibonacci retracement and a swing-high resistance.
Take profit is at 0.7852 which is a support that aligns with the 78.6% Fibonacci projection.
High Risk Investment Warning
Trading Forex/CFDs on margin carries a high level of risk and may not be suitable for all investors. Leverage can work against you.
Stratos Markets Limited (tradu.com ):
CFDs are complex instruments and come with a high risk of losing money rapidly due to leverage. 63% of retail investor accounts lose money when trading CFDs with this provider. You should consider whether you understand how CFDs work and whether you can afford to take the high risk of losing your money.
Stratos Europe Ltd (tradu.com ):
CFDs are complex instruments and come with a high risk of losing money rapidly due to leverage. 63% of retail investor accounts lose money when trading CFDs with this provider. You should consider whether you understand how CFDs work and whether you can afford to take the high risk of losing your money.
Stratos Global LLC (tradu.com ):
Losses can exceed deposits.
Please be advised that the information presented on TradingView is provided to Tradu (‘Company’, ‘we’) by a third-party provider (‘TFA Global Pte Ltd’). Please be reminded that you are solely responsible for the trading decisions on your account. There is a very high degree of risk involved in trading. Any information and/or content is intended entirely for research, educational and informational purposes only and does not constitute investment or consultation advice or investment strategy. The information is not tailored to the investment needs of any specific person and therefore does not involve a consideration of any of the investment objectives, financial situation or needs of any viewer that may receive it. Kindly also note that past performance is not a reliable indicator of future results. Actual results may differ materially from those anticipated in forward-looking or past performance statements. We assume no liability as to the accuracy or completeness of any of the information and/or content provided herein and the Company cannot be held responsible for any omission, mistake nor for any loss or damage including without limitation to any loss of profit which may arise from reliance on any information supplied by TFA Global Pte Ltd.
The speaker(s) is neither an employee, agent nor representative of Tradu and is therefore acting independently. The opinions given are their own, constitute general market commentary, and do not constitute the opinion or advice of Tradu or any form of personal or investment advice. Tradu neither endorses nor guarantees offerings of third-party speakers, nor is Tradu responsible for the content, veracity or opinions of third-party speakers, presenters or participants.
Usdchf!

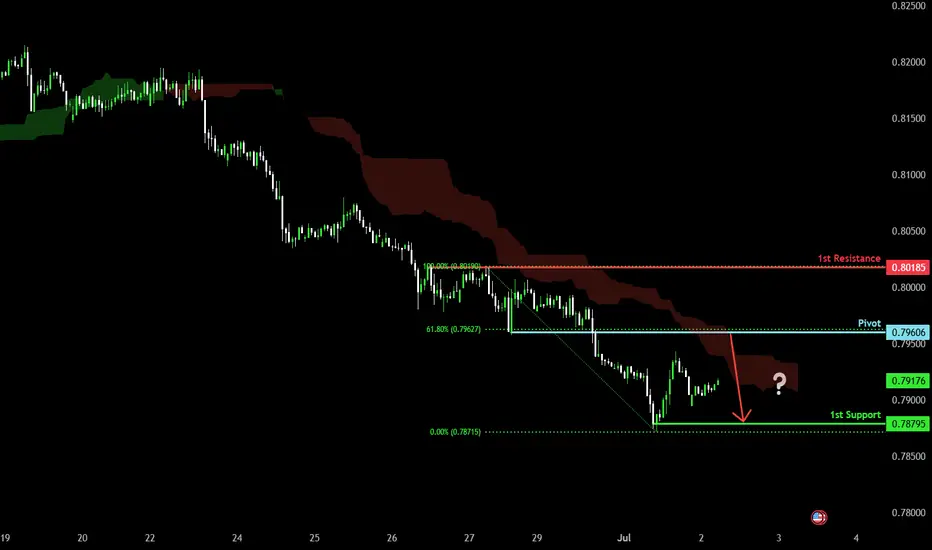
Bearish continuation?The Swissie (USD/CHF) is rising towards the pivot, which has been identified as a pullback resistance and could reverse to the 1st support.
Pivot: 0.7960
1st Support: 0.7879
1st Resistance: 0.8018
Risk Warning:
Trading Forex and CFDs carries a high level of risk to your capital and you should only trade with money you can afford to lose. Trading Forex and CFDs may not be suitable for all investors, so please ensure that you fully understand the risks involved and seek independent advice if necessary.
Disclaimer:
The above opinions given constitute general market commentary, and do not constitute the opinion or advice of IC Markets or any form of personal or investment advice.
Any opinions, news, research, analyses, prices, other information, or links to third-party sites contained on this website are provided on an "as-is" basis, are intended only to be informative, is not an advice nor a recommendation, nor research, or a record of our trading prices, or an offer of, or solicitation for a transaction in any financial instrument and thus should not be treated as such. The information provided does not involve any specific investment objectives, financial situation and needs of any specific person who may receive it. Please be aware, that past performance is not a reliable indicator of future performance and/or results. Past Performance or Forward-looking scenarios based upon the reasonable beliefs of the third-party provider are not a guarantee of future performance. Actual results may differ materially from those anticipated in forward-looking or past performance statements. IC Markets makes no representation or warranty and assumes no liability as to the accuracy or completeness of the information provided, nor any loss arising from any investment based on a recommendation, forecast or any information supplied by any third-party.
USD/CHF Exchange Rate Falls to Multi-Year LowUSD/CHF Exchange Rate Falls to Multi-Year Low
According to the chart, the USD/CHF exchange rate has settled below the key psychological level of 0.8000. The rate hasn’t been this low since the financial crisis of 2008.
On one hand, the drop in USD/CHF is driven by weakness in the US dollar. The US dollar index has fallen to its lowest level in over three years, largely due to the conflicting trade policies pursued by the Trump administration. On the other hand, geopolitical instability has increased the appeal of the Swiss franc as a so-called safe-haven asset.
Technical Analysis of the USD/CHF Chart
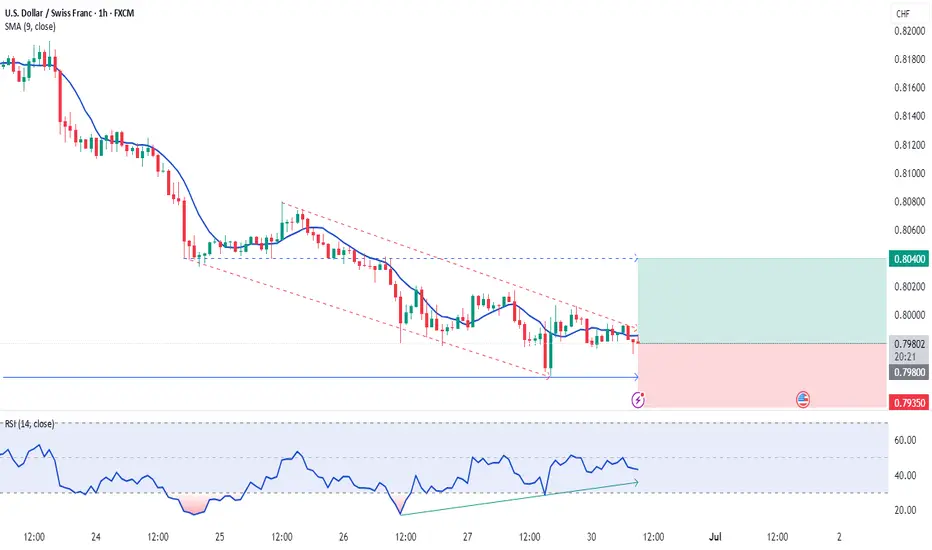
Since mid-May, price fluctuations have formed a downward channel (marked in red), and by the end of June the rate had stabilised around the psychological threshold of 0.8000 (indicated by an arrow) — right at the median of the channel.
However, this balance between supply and demand proved temporary, tipping in favour of sellers. As a result, we now see a decline in USD/CHF along a steep trajectory (marked in black), potentially targeting the lower boundary of the red channel — which suggests a possible move down to 0.7800 USD per franc. Along this path, support may come from the 1.618 Fibonacci extension level (0.7875); note how the 0.8055 level previously acted as support (marked with a blue arrow).
The RSI indicator confirms strong selling pressure — but will the bearish trend continue?
Much will depend on the broader fundamental context. As reported by the Wall Street Journal, the sharp strengthening of the franc against the dollar is causing growing concern at the Swiss National Bank (SNB), as an overly strong franc harms Swiss exporters. This suggests that the current market sentiment could shift dramatically if the SNB issues any relevant statements.
This article represents the opinion of the Companies operating under the FXOpen brand only. It is not to be construed as an offer, solicitation, or recommendation with respect to products and services provided by the Companies operating under the FXOpen brand, nor is it to be considered financial advice.

How to Trade USDCHF 's Downtrend with Precision📉 Market Breakdown: USDCHF Under Pressure
Currently keeping a close watch on USDCHF 💵🇨🇭 — the pair has been in a strong, sustained bearish trend 🔻, and the overall pressure remains clearly to the downside.
My bias is firmly bearish 📊, but I’m not rushing in. Instead, I’m patiently waiting for an optimal entry 🎯 — one that offers the right balance of confluence, structure, and reduced risk 🧠🛡️.
🎥 In today’s video, we dive into:
✅ Market structure
✅ Price action
✅ The prevailing trend
✅ Entry zones with minimized risk
I also walk you through my personal entry strategy and trading plan 📋, it's not just an idea drop.
📌 Disclaimer: This is not financial advice — the content is for educational purposes only.

USDCHF H4 I Bullish Bounce Off Based on the H4 chart analysis, we can see that the price is currently at our buy entry at 0.7921 that aligns with the 127.2% Fib extension
Our take profit will be at 0.8054, a pullback support.
The stop loss will be placed at 0.7759, slightly below the 161.8% Fib extension.
High Risk Investment Warning
Trading Forex/CFDs on margin carries a high level of risk and may not be suitable for all investors. Leverage can work against you.
Stratos Markets Limited (tradu.com ):
CFDs are complex instruments and come with a high risk of losing money rapidly due to leverage. 63% of retail investor accounts lose money when trading CFDs with this provider. You should consider whether you understand how CFDs work and whether you can afford to take the high risk of losing your money.
Stratos Europe Ltd (tradu.com ):
CFDs are complex instruments and come with a high risk of losing money rapidly due to leverage. 63% of retail investor accounts lose money when trading CFDs with this provider. You should consider whether you understand how CFDs work and whether you can afford to take the high risk of losing your money.
Stratos Global LLC (tradu.com ):
Losses can exceed deposits.
Please be advised that the information presented on TradingView is provided to Tradu (‘Company’, ‘we’) by a third-party provider (‘TFA Global Pte Ltd’). Please be reminded that you are solely responsible for the trading decisions on your account. There is a very high degree of risk involved in trading. Any information and/or content is intended entirely for research, educational and informational purposes only and does not constitute investment or consultation advice or investment strategy. The information is not tailored to the investment needs of any specific person and therefore does not involve a consideration of any of the investment objectives, financial situation or needs of any viewer that may receive it. Kindly also note that past performance is not a reliable indicator of future results. Actual results may differ materially from those anticipated in forward-looking or past performance statements. We assume no liability as to the accuracy or completeness of any of the information and/or content provided herein and the Company cannot be held responsible for any omission, mistake nor for any loss or damage including without limitation to any loss of profit which may arise from reliance on any information supplied by TFA Global Pte Ltd.
The speaker(s) is neither an employee, agent nor representative of Tradu and is therefore acting independently. The opinions given are their own, constitute general market commentary, and do not constitute the opinion or advice of Tradu or any form of personal or investment advice. Tradu neither endorses nor guarantees offerings of third-party speakers, nor is Tradu responsible for the content, veracity or opinions of third-party speakers, presenters or participants.

USDCHF bearish trend continuation below 0.8050The USDCHF pair remains under bearish pressure, consistent with the prevailing downtrend. Recent price action has transitioned into a sideways consolidation, suggesting a pause in bearish momentum but not a reversal.
The key technical level to monitor is 0.8050, which marks a prior intraday consolidation zone and acts as immediate resistance. Should the pair stage an oversold bounce toward this level, a bearish rejection could reinforce the existing downtrend, with potential downside targets at 0.7900, followed by 0.7860 and 0.7810 over the longer term.
On the other hand, a confirmed breakout above 0.8050, supported by a daily close above this level, would invalidate the bearish outlook. Such a move would signal a possible shift in sentiment and open the door for a retest of the 0.8080 resistance zone, with further upside potential toward 0.8140.
Conclusion:
The broader trend remains bearish below 0.8050, and rallies into resistance may present renewed selling opportunities. However, a sustained break above 0.8050 would warrant a reassessment of the bearish bias and could signal the start of a short-term recovery phase. Traders should watch for price action confirmation at this key pivot area.
This communication is for informational purposes only and should not be viewed as any form of recommendation as to a particular course of action or as investment advice. It is not intended as an offer or solicitation for the purchase or sale of any financial instrument or as an official confirmation of any transaction. Opinions, estimates and assumptions expressed herein are made as of the date of this communication and are subject to change without notice. This communication has been prepared based upon information, including market prices, data and other information, believed to be reliable; however, Trade Nation does not warrant its completeness or accuracy. All market prices and market data contained in or attached to this communication are indicative and subject to change without notice.

USD/CHF SENDS CLEAR BEARISH SIGNALS|SHORT
USD/CHF SIGNAL
Trade Direction: short
Entry Level: 0.817
Target Level: 0.805
Stop Loss: 0.824
RISK PROFILE
Risk level: medium
Suggested risk: 1%
Timeframe: 5h
Disclosure: I am part of Trade Nation's Influencer program and receive a monthly fee for using their TradingView charts in my analysis.
✅LIKE AND COMMENT MY IDEAS✅

USDCHF..SHORT📌 USDCHF – Multi-Scenario Setup
This pair has two key levels: one short-term, the other long-term.
If price reaches the first level and shows solid bearish reaction, I’ll enter a short.
If that level breaks and confirms, I’ll go long—but manage the long aggressively, since I’ll look to exit around the higher level.
If the price pushes beyond even the second zone, I’ll be ready to buy again.
❗️I’m never upset by a loss or a broken level.
The market leads—I follow.
Claiming “it must drop from here” or “it has to rise” is wishful thinking, not trading.
✅ Stay calm, stay flexible, and stay prepared for every scenario.

Bullish reversal?USD/CHF is falling towards the support level which aligns with the 161.8% Fibonacci extension and the 78.4% Fibonacci projection and could bounce from this level to our take profit.
Entry: 0.7950
Why we like it:
There is a support level at the 161.8% Fibonacci extension and the 78.4% Fibonacci projection.
Stop loss: 0.7899
Why we like it:
There is a support level at the 100% Fibonacci projection.
Take profit: 0.8052
Why we like it:
Thee is a pullback resistance that lines up with the 38.2% Fibonacci retracement.
Enjoying your TradingView experience? Review us!
Please be advised that the information presented on TradingView is provided to Vantage (‘Vantage Global Limited’, ‘we’) by a third-party provider (‘Everest Fortune Group’). Please be reminded that you are solely responsible for the trading decisions on your account. There is a very high degree of risk involved in trading. Any information and/or content is intended entirely for research, educational and informational purposes only and does not constitute investment or consultation advice or investment strategy. The information is not tailored to the investment needs of any specific person and therefore does not involve a consideration of any of the investment objectives, financial situation or needs of any viewer that may receive it. Kindly also note that past performance is not a reliable indicator of future results. Actual results may differ materially from those anticipated in forward-looking or past performance statements. We assume no liability as to the accuracy or completeness of any of the information and/or content provided herein and the Company cannot be held responsible for any omission, mistake nor for any loss or damage including without limitation to any loss of profit which may arise from reliance on any information supplied by Everest Fortune Group.

USDCHF Analysis – "Dollar Trying to Break Free from Downtrend"USDCHF is breaking out from a multi-week descending channel.
Structure shows a potential trend reversal from the June 12th low.
First bullish leg may target the 23.6% Fib level at 0.8266, followed by an extended move toward 0.8355.
Key resistance: 0.8266 and 0.8355 (Fib levels)
Stop loss: around 0.8093–0.8056 zone (previous support and breakout base)
Structure Bias: Bullish breakout after prolonged downtrend – confirmation depends on sustained move above 0.8200
📊 Current Bias: Cautiously Bullish
🧩 Key Fundamentals Driving USDCHF
USD Side (Mildly Bearish to Neutral):
FOMC held rates, Dot Plot showed only one cut expected for 2025, but Powell’s tone was less hawkish.
US Retail Sales soft, and PPI/CPI showed signs of inflation cooling.
Recent risk-off sentiment (Middle East, oil spikes, equity volatility) supports the USD.
Trump commentary and 2025 election anticipation bring long-term uncertainty.
CHF Side (Strong but potentially weakening):
SNB held rates steady, with cautious tone—no urgency to hike again.
Safe-haven flows still support CHF, but waning inflation and stronger global equity market might reduce CHF appeal.
SNB has hinted at FX intervention readiness, which could weaken CHF if necessary.
⚠️ Risks That May Reverse or Accelerate Trend
False breakout risk if 0.82 fails to hold → deeper pullback toward 0.8090
Stronger CHF demand on geopolitical fear (Israel–Iran, Ukraine)
Unexpectedly weak US data this week or renewed Fed dovish talk
🗓️ Important News to Watch
US: Core PCE, GDP revision (June 27), jobless claims
CHF: Swiss CPI, SNB FX intervention chatter
Risk sentiment: Iran/Israel tensions, equity volatility, Trump Fed commentary
🏁 Which Asset Might Lead the Broader Move?
USDCHF could mirror sentiment across CHF pairs—if risk-on resumes and CHF weakens across the board (EURCHF, NZDCHF also rallying), USDCHF may accelerate higher.

Bullish reversal for the Swissie?The price is falling towards the pivot, which aligns with the Fibonacci confluence and could reverse to the 1st resistance, which is an overlap resistance.
Pivot: 0.7942
1st Support: 0.7771
1st Resistance: 0.8163
Risk Warning:
Trading Forex and CFDs carries a high level of risk to your capital and you should only trade with money you can afford to lose. Trading Forex and CFDs may not be suitable for all investors, so please ensure that you fully understand the risks involved and seek independent advice if necessary.
Disclaimer:
The above opinions given constitute general market commentary, and do not constitute the opinion or advice of IC Markets or any form of personal or investment advice.
Any opinions, news, research, analyses, prices, other information, or links to third-party sites contained on this website are provided on an "as-is" basis, are intended only to be informative, is not an advice nor a recommendation, nor research, or a record of our trading prices, or an offer of, or solicitation for a transaction in any financial instrument and thus should not be treated as such. The information provided does not involve any specific investment objectives, financial situation and needs of any specific person who may receive it. Please be aware, that past performance is not a reliable indicator of future performance and/or results. Past Performance or Forward-looking scenarios based upon the reasonable beliefs of the third-party provider are not a guarantee of future performance. Actual results may differ materially from those anticipated in forward-looking or past performance statements. IC Markets makes no representation or warranty and assumes no liability as to the accuracy or completeness of the information provided, nor any loss arising from any investment based on a recommendation, forecast or any information supplied by any third-party.

USD/CHF H4 | Swing-high resistance at a Fibonacci confluenceUSD/CHF is rising towards a swing-high resistance and could potentially reverse off this level to drop lower.
Sell entry is at 0.8012 which is a swing-high resistance that aligns with a confluence of Fibonacci levels i.e. the 23.6% and 50% retracements.
Stop loss is at 0.8050 which is a level that sits above a pullback resistance.
Take profit is at 0.7962 which is a swing-low support.
High Risk Investment Warning
Trading Forex/CFDs on margin carries a high level of risk and may not be suitable for all investors. Leverage can work against you.
Stratos Markets Limited (tradu.com ):
CFDs are complex instruments and come with a high risk of losing money rapidly due to leverage. 63% of retail investor accounts lose money when trading CFDs with this provider. You should consider whether you understand how CFDs work and whether you can afford to take the high risk of losing your money.
Stratos Europe Ltd (tradu.com ):
CFDs are complex instruments and come with a high risk of losing money rapidly due to leverage. 63% of retail investor accounts lose money when trading CFDs with this provider. You should consider whether you understand how CFDs work and whether you can afford to take the high risk of losing your money.
Stratos Global LLC (tradu.com ):
Losses can exceed deposits.
Please be advised that the information presented on TradingView is provided to Tradu (‘Company’, ‘we’) by a third-party provider (‘TFA Global Pte Ltd’). Please be reminded that you are solely responsible for the trading decisions on your account. There is a very high degree of risk involved in trading. Any information and/or content is intended entirely for research, educational and informational purposes only and does not constitute investment or consultation advice or investment strategy. The information is not tailored to the investment needs of any specific person and therefore does not involve a consideration of any of the investment objectives, financial situation or needs of any viewer that may receive it. Kindly also note that past performance is not a reliable indicator of future results. Actual results may differ materially from those anticipated in forward-looking or past performance statements. We assume no liability as to the accuracy or completeness of any of the information and/or content provided herein and the Company cannot be held responsible for any omission, mistake nor for any loss or damage including without limitation to any loss of profit which may arise from reliance on any information supplied by TFA Global Pte Ltd.
The speaker(s) is neither an employee, agent nor representative of Tradu and is therefore acting independently. The opinions given are their own, constitute general market commentary, and do not constitute the opinion or advice of Tradu or any form of personal or investment advice. Tradu neither endorses nor guarantees offerings of third-party speakers, nor is Tradu responsible for the content, veracity or opinions of third-party speakers, presenters or participants.

"USD/CHF Breakout - Real Deal or Trap?"🏦 SWISS BANK HEIST: USD/CHF BULLISH LOOT GRAB 🚨
(Professional Money Snatching Strategy)
🦹♂️ Attention All Market Bandits!
(Hola! Oi! Salut! Hallo! Ahlan!) 🎭💰
🔥 Thief Trading Intel Confirmed!
The USD/CHF "Swissy" vault is ready for cracking! Our bullish robbery plan targets 0.84500 - but we must escape before the bears (police) set their trap!
🔓 ENTRY: CRACKING THE SAFE
"0.82800 MA is the vault door!"
✔ Option 1: Buy Stop above MA (breakout play)
✔ Option 2: Buy Limit at swing low (15m/30m pullback)
🔔 Pro Tip: Set alerts - real thieves never miss their heist!
🚨 STOP LOSS: POLICE EVASION PLAN
📍 Thief SL: 0.81900 (below 3H swing low)
⚠️ Warning: No SL before breakout! You'll trigger the alarms!
💎 TARGET: ESCAPE WITH THE LOOT
🎯 Primary Take: 0.84500
💰 Scalpers: Long-only! Trail SL like a getaway car!
📊 MARKET CONDITIONS
⚖️ Neutral Trend (but bullish potential brewing!)
🔍 Key Intel Needed: COT reports, macro data, CHF safe-haven flows
🌐 Full Briefing: Bi0 linkss 👉🔗 (don't go in blind!)
🚦 RISK MANAGEMENT PROTOCOLS
• ❌ Avoid trading during news events
• 🔒 Always use trailing stops
• 💣 Position size = your explosive potential
🦾 SUPPORT THE SYNDICATE
💥 SMASH THAT BOOST BUTTON!
💬 Comment your heist results below!
🔔 Next robbery coming soon - stay tuned!
🤑 Remember thieves: Book profits before the Swiss police arrive!

Swissy Heist: USD/CHF Bearish Breakout Blueprint🚨 Swissy Heist Alert: USD/CHF Bearish Breakout Plan for Swing/Day Traders 🌐💸
Hello, Wealth Chasers and Market Mavericks! 👋😎
Welcome to the Thief Trading Strategy, a cunning blend of technical precision and fundamental insight to conquer the USD/CHF Forex market. This is your blueprint to pull off a masterful heist on "The Swissy." Follow the plan, target the high-reward Green Zone, and navigate the traps where bullish players lurk. Let’s grab those pips and treat ourselves to the spoils! 💰🎯
📈 Trade Blueprint: USD/CHF Setup
Market: USD/CHF (Forex) 🌍
Bias: Bearish Breakout 📉
Timeframe: 4H (Swing/Day Trade) ⏰
Entry Plan 📊:
Breakout Strategy: Wait for a confirmed break below the Neutral Zone at 0.81800. Set Sell Stop orders just below 0.81800 to surf the bearish momentum. 🚀
Pullback Strategy: For safer entries, place Sell Limit orders at the nearest 15M/30M swing high (e.g., 0.82100–0.82300) after a support break. 📍
Pro Tip: Activate a price alert at 0.81800 to catch the breakout live! 🔔
Stop Loss 🛑:
📍 Set your Stop Loss above the nearest 4H swing high (e.g., 0.82750) for swing/day trades.
📍 Adjust SL based on your risk tolerance, lot size, and number of open positions.
Target 🎯: Aim for 0.80700 or exit early to secure profits.
💡 Why the Bearish Bias?
The USD/CHF is showing strong bearish momentum, fueled by technical patterns and fundamental drivers. Key factors include:
Technicals: Recent support at 0.81931–0.82120 held briefly but failed to sustain bullish momentum, reinforcing a bearish tilt below key moving averages (100/200-hour MAs).
Fundamentals: Safe-haven demand for the Swiss Franc persists amid global uncertainties, with bearish patterns like an inverse cup and handle signaling further downside. For a deeper dive, check fundamental reports, COT data, sentiment analysis, and intermarket trends via Linkks🔗
⚠️ Volatility Warning: News Impact 📰
News releases can spike volatility and disrupt price action. To protect your trades:
Avoid opening new positions during major news events.
Use trailing stops to lock in gains and shield running positions.
💪 Join the Heist!
Support this Thief Trading Strategy by smashing the Boost Button! 🚀 Let’s strengthen our crew and make pips effortlessly. With this plan, you’re equipped to navigate the USD/CHF market like a pro. Stay sharp, and I’ll be back with the next heist plan soon! 🐱👤💸
Happy trading, and let’s steal those profits! 😎🎉

USD-CHF Will Fall! Sell!
Hello,Traders!
USD-CHF keeps falling down
And the pair broke the key
Horizontal level of 0.8090
Decisively so we are bearish
Biased and we will be expecting
A further move down next week
Sell!
Comment and subscribe to help us grow!
Check out other forecasts below too!
Disclosure: I am part of Trade Nation's Influencer program and receive a monthly fee for using their TradingView charts in my analysis.

USDCHF | 26.06.2025BUY 0.80000 | STOP 0.79600 | TAKE 0.80600 | We observe the beginning of the rollback of the franc dominance in this pair. Technically, RSI divergence has formed around the global price low. We expect a corrective upward price movement.

USD_CHF BEARISH BREAKOUT|SHORT|
✅USD_CHF broke the key structure level of 0.8050
While trading in a strong downtrend
Which makes me bearish
And I think that after the retest of the broken level is complete
A bearish continuation will follow
SHORT🔥
✅Like and subscribe to never miss a new idea!✅
Disclosure: I am part of Trade Nation's Influencer program and receive a monthly fee for using their TradingView charts in my analysis.

USD/CHF SENDS CLEAR BULLISH SIGNALS|LONG
Hello, Friends!
The BB lower band is nearby so USD-CHF is in the oversold territory. Thus, despite the downtrend on the 1W timeframe I think that we will see a bullish reaction from the support line below and a move up towards the target at around 0.801.
Disclosure: I am part of Trade Nation's Influencer program and receive a monthly fee for using their TradingView charts in my analysis.
LIKE AND COMMENT MY IDEAS

USD/CHF H1 | Pullback resistance at 61.8% Fibonacci retracementUSD/CHF is rising towards a pullback resistance and could potentially reverse off this level to drop lower.
Sell entry is at 0.8041 which is a pullback resistance that aligns with the 61.8% Fibonacci retracement.
Stop loss is at 0.8090 which is a level that sits above a swing-high resistance.
Take profit is at 0.7979 which is a multi-swing-low support.
High Risk Investment Warning
Trading Forex/CFDs on margin carries a high level of risk and may not be suitable for all investors. Leverage can work against you.
Stratos Markets Limited (tradu.com ):
CFDs are complex instruments and come with a high risk of losing money rapidly due to leverage. 63% of retail investor accounts lose money when trading CFDs with this provider. You should consider whether you understand how CFDs work and whether you can afford to take the high risk of losing your money.
Stratos Europe Ltd (tradu.com ):
CFDs are complex instruments and come with a high risk of losing money rapidly due to leverage. 63% of retail investor accounts lose money when trading CFDs with this provider. You should consider whether you understand how CFDs work and whether you can afford to take the high risk of losing your money.
Stratos Global LLC (tradu.com ):
Losses can exceed deposits.
Please be advised that the information presented on TradingView is provided to Tradu (‘Company’, ‘we’) by a third-party provider (‘TFA Global Pte Ltd’). Please be reminded that you are solely responsible for the trading decisions on your account. There is a very high degree of risk involved in trading. Any information and/or content is intended entirely for research, educational and informational purposes only and does not constitute investment or consultation advice or investment strategy. The information is not tailored to the investment needs of any specific person and therefore does not involve a consideration of any of the investment objectives, financial situation or needs of any viewer that may receive it. Kindly also note that past performance is not a reliable indicator of future results. Actual results may differ materially from those anticipated in forward-looking or past performance statements. We assume no liability as to the accuracy or completeness of any of the information and/or content provided herein and the Company cannot be held responsible for any omission, mistake nor for any loss or damage including without limitation to any loss of profit which may arise from reliance on any information supplied by TFA Global Pte Ltd.
The speaker(s) is neither an employee, agent nor representative of Tradu and is therefore acting independently. The opinions given are their own, constitute general market commentary, and do not constitute the opinion or advice of Tradu or any form of personal or investment advice. Tradu neither endorses nor guarantees offerings of third-party speakers, nor is Tradu responsible for the content, veracity or opinions of third-party speakers, presenters or participants.

Bearish continuation?The Swissie (USD/CHF) has rejected off the pivot which has been identified as a pullback resistance and could drop to the 1st support.
Pivot: 0.8070
1st Support: 0.7962
1st Resistance: 0.8104
Risk Warning:
Trading Forex and CFDs carries a high level of risk to your capital and you should only trade with money you can afford to lose. Trading Forex and CFDs may not be suitable for all investors, so please ensure that you fully understand the risks involved and seek independent advice if necessary.
Disclaimer:
The above opinions given constitute general market commentary, and do not constitute the opinion or advice of IC Markets or any form of personal or investment advice.
Any opinions, news, research, analyses, prices, other information, or links to third-party sites contained on this website are provided on an "as-is" basis, are intended only to be informative, is not an advice nor a recommendation, nor research, or a record of our trading prices, or an offer of, or solicitation for a transaction in any financial instrument and thus should not be treated as such. The information provided does not involve any specific investment objectives, financial situation and needs of any specific person who may receive it. Please be aware, that past performance is not a reliable indicator of future performance and/or results. Past Performance or Forward-looking scenarios based upon the reasonable beliefs of the third-party provider are not a guarantee of future performance. Actual results may differ materially from those anticipated in forward-looking or past performance statements. IC Markets makes no representation or warranty and assumes no liability as to the accuracy or completeness of the information provided, nor any loss arising from any investment based on a recommendation, forecast or any information supplied by any third-party.

USDCHF LONG FORECAST Q2 W26 D26 Y25USDCHF LONG FORECAST Q2 W26 D26 Y25
Professional Risk Managers👋
HTF BOS REQUIRED
Welcome back to another FRGNT chart update📈
Diving into some Forex setups using predominantly higher time frame order blocks alongside confirmation breaks of structure.
Let’s see what price action is telling us today!
💡Here are some trade confluences📝
✅Daily order block
✅Weekly order block
✅Intraday breaks of structure Required
✅4H Order block
🔑 Remember, to participate in trading comes always with a degree of risk, therefore as professional risk managers it remains vital that we stick to our risk management plan as well as our trading strategies.
📈The rest, we leave to the balance of probabilities.
💡Fail to plan. Plan to fail.
🏆It has always been that simple.
❤️Good luck with your trading journey, I shall see you at the very top.
🎯Trade consistent, FRGNT X

USD/CHF At Perfect Place For Buy , 250 Pips Easy To Get !Here is my opinion on USD/CHF , The price at support area that forced the price to go up last time more than 500 pips , so it`s a very strong Area to buy it again from the same support cuz it`s the lowest place the price can go up from it , and we can targeting 250 pips .
