7:1 Risk to Reward sell Setup for USDCHFCore Analysis Method: Smart Money Concepts
Based on the Smart Money Concepts methodology, the following analysis has been conducted:
😇 7 Dimension Analysis
Time Frame: H1
Swing Structure:
The current swing structure is totally bearish with a proper inducement.
The corrective swing move has already reached its mid-Point of Interest (POI) with four pullbacks. Now, the internal structure has turned bearish, indicating the start of another impulsive move.
The mid of the move contains OB (Order Block), SOB (Significant Order Block), and FVG (Fair Value Gap), which are important areas for sellers. This zone also acts as a Change in Polarization (CIP), making it crucial for a potential downward move.
Pattern:
🟢 Chart Patterns:
A Head and Shoulders reversal pattern has formed, with the neckline broken, indicating a strong bearish sentiment.
🟢 Candle Patterns:
Follow-up momentum candles have appeared as engulfing patterns at the neckline breakout, confirming the bearish trend.
Volume:
🟢 A significant increase in volume was observed at the breakout point, signaling that bears are taking control at this level. This strong volume supports the bearish continuation.
Momentum RSI:
🟢 The price has entered a super bearish zone with a perfect range shift.
There is a bearish divergence at the top, and the price has taken a strong rejection from the highest point with a loud move. This makes the pair more attractive for sellers, as the momentum favors a downward continuation.
Volatility Bollinger Bands:
🟢 The contraction phase has led to a squeeze breakout, with one candle already closing outside the lower band. The "walking on the band" phase is about to start at the lower band, indicating sustained bearish volatility.
Strength ADX:
Bears are stronger than bulls in every dimension, according to the ADX.
Rating: ⭐⭐⭐⭐⭐
All parameters are in favor of sellers, giving this setup a strong 5-star rating, indicating high confidence in the bearish continuation.
✔️ Entry Time Frame: H1
✅ Entry TF Structure: Bearish
☑️ POI: Mid-point mitigated
💡 Decision: Sell
🚀 Entry: 0.8668
✋ Stop loss: 0.8717
🎯 Take profit: 0.8310
😊 Risk to reward Ratio: 7RR
🕛 Expected Duration: 10 days
SUMMARY:
The analysis suggests a strong bearish setup with an entry at 0.8668, a stop loss at 0.8717, and a take profit target at 0.8310. The risk-to-reward ratio is 7:1, and the expected duration for the trade is around 10 days. All dimensions—volume, momentum, volatility, and strength—are aligned in favor of the bears, making this a high-confidence trade. Close monitoring is advised to ensure the trade remains within the expected parameter
Usdchfanalysis

USDCHF BUY TF H4 TP = 0.8959On the H4 chart the trend started on Aug. 06 (linear regression channel).
There is a high probability of profit taking. Possible take profit level is 0.8959
Using a trailing stop is also a good idea!
Please leave your feedback, your opinion. I am very interested in it. Thank you!
Good luck!
Regards, WeBelievelnTrading

USDCHF Loong!This price has been forming a falling flag for the past few weeks, which IMO is always a strong sentiment for a bullish market. After completing the pattern and liquidity grab, I do anticipate that the price might retest the upper trend line of the pattern.
Entry point at 0.868, SL at 0.855 and TP at 0.894
Remember, only risk 1-2% of your account.

USDCHF Technical Analysis and Trade Idea 👉 🔍 In this video, we take a closer look at the USD/CHF pair, which has recently displayed bearish momentum. It has retraced significantly and is now facing a key resistance level. Based on this, I anticipate further downside potential.
However, it's important to remember that these insights are speculative and not a definitive forecast. It's essential to confirm specific price movements before making any trading decisions, as discussed in the video. The video offers an in-depth analysis of the current trend, market structure, and price dynamics. Keep in mind that this educational content aims to enhance understanding and does not guarantee results. Trading involves substantial risks, so employing sound risk management strategies is crucial. 📈🔔

USD/CHCF Possible BUYEven though this pair is inn a strong downtrend... Do we or Did we see strong reversal with tremendous upside from HTF?? I'm waiting for one more confirmation then riding to 95 north!
WHAT ARE YOUR THOUGHTS ARE YOU STAYING SOUTH OR GOING NORTH??

USDCHF SHORT OPPORTUNITYHey everyone so im looking for a short pullback to 0.85100 as a target we had a nice 15 min shift from the h1 order block we are still trending down , plus we have 2 candle close in high resistance from the 0.85600 level , confirming the rejection of this level ( FOR NOW). We all know that equal highs are like magnet.

USDCHF Short Term Sell IdeaH4 - Strong bearish momentum
Lower lows
Until the strong resistance zone holds I expect the price to move lower further after pullbacks.

USDCHF ShortThis currency has been forming a falling flag and I do anticipate that the bearish momentum will continue so as to complete the pattern.
Entry Position at 0.880, TP AT 0.869 and SL at 0.885

USDCHF Short term bullsUSDCHF May run to 0.92100 early next week, as the week's high. I anticipate a reversal once it reaches that level ahead of US PMI and US GDP. Given that the GDP is expected to decline, any less than forecast figure may push it 0.88700 then later to 0.88100.

USDCHF | Long Term | Buy OpportunityDay : Bearish Trend > marked Day Supply Zone
15m: Likely to grab entire sell-side liquidity soon and shift to a bullish trend, continuing until the daytime frame supply zone mitigation.
Take a long position after strong bullish confirmation in both 15m and 1m charts.

USDCHF | Buying Opportunity15m: London session is expected to sweep most of the sell-side liquidity. Wait for the maximum sell-side liquidity sweep, and if there is any bullish confirmation, take a long position followed by a 1m bullish confirmation.

USDCHF short Opportunity 2nd Position with AUDNZD based purely on technical analysis and market sentiment

DeGRAM | USDCHF a bounce in the descending channelUSDCHF is moving in a descending channel between the trend lines.
The chart touched the lower boundary of the channel.
The price has reached the resistance level coinciding with the retracement level.
We expect the rebound to continue after consolidation above the current level.
-------------------
Share your opinion in the comments and support the idea with like. Thanks for your support!

USDCHF LooongBased on the previous analysis, there were two possibilities about this currency, either it continues to complete the falling flag pattern, or retest the upper trendline of the channel.
It broke out of a major market zone, i.e 0.886 and retested it. I do anticipate that this price will continue with the bullish momentum.
Entry point at 0.889, SL at 0.8815 and TP at 0.9045

USDCHFPair : USDCHF ( U.S Dollar / Swiss Franc )
Description :
Completed " 12345 " Impulsive Waves and " ABC " Corrective Waves
Break of Structure
RSI - Divergence
Bearish Channel as an Corrective Pattern in Short Time Frame
Fibonacci Level - 50.00%

USDCHF Pattern FormationThis price has been forming a falling flag for the past few weeks which IMO it is a strong indicator of a long bullish momentum.
As for the now, the price seems to be at major market zone, at 0.883 - 0.885, hence we are waiting for;
1. If the price breaks out and closes above 0.886, the bullish momentum might continue.
2. If the price fails to break out of that zone, it will continue with the bearish momentum and completing the pattern where the target is 0.857

USDCHF - Short from trendline !!Hello traders!
‼️ This is my perspective on USDCHF.
Technical analysis: Here we are in a bearish market structure from 4H timeframe perspective, so I look for a short. I wait price to continue the retracement to fill the imbalance higher and then to reject from trendline + liquidity zone + institutional big figure 0.89000.
Fundamental news: Next week is full of news for USD, on Wednesday (GMT+3) we have Interest Rate and FOMC and on Friday (GMT+3) we have NFP and Unemployment. News with high impact on currency.
Like, comment and subscribe to be in touch with my content!

USDCHF Weekly Analysis and OutlookUSDCHF Weekly Analysis and Outlook
This week, the USDCHF pair has shown a strong downward trajectory, closing in a bearish continuation phase. This downward momentum indicates a negative sentiment among traders, suggesting further potential for decline.
Current Market Overview:
The pair has been steadily moving downwards, supported by unfavorable market conditions and bearish sentiment. As it approaches a key resistance zone, traders should closely monitor the price action. A successful rejection at this resistance would likely confirm the continuation of the bearish trend.
Expectations and Potential Scenarios:
Upon retesting the resistance zone, we anticipate that the USDCHF will continue its downward momentum. This rejection could open the door to lower levels, offering traders potential opportunities to capitalize on the bearish trend.
Primary Expectation: If the resistance holds, the price is likely to sustain its downward movement, potentially targeting lower support levels. This scenario would reinforce the bearish outlook, making it a favorable environment for short positions.
Alternative Scenario: However, if the price breaks through the resistance, a temporary pullback could occur. Traders should be prepared for this scenario, as it might provide opportunities to reassess entry points at higher levels before resuming the downward trend.
Conclusion:
In summary, the USDCHF pair is poised for further downward movement following its recent bearish phase. Traders should watch for a decisive rejection at the resistance zone, which could serve as a catalyst for continued declines. Maintaining awareness of both bearish and corrective scenarios will be crucial for effective trading strategies. Stay updated with market developments and adjust your positions accordingly.
By Piptera Digital Solutions,
Invest Wisely!


USDCHFPair : USDCHF ( U.S Dollar / Swiss Franc )
Description :
Completed " 12345 " Impulsive Waves
Break of Structure
RSI - Divergence
Bullish Channel as an Corrective Pattern in Short Time Frame
CHoCH
Demand Zone

USD/CHF Simple Trading PlansUSD weakness stemming from a more dovish fed has taken us straight back to previous long-side 'demand' areas.
Storming back into these areas on strong sentiment does not normally warrant large sized longs.
Hold off, or make it small. Lower areas preferred.
Re-shorts only higher as drawn.

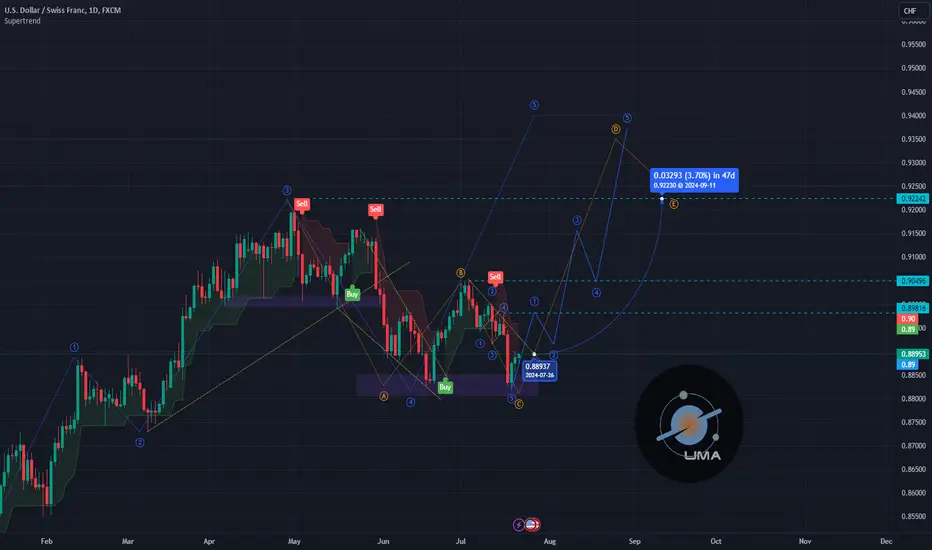
USDCHF - UniverseMetta - Analysis#USDCHF - UniverseMetta - Analysis
Continuation of the trend - a potential 5th wave; an ABC structure may form and allow the price to continue its momentum towards the level of 0.92250. In order not to increase risks, it is better to consider exiting when the support level consolidates or breaks through. Local targets 0.89505. Next, a correction may form, and volumes can be increased for further upward movement.
Target 0.89505 - 0.92800
DeGRAM | USDCHF rebound from supportUSDCHF is moving in a descending channel between the trend lines.
The chart bounced off the support and approached the resistance level.
We expect the growth to continue after overcoming the current level.
-------------------
Share your opinion in the comments and support the idea with like. Thanks for your support!
