USDCHF Technicals & Fundamentals🔹 Structure:
Pivot zone marked around 0.8200 (purple line + yellow zone).
Support below at ~0.8160.
Resistance around 0.8240.
Currently trading at 0.82137, trying to reclaim the pivot zone.
🔹 Price Action Outlook:
Bearish Bias: Based on the projected path, the expectation is for USD/CHF to:
Reject near 0.823–0.824.
Retest the pivot zone and fail to hold.
Begin a slow grind down back to the 0.8160 support, and potentially break it toward 0.8080.
🔹 Volume:
Volume appears mixed but increasing slightly — indicating growing interest at this level, possibly setting up for a breakout (or breakdown).
🌍 Fundamentals
🔸 USD Side:
Recent U.S. CPI & Fed rhetoric suggest inflation is sticky.
Rate cut expectations are being delayed, which supports the dollar in general.
However, geopolitical tensions and slowing data may keep the USD volatile.
🔸 CHF Side:
Swiss Franc remains a safe-haven currency.
SNB (Swiss National Bank) has adopted a relatively dovish stance but supports stability.
If global risk sentiment worsens, CHF may strengthen despite policy stance.
🔸 Combined View:
Risk-off sentiment = CHF strength
Strong USD = resistance holding
This combo fits with the technical expectation of a fade from resistance and downtrend continuation.
NOTE:
If USD/CHF fails to stay above the pivot (0.8200), we could see a slow bearish fade back toward 0.8080, as fundamentals hint at CHF strength returning amid global uncertainties.
Usdchfanalysis

USD/CHF At Interesting Area To Buy To Get 250 Pips m Agree ?Here is my analysis on USD/CHF , The price finally find a support to can go up from it , we have D Confirmation and also 4H Confirmations , so i think we can enter a buy trade when the price go back to retest the support and new 1h Up Trendline , and we will targeting 200 Pips .
This Is An Educational + Analytic Content That Will Teach Why And How To Enter A Trade
Make Sure You Watch The Price Action Closely In Each Analysis As This Is A Very Important Part Of Our Method
Disclaimer : This Analysis Can Change At Anytime Without Notice And It Is Only For The Purpose Of Assisting Traders To Make Independent Investments Decisions.
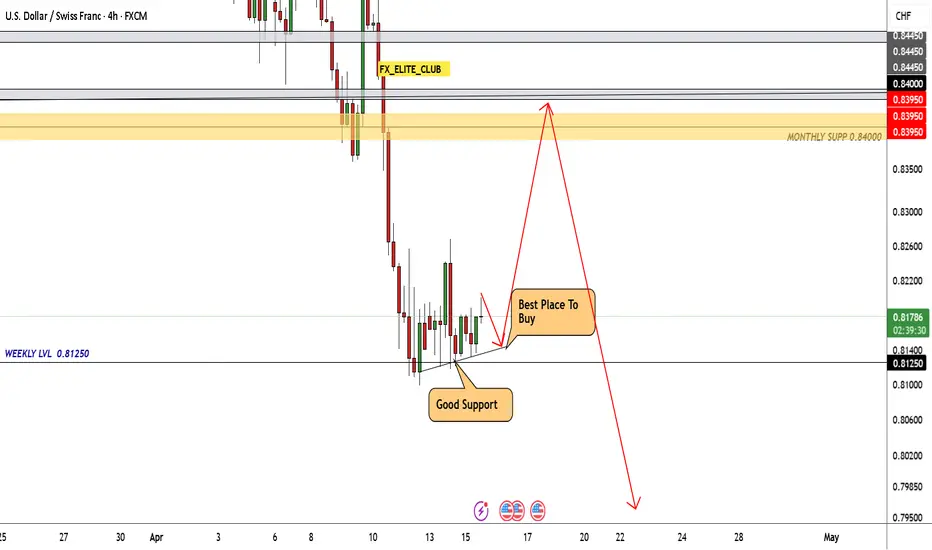
"USD/CHF Bearish Reversal Setup – SBR + DBD Zone in Play"🔵 Entry Zone: 0.81698
📍 Located in a SBR + DBD zone
🛑 Acts as resistance where price previously dropped
🔴 Stop Loss: 0.82617
🚫 Above the supply zone for safety
🛡️ Protects against fake breakouts
🟢 Target: 0.78500
🎯 Based on previous support/demand
🧲 High reward potential
Risk/Reward
📉 Risk (SL to Entry): ~91.9 pips
📈 Reward (Entry to Target): ~319.8 pips
⚖️ R:R Ratio: ~3.48 : 1
✅ High potential trade
Indicators
🟡 EMA (7) shows downward trend
📉 Price is moving below EMA – bearish pressure
Trade Plan
🕵️♂️ Wait for price to retest the zone
📉 Look for bearish confirmation (e.g., bearish engulfing)
🔽 Enter short
✅ Secure profits at target or trail stop if price moves in favor

USDCHF Imbalance Zone Possible Set Up for Bearish ContinuationBased on the current analysis of USDCHF, there's a compelling bearish setup forming on the 4-hour timeframe. Let's dive into the details! 🔍
Fundamental Analysis 💹
USDCHF is currently under significant bearish pressure at 0.8655 📉. The Swiss Franc has been strengthening against the USD, likely due to its safe-haven status amid current market uncertainties. This fundamental backdrop supports our technical bearish bias! 🇨🇭
Technical Analysis on 4H Chart 📈
The price is trading below both the 20 EMA (0.8677) and 50 EMA (0.8715) 📊, confirming the bearish momentum. This bearish EMA alignment creates a perfect environment for short entries! ⚡
Imbalance Zone Opportunity 🎯
There's a clear imbalance zone between 0.8664 - 0.8674 that hasn't been properly retested yet. This zone represents an area where price moved quickly, leaving behind unfilled orders. If price retraces into this zone, it could act as a magnet for sellers! 💰
The Perfect Setup 🔄
Wait for price to retrace into the imbalance zone (0.8664 - 0.8674) ⬆️
Look for bearish price action confirmation (engulfing candles, rejection wicks) 🕯️
Confirm a bearish structure break after the retracement 📉
Enter short position with stops above the recent swing high (~0.8680) 🚫
Target the equilibrium level (0.8661) as first take-profit 🎯
Extended targets at previous lows or 1:2 risk-reward ratio 💸
Risk Management ⚠️
Keep your stop loss tight above the imbalance zone
Consider scaling out at key support levels
Total risk should not exceed 1-2% of your trading capital 💵
This setup offers an excellent risk-to-reward opportunity if executed properly! The bearish momentum is strong, with both EMAs confirming the downtrend. The imbalance zone provides a high-probability entry point for shorts! 🔥

UsdChf Sell bias Price cleared Fridays High 0.82565 with a nice rejection. My initial point of interest was the H4 open and close level.
Hence the target is the previous day low 0.80983
But scaling down lower timeframe like 20m shows engulfing with inducement that's a confirmation for short. Ride with me
Kindly boost if you find this insightful 🫴

USDCHF - BUYING OPPORTUNITYTeam, i do not trade very often on USDCHF
but i do watching when the price is right for enter
I am long position now.
Please review the chart carefully

USDCHF Daily Outlook – Smart Sell Opportunity AheadAfter a clean break and retest of the ascending trendline, USDCHF shows signs of weakness below the key supply zone — perfectly aligned with the 38.2–50% Fibonacci retracement.
🔻 My Bias: Bearish
I'm watching for a short-term pullback into the red zone (possible liquidity grab), followed by a strong continuation toward the next demand area.
💡 Why this setup matters: ✔️ Trendline break & retest
✔️ Strong bearish momentum
✔️ Fibonacci confluence
✔️ Supply zone reaction
🧠 Patience = Profits. Entry should be planned with precision.

USDCHF's 4H Bullish Structure Break – Is It Time to Buy?After a bearish phase, the USDCHF has turned its momentum around following Trump's announcement of a 90-day tariff pause. This news injected fresh optimism into the markets, triggering a rally that overturned previous downtrends. On the four-hour chart, we observe a break of structure that hints at a bullish reversal. The ideal entry point appears to be the pullback to the 50% Fibonacci retracement level—a historically reliable support zone—setting up a clean long opportunity. Current market sentiment, bolstered by easing geopolitical tensions and renewed risk appetite, supports this bullish outlook. As always, use appropriate risk management strategies and treat this analysis as a trade idea rather than financial advice. 🚀📈💹

USDCHF will be in the Bullish directionHello Traders
In This Chart USDCHF HOURLY Forex Forecast By FOREX PLANET
today USDCHF analysis 👆
🟢This Chart includes_ (USDCHF market update)
🟢What is The Next Opportunity on USDCHF Market
🟢how to Enter to the Valid Entry With Assurance Profit
This CHART is For Trader's that Want to Improve Their Technical Analysis Skills and Their Trading By Understanding How To Analyze The Market Using Multiple Timeframes and Understanding The Bigger Picture on the Chart

USD/CHF Bearish Trade Setup – Supply Zone Rejection🔹 CHoCH (Change of Character) – 📉 A key shift in market structure indicating bearish momentum.
🔹 SBR + DBD Zone (Support Becomes Resistance & Drop Base Drop) – 🚧 This blue zone is a strong resistance area where sellers are likely to step in.
🔹 Stop Loss (🚨) – Positioned above 0.84742, marking a risk level if price moves against the trade.
🔹 Entry Zone (🔵) – Inside the resistance zone, where price is expected to reject and continue downward.
🔹 Target Zone (🎯) – 0.82553, indicating a potential profit of around 2.01% downward movement (-169.7 pips).
🔹 Bearish Confirmation (🔻) – Price already reacted to the zone, showing rejection.
This chart suggests a short-selling opportunity, expecting the price to drop further after rejecting resistance. 📊🔥

USDCHF LONG FORECAST Q2 W15 D9 Y25 USDCHF LONG FORECAST Q2 W15 D9 Y25
Welcome Traders, Here's my take!

USD/CHF Short Trade Setup: Resistance Rejection Analysis🔵 Resistance Area (Blue Box)
🟥 Stop Loss: 0.86283 🔴 (Red dot at the top)
🔹 Entry Point: 0.85993 🔵 (Blue dot in the middle)
🟢 Target Point: 0.84518 ✅ (Green dot at the bottom)
📉 Trade Plan:
📌 Short Entry at 0.85993 (Expecting rejection from resistance)
🚨 Stop Loss at 0.86283 (Above resistance to protect against breakout)
🎯 Target at 0.84518 (Potential downside move)
📊 Market Structure:
📉 Prior Downtrend: Strong bearish move before consolidation
🔄 Sideways Price Action: Price struggling in resistance
⚡ Possible Breakdown: Expecting a fall if price holds below resistance

Market Analysis: USD/CHF DivesMarket Analysis: USD/CHF Dives
USD/CHF declined and is now struggling below the 0.8615 resistance.
Important Takeaways for USD/CHF Analysis Today
- USD/CHF declined below the 0.8675 and 0.8615 support levels.
- There is a short-term bearish trend line forming with resistance near 0.8550 on the hourly chart at FXOpen.
USD/CHF Technical Analysis
On the hourly chart of USD/CHF at FXOpen, the pair started a fresh decline from well above the 0.8800 zone. The US Dollar dropped below the 0.8675 support to move into a negative zone against the Swiss Franc.
The bears pushed the pair below the 50-hour simple moving average and 0.8615. Finally, the bulls appeared near the 0.8420 level. A low was formed near 0.8421 and the pair is now consolidating losses.
On the upside, the pair could face resistance near the 0.8480 level. It is near the 23.6% Fib retracement level of the downward move from the 0.8674 swing high to the 0.8421 low. The next major resistance is near the 0.8550 level.
There is also a short-term bearish trend line forming with resistance near 0.8550. It coincides with the 50% Fib retracement level of the downward move from the 0.8674 swing high to the 0.8421 low, above which the pair could test the 0.8615 level.
If there is a clear break above the 0.8615 resistance zone, the pair could start another increase. In the stated case, it could even surpass 0.8675.
On the downside, immediate support on the USD/CHF chart is 0.8420. The first major support is near the 0.8400 level. The next major support is near 0.8350. Any more losses may possibly open the doors for a move toward the 0.8220 level in the coming days.
This article represents the opinion of the Companies operating under the FXOpen brand only. It is not to be construed as an offer, solicitation, or recommendation with respect to products and services provided by the Companies operating under the FXOpen brand, nor is it to be considered financial advice.

USD/CHF Trade Analysis: Potential Reversal & Bullish Setup🔻 Downtrend Phase: The price has been falling sharply, showing a strong bearish move before hitting support. 📉🔥
🟦 Support Zone (0.84458):
🔵 Key level where buyers may step in. If price holds, it could trigger a reversal. 🚀🔄
🟦 Resistance Zone (Mid-Level):
🟡 A minor barrier before price can continue higher. Expect some reaction here. ⚠️📊
🎯 Target Point (0.86190):
✅ Bullish target where price is expected to move if the support holds. 🎯💰📈
⚠️ Stop Loss (0.84458):
❌ If price breaks below this level, the trade setup is invalidated. 🚨🔻
📊 Trade Setup Summary:
✔️ Buy from support (if confirmed)
✔️ Stop Loss below 0.84458 ❌
✔️ Take Profit at 0.86190 🎯💵
🔥 Risk-Reward looks good! Watch for confirmation before entering! 🚀📊

USD/CHF Swiss-dollar Forex Bank Heist Plan (Day/Scalping Trade)🌟Hi! Hola! Ola! Bonjour! Hallo! Marhaba!🌟
Dear Money Makers & Robbers, 🤑 💰💸✈️
Based on 🔥Thief Trading style technical and fundamental analysis🔥, here is our master plan to heist the USD/CHF "Swiss-dollar" Forex Bank . Please adhere to the strategy I've outlined in the chart, which emphasizes long entry. Our aim is the high-risk Red Zone. Risky level, overbought market, consolidation, trend reversal, trap at the level where traders and bearish robbers are stronger. 🏆💸"Take profit and treat yourself, traders. You deserve it!💪🏆🎉
Entry 📈 : "The vault is wide open! Swipe the Bullish loot at any price - the heist is on!
however I advise to Place buy limit orders within a 15 or 30 minute timeframe most recent or swing, low or high level.
Stop Loss 🛑:
Thief SL placed at the recent/swing low level Using the 1H timeframe (0.87900) Day / scalping trade basis.
SL is based on your risk of the trade, lot size and how many multiple orders you have to take.
🏴☠️Target 🎯: 0.89150 (or) Escape Before the Target
🧲Scalpers, take note 👀 : only scalp on the Long side. If you have a lot of money, you can go straight away; if not, you can join swing traders and carry out the robbery plan. Use trailing SL to safeguard your money 💰.
USD/CHF "Swiss-dollar" Forex Bank Heist Plan (Day/Scalping Trade) is currently experiencing a bullishness,., driven by several key factors.
📰🗞️Get & Read the Fundamental, Macro, COT Report, Quantitative Analysis, Sentimental Outlook, Intermarket Analysis, Future trend targets.. go ahead to check 👉👉👉🔗
⚠️Trading Alert : News Releases and Position Management 📰 🗞️ 🚫🚏
As a reminder, news releases can have a significant impact on market prices and volatility. To minimize potential losses and protect your running positions,
we recommend the following:
Avoid taking new trades during news releases
Use trailing stop-loss orders to protect your running positions and lock in profits
💖Supporting our robbery plan 💥Hit the Boost Button💥 will enable us to effortlessly make and steal money 💰💵. Boost the strength of our robbery team. Every day in this market make money with ease by using the Thief Trading Style.🏆💪🤝❤️🎉🚀
I'll see you soon with another heist plan, so stay tuned 🤑🐱👤🤗🤩

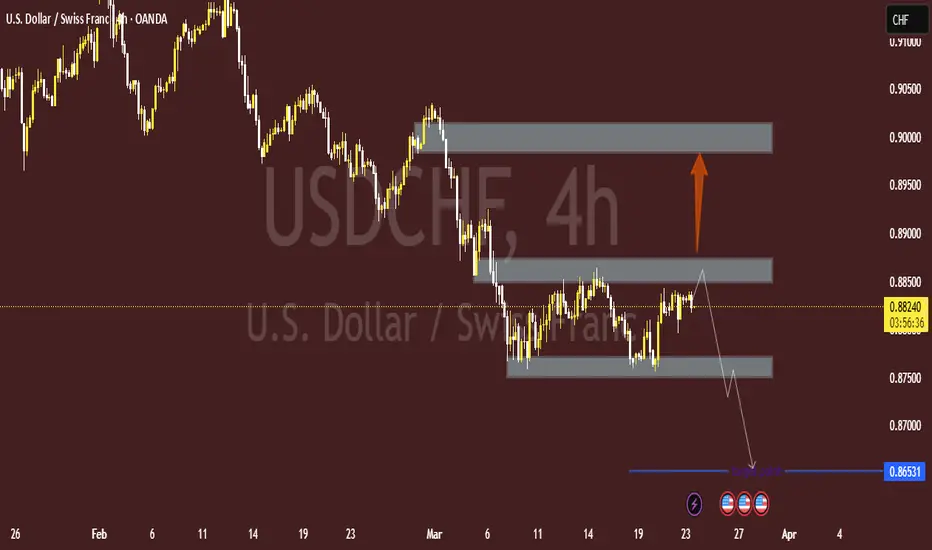
USD/CHF 4H Analysis – Key Levels & Trade Setup🔍 Key Observations:
📌 Supply & Demand Zones:
🔴 Upper Supply Zone (~0.9000): 🔥 Strong resistance where sellers might enter.
🟠 Mid Supply Zone (~0.8850): ⚠️ Key resistance where price is testing.
🟢 Lower Demand Zone (~0.8750): ✅ Possible support where buyers could step in.
📊 Price Action:
🔼 Price is currently at 0.88230 📍 near resistance.
🔽 If rejected, it might drop ⬇️ toward 0.86531 🎯.
🔼 If buyers win, it could rise to 0.9000 🚀.
📉 Bearish Bias Expected:
❌ Rejection at 0.8850 → Drop to 0.86531 ⏳.
✅ If it breaks higher, look for 0.9000 🎯.
🔎 Final Thoughts:
⚡️ Watch for reactions at 0.8850 📍.
🔹 Bearish confirmation? Sell ➡️ 0.86531.
🔹 Bullish breakout? Buy ➡️ 0.9000.
🎯 Trade wisely! 💰📉📈
USD/CHF (Long)USD/CHF
Daily:
Price > 200EMA
Swing Period 10
Swing Low: 1.10884
Swing Low: 1.15030
Volume Imbalance: 3 Candles
Daily Order Block: 1.12253 / 1.11294
H4:
Price > 200EMA
Swing Period: 7
Swing High: 1.15030
Swing Low: 1.12860
Volume Imbalance: 2 Candles
H4 Order Block: 1.13452 / 1.13089
H1:
Swing Period: 5
Swing High: 1.15030
Swing Low: 1.12860
Volume Imbalance: 25 Candles
H1 Order Block: 1.13452 / 1.13089
Model 1:
Entry Price: 1.13241
Stop Loss: 1.12860
TP1: 1.14003 @ 1:2 / 50%
TP2: 1.14383 @ 1:3 / 25%
SL: Breakeven
TP3: 1.14764 @ 1:4 / 25%
Model 2:
Entry Price: 1.13690 - 1.13318
Entry Trigger: 9EMA X 21EMA
SL: Above recent swing low
TP1: 1:2
SL: Trailing 9EMA

USD/CHF Market Analysis – Potential Bullish ReversalThe USD/CHF pair is currently in a downtrend, as indicated by the overall bearish price action. However, the chart suggests a potential reversal scenario.
Price is approaching a key H4 demand zone, which previously acted as strong support. If this level holds, a bullish move could be anticipated. The projected market structure indicates a possible pullback before a continuation upwards, aligning with the larger trend shift.
Traders should monitor price reaction within the demand zone, as a break below could indicate further downside continuation, while a strong rejection may confirm a bullish reversal.

USD/CHF Falls to Its Lowest Level in Nearly Five MonthsUSD/CHF Falls to Its Lowest Level in Nearly Five Months
Today, the exchange rate of one US dollar against the Swiss franc dropped below 0.87000 francs—its lowest level since early November 2024.
Since the start of 2025, the USD/CHF pair has declined by more than 4%.
Why Is USD/CHF Falling Today?
On one hand, the US dollar is weakening against other currencies due to Trump’s decision to implement the previously announced tariffs on international trade, as mentioned in our previous post.
On the other hand, the Swiss franc is gaining strength due to its appeal as a safe-haven asset. Furthermore, this morning’s release of the Consumer Price Index (CPI) showed that inflation in Switzerland remains at zero, increasing the franc’s value at a time when tariff conflicts pose risks to the global economy.
Technical Analysis of the USD/CHF Chart
Since the start of 2025, the USD/CHF pair has been following a downward trajectory, highlighted by a declining channel (marked in red), with the following key points:
→ The median line has shifted from support to resistance, as indicated by the arrows.
→ The price broke through the March support level around 0.8757, accelerating the decline.
→ The lower boundary of the channel provided support this morning, slowing bearish momentum.
It is possible that the 0.8757 level will act as resistance in April 2025. However, the future direction of USD/CHF will largely depend on news developments, particularly statements from global leaders regarding tariffs in international trade.
This article represents the opinion of the Companies operating under the FXOpen brand only. It is not to be construed as an offer, solicitation, or recommendation with respect to products and services provided by the Companies operating under the FXOpen brand, nor is it to be considered financial advice.

USDCHF .. will the weakness continue ??I really don't see any reason for a change unless of course Mr .. causes another upheaval. For now, check out your charts and note that:
Monthly - bearish
Weekly - bearish
Daily - bearish
Intraday - all bearish.
We will hit and break a few S/R levels, but IMO, we should eventually get down to 0.8400.
This is not a trade recommendation, merely my own analysis. Trading carries a high level of risk, so only trade with money you can afford to lose and carefully manage your capital and risk. If you like my idea, please give a “boost” and follow me to get even more. Please comment and share your thoughts too!!

USDCHF SHORT 4h bearish confirmation USDCHF Sell until the 1h orderblock downside. We have Bearish confirmation on 4h timeframe.


USDCHF LONG reboundUSDCHF Rebound until 60% fibbocci level on daily timeframe. moreover the MACD created Bullish divergence and the RSI is oversold.
