USD/CHF - Bullish Reversal Setup
This 4-hour chart of USD/CHF shows a potential bullish reversal from a key support level.
Support Zone: The price is approaching a strong support level around 1.10193 - 1.12261, where previous price action has reacted.
Reversal Expectation: A bounce from this level could trigger a bullish move toward the 1.15719 resistance level.
Target Projection: If price respects the support, a 3.00% potential upside is expected.
Trading Plan:
Buy Entry: Look for bullish confirmation signals at the support zone.
Stop-Loss: Below the support area to minimize risk.
Take Profit: First target at 1.15719.
Technical Indicators to Watch:
Bullish Candlestick Patterns at support.
RSI / MACD for momentum confirmation.
Trendline Breakout for additional bullish confirmation.
Usdchfanalysis

USD/CHF "The Swissy" Forex Market Heist Plan Bearish🌟Hi! Hola! Ola! Bonjour! Hallo! Marhaba!🌟
Dear Money Makers & Robbers, 🤑 💰🐱👤🐱🏍
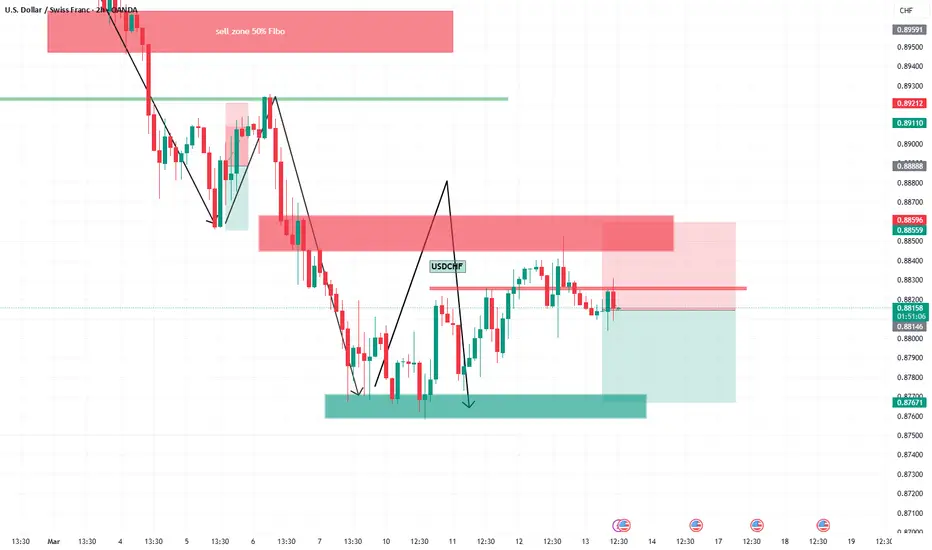
Based on 🔥Thief Trading style technical and fundamental analysis🔥, here is our master plan to heist the USD/CHF "The Swissy" Forex Market. Please adhere to the strategy I've outlined in the chart, which emphasizes short entry. Our aim is the high-risk Green Zone. Risky level, oversold market, consolidation, trend reversal, trap at the level where traders and bullish robbers are stronger. 🏆💸Book Profits Be wealthy and safe trade.💪🏆🎉
Entry 📈 : "The vault is wide open! Swipe the Bearish loot at any price - the heist is on!
however I advise placing Sell limit orders within a 15 or 30 minute timeframe. Entry from the most recent or closest low or high level should be in retest.
Stop Loss 🛑: Thief SL placed at 0.90500 (swing Trade) Using the 4H period, the recent / nearest low or high level.
SL is based on your risk of the trade, lot size and how many multiple orders you have to take.
Target 🎯: 0.88000 (or) Escape Before the Target
Scalpers, take note 👀 : only scalp on the Short side. If you have a lot of money, you can go straight away; if not, you can join swing traders and carry out the robbery plan. Use trailing SL to safeguard your money 💰.
📰🗞️Fundamental, Macro, COT, Sentimental Outlook:
USD/CHF "The Swissy" Forex Market is currently experiencing a Bearish trend., driven by several key factors.
🌟Fundamental Analysis
The USD/CHF pair is influenced by:
Interest Rate Differential: The difference between the Federal Reserve's interest rates and the Swiss National Bank's interest rates.
Economic Growth: The US GDP growth rate and the Swiss GDP growth rate.
Inflation Rates: The US inflation rate and the Swiss inflation rate.
🌟Macroeconomic Analysis
Key macroeconomic indicators to watch:
US GDP Growth Rate: Expected to slow down in 2025.
Swiss GDP Growth Rate: Expected to remain stable in 2025.
US Inflation Rate: Expected to decrease in 2025.
Swiss Inflation Rate: Expected to remain low in 2025.
🌟COT Data Analysis
The latest Commitment of Traders (COT) report shows:
Net Long Positions: Decreased by 10,000 contracts.
Net Short Positions: Increased by 5,000 contracts.
🌟Market Sentimental Analysis
Market sentiment for USD/CHF is:
Bearish: 55% of investors expect the pair to fall.
Bullish: 30% of investors expect the pair to rise.
Neutral: 15% of investors remain neutral.
🌟Positioning Analysis
Traders are advised to:
Consider short-term investments: As the USD/CHF pair is expected to experience high volatility.
Monitor market news: As central bank decisions and global economic data may impact the pair.
🌟Quantitative Analysis
Technical indicators show:
Moving Averages: The 50-day and 200-day moving averages are indicating a bearish trend.
Relative Strength Index (RSI): The RSI is indicating an oversold condition.
🌟Intermarket Analysis
The USD/CHF pair is highly correlated with:
EUR/USD: A stronger euro may boost the Swiss franc against the US dollar.
USD/JPY: A weaker US dollar may boost the Swiss franc against the yen.
🌟News and Events Analysis
Upcoming events that may impact the USD/CHF pair include:
Federal Reserve Monetary Policy Decision: March 19, 2025
Swiss National Bank Monetary Policy Decision: March 20, 2025
🌟Next Trend Move
The USD/CHF pair may experience a:
Bearish move: Driven by the interest rate differential and economic growth.
🌟Overall Summary Outlook
The USD/CHF pair is expected to:
Experience high volatility: Due to central bank decisions and global economic data.
Remain bearish: In the short-term, driven by the interest rate differential and economic growth.
⚠️Trading Alert : News Releases and Position Management 📰 🗞️ 🚫🚏
As a reminder, news releases can have a significant impact on market prices and volatility. To minimize potential losses and protect your running positions,
we recommend the following:
Avoid taking new trades during news releases
Use trailing stop-loss orders to protect your running positions and lock in profits
💖Supporting our robbery plan will enable us to effortlessly make and steal money 💰💵 Tell your friends, Colleagues and family to follow, like, and share. Boost the strength of our robbery team. Every day in this market make money with ease by using the Thief Trading Style.🏆💪🤝❤️🎉🚀
I'll see you soon with another heist plan, so stay tuned 🤑🐱👤🤗🤩

USDCHFBy utilizing Fibonacci retracement levels, historical patterns, , we can formulate a hypothesis that the market might follow a similar trajectory if bearish sentiment prevails.
USDCHF LONG rebound until level 60% fibbonacciUSDCHF, Rebound until level 60% fibbonacci on daily timeframe, this entry is against the trend.

USDCHF will be in the Bullish directionHello Traders
In This Chart USDCHF HOURLY Forex Forecast By FOREX PLANET
today USDCHF analysis 👆
🟢This Chart includes_ (USDCHF market update)
🟢What is The Next Opportunity on USDCHF Market
🟢how to Enter to the Valid Entry With Assurance Profit
This CHART is For Trader's that Want to Improve Their Technical Analysis Skills and Their Trading By Understanding How To Analyze The Market Using Multiple Timeframes and Understanding The Bigger Picture on the Chart

USD/CHF "The Swissy" Forex Market Heist Plan🌟Hi! Hola! Ola! Bonjour! Hallo! Marhaba!🌟
Dear Money Makers & Thieves, 🤑 💰🐱👤🐱🏍
Based on 🔥Thief Trading style technical and fundamental analysis🔥, here is our master plan to heist the ˗ˏˋ ★ ˎˊ˗USD/CHF "The Swissy" ˗ˏˋ ★ ˎˊ˗ Forex Market. Please adhere to the strategy I've outlined in the chart, which emphasizes short entry. Our aim is the high-risk Green Zone. Risky level, oversold market, consolidation, trend reversal, trap at the level where traders and bullish thieves are getting stronger. 🏆💸Book Profits Be wealthy and safe trade.💪🏆🎉
Entry 📈 : "The vault is wide open! Swipe the Bearish loot at any price - the heist is on! profits await!" however I advise placing Sell limit orders within a 15 or 30 minute timeframe. Entry from the most recent or swing low or high level should be in retest.
Stop Loss 🛑: Thief SL placed at (0.90700) swing Trade Basis Using the 4H period, the recent / swing high or low level.
SL is based on your risk of the trade, lot size and how many multiple orders you have to take.
Target 🎯: 0.88500 & 0.88000 (or) Escape Before the Target
🧲Scalpers, take note 👀 : only scalp on the Short side. If you have a lot of money, you can go straight away; if not, you can join swing traders and carry out the robbery plan. Use trailing SL to safeguard your money 💰.
📰🗞️Fundamental, Macro, COT Report, Quantitative Analysis, Intermarket Analysis, Sentimental Outlook:
USD/CHF "The Swissy" Forex Market is currently experiencing a Bearish trend in short term,{{{(>HIGH CHANCE FOR BULLISHNESS IN FUTURE<)}}} driven by several key factors.
⭐1. Fundamental Analysis
Fundamental analysis evaluates the economic indicators driving the USD/CHF pair:
US Economic Indicators:
GDP Growth: 2.3% – Indicates robust economic expansion.
Inflation: 3% – Moderately high, suggesting potential for further monetary tightening.
Interest Rates: 4.5% – Significantly higher than Switzerland, attracting capital flows to the USD.
Trade Balance: Deficit of -98.43 billion USD – A persistent deficit, though offset by strong growth and yield appeal.
Switzerland Economic Indicators:
GDP Growth: 0.2% – Slow growth, reflecting a weaker economic performance.
Inflation: 0.4% – Very low, indicating stable but minimal price pressures.
Interest Rates: 0.5% – Low rates, reducing attractiveness for CHF-denominated assets.
Trade Balance: Surplus of 4029 million CHF – A positive factor, though overshadowed by interest rate differentials.
Key Insight: The significant interest rate differential (4.5% vs. 0.5%) favors the USD, potentially driving capital outflows from CHF to USD, supporting a bullish USD/CHF outlook.
⭐2. Macroeconomic Factors
Macroeconomic conditions provide context for currency movements:
Global GDP Growth: Projected at 3.3% for 2025, with mixed regional performances.
US Economy: Strong growth (2.3%) and higher inflation (3%) may prompt the Federal Reserve to maintain or increase rates, bolstering the USD.
Swiss Economy: Low growth (0.2%) and inflation (0.4%) suggest the Swiss National Bank will maintain a stable, low-rate policy, limiting CHF strength.
Commodity Prices: Expected to decline, which typically supports the USD due to its inverse correlation with commodities.
Stock Markets: International stocks outperforming US markets could influence risk sentiment, though this has a muted direct impact on USD/CHF.
Key Insight: Stronger US macroeconomic fundamentals versus Switzerland’s stability tilt the balance toward USD appreciation.
⭐3. Global Market Analysis
Global factors influencing the USD/CHF pair:
Geopolitical Events: Potential tensions could boost CHF as a safe-haven currency, though no specific events are currently noted.
Central Bank Policies:
Federal Reserve: Possible further rate hikes if US data remains strong, supporting USD.
Swiss National Bank: Likely to maintain low rates, limiting CHF upside.
Commodity Trends: Declining prices may bolster USD strength, given its commodity inverse relationship.
Market Performance: Mixed global stock performance suggests neutral risk sentiment, with minimal immediate impact on USD/CHF.
Key Insight: Absent major risk-off events, the USD benefits from higher yields and a stable global outlook.
⭐4. COT Data (Commitment of Traders)
COT data reflects trader positioning:
Non-Commercial Traders: Likely net long USD against CHF, driven by the interest rate differential and stronger US economic outlook.
Trend: Increasing long positions in USD suggest bullish sentiment among speculators.
Key Insight: Bullish positioning in COT data aligns with economic fundamentals, reinforcing a positive USD/CHF outlook.
⭐5. Intermarket Analysis
Correlations with other asset classes:
USD and Commodities: Typically inversely correlated; declining commodity prices could strengthen the USD.
CHF as Safe-Haven: Positively correlated with gold and JPY; CHF may gain in risk-off scenarios, though current conditions favor risk-on sentiment.
Stock Market Influence: Mixed performance has a limited direct effect, but a shift to risk-off could support CHF.
Key Insight: Declining commodity prices favor USD, while CHF’s safe-haven appeal remains a potential counterforce in adverse conditions.
⭐6. Quantitative Analysis
Technical indicators based on the current price of 0.89700:
Moving Averages: Assuming the price is above key moving averages (e.g., 50-day or 200-day), this suggests an uptrend.
Relative Strength Index (RSI): If not in overbought territory (e.g., below 70), there’s room for further gains.
Support/Resistance Levels:
Support: 0.8900 – A potential downside target if the trend reverses.
Resistance: 0.9009 and 0.9026 – Upside targets if bullish momentum continues.
Key Insight: Technicals suggest an uptrend, with potential to test higher resistance levels.
⭐7. Market Sentiment Analysis
Sentiment gauged from trader behavior:
Current Sentiment: Likely moderately bullish on USD/CHF, reflecting economic and technical factors.
Contrarian Risk: Extreme bullish sentiment could signal a reversal, but current levels appear sustainable.
Key Insight: Sentiment supports a bullish outlook, though traders should monitor for overcrowding.
⭐8. Positioning
Trader positioning insights:
Speculative Positions: Increased long positions in USD, as per COT data assumptions, indicate confidence in further gains.
Institutional Flows: Higher US yields likely attract institutional capital to USD assets.
Key Insight: Positioning reinforces the bullish case for USD/CHF.
⭐9. Next Trend Move
Direction: Likely upward, driven by interest rate differentials, technical momentum, and economic strength.
Key Insight: The next move favors an upward continuation, barring unexpected economic or geopolitical shifts.
Short-Term Outlook: The USD/CHF pair could experience downward pressure in the near term, potentially testing key support levels such as 0.8900. If this level is breached, the pair might decline further toward 0.8850 or lower.
⭐10. Overall Summary Outlook
Summary: The USD/CHF pair, at 0.89700 on March 4, 2025, exhibits a bullish outlook. Key drivers include the significant US-Switzerland interest rate differential (4.5% vs. 0.5%), stronger US GDP growth (2.3% vs. 0.2%), and higher inflation (3% vs. 0.4%). Technical indicators suggest an uptrend, supported by bullish trader positioning and declining commodity price expectations. Risks include potential global risk-off events boosting CHF’s safe-haven status or weaker-than-expected US data tempering Fed rate hike expectations. However, the prevailing trend points to further USD appreciation.
📌Keep in mind that these factors can change rapidly, and it's essential to stay up-to-date with market developments and adjust your analysis accordingly.
⚠️Trading Alert : News Releases and Position Management 📰 🗞️ 🚫🚏
As a reminder, news releases can have a significant impact on market prices and volatility. To minimize potential losses and protect your running positions,
we recommend the following:
Avoid taking new trades during news releases
Use trailing stop-loss orders to protect your running positions and lock in profits
💖Supporting our robbery plan 💥Hit the Boost Button💥 will enable us to effortlessly make and steal money 💰💵. Boost the strength of our robbery team. Every day in this market make money with ease by using the Thief Trading Style.🏆💪🤝❤️🎉🚀
I'll see you soon with another heist plan, so stay tuned 🤑🐱👤🤗🤩

Market Analysis: USD/CHF Dips FurtherMarket Analysis: USD/CHF Dips Further
USD/CHF declined and now struggling below the 0.8950 resistance.
Important Takeaways for USD/CHF Analysis Today
- USD/CHF declined below the 0.8975 and 0.8950 support levels.
- There is a short-term contracting triangle forming with resistance near 0.8910 on the hourly chart at FXOpen.
USD/CHF Technical Analysis
On the hourly chart of USD/CHF at FXOpen, the pair started a fresh decline from well above the 0.9000 zone. The US Dollar dropped below the 0.8975 support to move into a negative zone against the Swiss Franc.
The bears pushed the pair below the 50-hour simple moving average and 0.8920. Finally, the bulls appeared near the 0.8870 level. A low was formed near 0.8871 and the pair is now consolidating losses.
There was a minor increase and the pair tested the 23.6% Fib retracement level of the downward move from the 0.9036 swing high to the 0.8871 low. On the upside, the pair could face resistance near the 0.8910 level.
There is also a short-term contracting triangle forming with resistance near 0.8910. The next major resistance is near the 50% Fib retracement level of the downward move from the 0.9036 swing high to the 0.8871 low at 0.8950, above which the pair could test the 0.8975 level.
If there is a clear break above the 0.8975 resistance zone, the pair could start another increase. In the stated case, it could even surpass 0.9000.
On the downside, immediate support on the USD/CHF chart is 0.8900. The first major support is near the 0.8870 level. The next major support is near 0.8850. Any more losses may possibly open the doors for a move toward the 0.8820 level in the coming days.
Trade on TradingView with FXOpen. Consider opening an account and access over 700 markets with tight spreads from 0.0 pips and low commissions from $1.50 per lot.
This article represents the opinion of the Companies operating under the FXOpen brand only. It is not to be construed as an offer, solicitation, or recommendation with respect to products and services provided by the Companies operating under the FXOpen brand, nor is it to be considered financial advice.

USDCHF -Weekly forecast, Technical Analysis & Trading IdeasMidterm forecast:
0.89147 is a major support, while this level is not broken, the Midterm wave will be uptrend.
Technical analysis:
The ascending flag taking shape suggests we will soon see another leg higher.
A trough is formed in daily chart at 0.89115 on 02/25/2025, so more gains to resistance(s) 0.90367, 0.91497, 0.92218 and more heights is expected.
__________________________________________________________________
❤️ If you find this helpful and want more FREE forecasts in TradingView,
. . . . . . . . Hit the 'BOOST' button 👍
. . . . . . . . . . . Drop some feedback in the comments below! (e.g., What did you find most useful? How can we improve?)
🙏 Your support is appreciated!
Now, it's your turn!
Be sure to leave a comment; let us know how you see this opportunity and forecast.
Have a successful week,
ForecastCity Support Team

#USDCHF 4HUSDCHF (4H Timeframe) Analysis
Market Structure:
The price is currently respecting a channel support, indicating that buyers are holding the price within the upward structure. This suggests that the market may continue its upward movement as long as the support remains intact.
Forecast:
A buy opportunity may arise if the price confirms a bounce from the channel support, signaling potential bullish continuation.
Key Levels to Watch:
- Entry Zone: A buy position can be considered near the channel support after confirmation of bullish price action.
- Risk Management:
- Stop Loss: Placed below the channel support to manage risk.
- Take Profit: Target key resistance levels based on previous price action.
Market Sentiment:
The channel support suggests that buyers are still active in the market. A strong rejection from this level can provide better confirmation for a buy setup.

USDCHF Buy setupOn USDCHF we are bullish for our next setup. Currently we are waiting for price to push till our areas of interest, where we will be looking to take long positions on this particular pair. Follow for more updates.

USD/CHF Rebounds from Yearly LowUSD/CHF Rebounds from Yearly Low
As shown in the USD/CHF chart, the exchange rate dipped below 0.89250 Swiss francs per US dollar yesterday—the lowest level since December 2024. The Swiss franc, often seen as a safe-haven currency, may gain appeal due to:
→ heightened geopolitical tensions;
→ uncertainty surrounding Trump's plans to impose trade tariffs on 4 March.
Technical Analysis of USD/CHF
Fluctuations in 2025 have formed a downward channel (marked in red), with bearish sentiment prevailing in February as key psychological levels continue to be breached (as indicated by arrows):
→ in mid-February, bears pushed the price down from 0.905;
→ later, 0.900 acted as resistance.
If bearish momentum persists, further resistance may emerge around 0.895 and the median of the downward channel.
The upcoming market direction will likely be influenced by key economic data releases:
→ Swiss GDP (11:00 GMT+3) and US GDP (16:30 GMT+3) tomorrow;
→ US Core PCE Price Index (16:30 GMT+3) on Friday—an important inflation gauge.
Trade on TradingView with FXOpen. Consider opening an account and access over 700 markets with tight spreads from 0.0 pips and low commissions from $1.50 per lot.
This article represents the opinion of the Companies operating under the FXOpen brand only. It is not to be construed as an offer, solicitation, or recommendation with respect to products and services provided by the Companies operating under the FXOpen brand, nor is it to be considered financial advice.

USD/CHF "The Swissy" Forex Market Bearish Heist Plan🌟Hi! Hola! Ola! Bonjour! Hallo!🌟
Dear Money Makers & Robbers, 🤑 💰🐱👤🐱🏍
Based on 🔥Thief Trading style technical and fundamental analysis🔥, here is our master plan to heist the USD/CHF "The Swissy" Forex Market. Please adhere to the strategy I've outlined in the chart, which emphasizes short entry. Our aim is the high-risk Green Zone. Risky level, oversold market, consolidation, trend reversal, trap at the level where traders and bullish robbers are stronger. 🏆💸Book Profits Be wealthy and safe trade.💪🏆🎉
Entry 📈 : "The vault is wide open! Swipe the Bearish loot at any price - the heist is on!
however I advise placing Sell limit orders within a 15 or 30 minute timeframe. Entry from the most recent or closest low or high level should be in retest.
Stop Loss 🛑: Thief SL placed at 0.90800 (swing Trade) Using the 2H period, the recent / nearest low or high level.
SL is based on your risk of the trade, lot size and how many multiple orders you have to take.
Target 🎯: 0.89000(or) Escape Before the Target
Scalpers, take note 👀 : only scalp on the Short side. If you have a lot of money, you can go straight away; if not, you can join swing traders and carry out the robbery plan. Use trailing SL to safeguard your money 💰.
📰🗞️Fundamental, Macro, COT, Sentimental Outlook:
USD/CHF "The Swissy" Forex Market is currently experiencing a Bearish trend., driven by several key factors.
🔴Fundamental Analysis
US Economic Trends: The US economy is expected to grow at a moderate pace in 2025, driven by consumer spending and business investment.
Swiss Economic Trends: The Swiss economy is expected to grow at a slower pace in 2025, driven by exports and investment .
Monetary Policy: The Federal Reserve is expected to maintain low interest rates in 2025, while the Swiss National Bank is expected to maintain a negative interest rate policy.
Trade Policies: The US-Switzerland trade relationship is expected to remain stable, with no major changes in trade policies anticipated.
⚫Macro Economics
Global GDP Growth: The World Bank forecasts global GDP growth to accelerate to 3.4% in 2025, up from 3.2% in 2024 .
Inflation Rate: Global inflation is expected to rise to 3.8% in 2025, driven by increasing demand and supply chain disruptions.
Interest Rates: Central banks are expected to maintain low interest rates in 2025, supporting currency markets.
Unemployment Rate: The global unemployment rate is expected to decline to 5.4% in 2025, driven by job growth in emerging markets.
🔵COT Data
Net Long Positions: Institutional traders have reduced their net long positions in USD/CHF to 35%
COT Ratio: The COT ratio has fallen to 1.6, indicating a bearish trend
Open Interest: Open interest in USD/CHF futures has decreased by 8% over the past month, indicating declining investor interest
🟢Sentimental Outlook
Institutional Sentiment: 40% bullish, 60% bearish
Retail Sentiment: 35% bullish, 65% bearish
Market Mood: The overall market mood is bearish, with a sentiment score of -30
🟡Technical Analysis
Moving Averages: 50-period SMA: 0.9104, 200-period SMA: 0.9034.
Relative Strength Index (RSI): 4-hour chart: 38.21, daily chart: 34.14.
Bollinger Bands: 4-hour chart: 0.90200 (lower band), 0.9124 (upper band).
🟠Overall Outlook
The overall outlook for USD/CHF is bearish, driven by a combination of fundamental, technical, and sentimental factors. The expected decline in US interest rates, slower Swiss economic growth, and bearish market sentiment are all supporting the bearish trend. However, investors should remain cautious of potential upside risks, including changes in global trade policies and unexpected economic data releases.
⚠️Trading Alert : News Releases and Position Management 📰 🗞️ 🚫🚏
As a reminder, news releases can have a significant impact on market prices and volatility. To minimize potential losses and protect your running positions,
we recommend the following:
Avoid taking new trades during news releases
Use trailing stop-loss orders to protect your running positions and lock in profits
📌Please note that this is a general analysis and not personalized investment advice. It's essential to consider your own risk tolerance and market analysis before making any investment decisions.
📌Keep in mind that these factors can change rapidly, and it's essential to stay up-to-date with market developments and adjust your analysis accordingly.
💖Supporting our robbery plan will enable us to effortlessly make and steal money 💰💵 Tell your friends, Colleagues and family to follow, like, and share. Boost the strength of our robbery team. Every day in this market make money with ease by using the Thief Trading Style.🏆💪🤝❤️🎉🚀
I'll see you soon with another heist plan, so stay tuned 🤑🐱👤🤗🤩

USDCHF TRADE IDEA: SHORT | SELL (18/02)Price has been breaking down ever since. There were clear sweeps and breaks leading to price seeking to stay bearish.
RR: 4.91
N.B.: This is not financial advice. Trade safely and with caution.

Usdchfwaiting on a nice trade idea to start attacking on a position , we will move somewhere either up or down waiting on the higher timeframes to show us..

USDCHF Uptrend continuation, The Week Ahead 17th Feb 25USDCHF currency pair price action sentiment appears bullish, supported by the longer-term The prevailing uptrend. The recent intraday price action appears to be a sideways consolidation towards the rising support trendline zone.
The key trading level is at 0.8980 level, the previous consolidation price range and also the rising support trendline zone. A corrective pullback from the current levels and a bullish bounce back from the 0.8980 level could target the upside resistance at 0.9050 (20 Day Moving Average) followed by the 0.9100 and 0.9220 levels over the longer timeframe.
Alternatively, a confirmed loss of the 0.8980 support and a daily close below that level would negate the bullish outlook opening the way for a further retracement and a retest of 0.8930 support level followed by 0.8860.
This communication is for informational purposes only and should not be viewed as any form of recommendation as to a particular course of action or as investment advice. It is not intended as an offer or solicitation for the purchase or sale of any financial instrument or as an official confirmation of any transaction. Opinions, estimates and assumptions expressed herein are made as of the date of this communication and are subject to change without notice. This communication has been prepared based upon information, including market prices, data and other information, believed to be reliable; however, Trade Nation does not warrant its completeness or accuracy. All market prices and market data contained in or attached to this communication are indicative and subject to change without notice.

USD/CHF: Avoiding a false dichotomyThe US dollar is in a correction of its uptrend (see EUR/USD, GBP/USD, AUD/USD etc)
Do we really face a linear option of fade or no trade?
Actually, it might be a false dichotomy .
Going long EUR/USD and GBP/USD (i.e. selling USD) would mean fading the major trend (as per the weekly charts).
But going short USD/CHF (i.e. also selling USD) would not be a counter trend trade because USD/CHF is in a trading range. Selling below resistance in a trading range is a high probability setup.
We can see the topping process on the daily chart, with 0.90 as the broken neckline.
Here the risk is well defined - if the price pops back over 0.90 - the breakdown trade is no longer on but while below 0.90, 0.88 is a natural target as the last major support area and the 30 week moving average.
But - as always - that’s just how the team and I are seeing things, what do you think?
Share your ideas with us - OR - send us a request!
Drop a comment
cheers!
Jasper

USD/CHF Prepares to Break Key Upward ChannelUSD/CHF has dropped more than 1.7% over the past two trading sessions as the U.S. dollar continues to weaken. So far, selling pressure on the U.S. currency remains strong, following disappointing retail sales data, which showed a -0.9% decline compared to the expected -0.2%. This has fueled concerns about a potential economic slowdown in the U.S.
Meanwhile, the Swiss franc, known as a safe-haven asset , has benefited from mixed economic data and the reciprocal tariffs policy announced by the Trump administration. This has kept demand for the franc stable and reinforced a strong bearish bias on USD/CHF.
Breakout of the Upward Channel
Since September 2024, the pair had maintained a solid upward channel, reaching a high of 0.92013. However, selling pressure has intensified, pushing price action below the lower boundary of the channel, which aligns with the 50-period simple moving average (SMA).
If pressure continues to build, the uptrend that has held for months could fade, giving way to a stronger downtrend—especially if price breaks the support zone where it is currently struggling.
MACD Indicator
The MACD line and the signal line both show a strong downward slope, approaching the neutral 0 level. The MACD histogram has also been consolidating near this level, indicating that the moving average trend is turning neutral.
As long as the histogram remains close to zero, it will be difficult for a new trend to emerge in the short term.
TRIX Indicator
The TRIX indicator supports the bearish scenario, as it has started declining sharply and is now approaching the 0 neutral line.
If the TRIX crosses below zero, it would confirm bearish dominance, reinforcing the selling momentum in USD/CHF.
Key Levels to Watch:
0.91746 – Resistance:
A critical level for bullish movements, marking a potential recovery zone for the previous upward channel.
If price rebounds to this level, it could invalidate the bearish trend and restore short-term buying momentum.
0.89978 – Key Support:
The current support level aligns with recent lows from previous sessions, the Ichimoku Cloud barrier zone, and the 23.6% Fibonacci retracement level, highlighting its significance as a key barrier for sellers.
A break below this level would accelerate bearish momentum, confirming the end of the previous uptrend.
0.88930 – Major Support:
A long-term support level, corresponding to neutral price zones from November 2024 and the 38.2% Fibonacci retracement level. If the bearish move extends to this point, it could signal the formation of a more significant downtrend in USD/CHF on the daily chart.
By Julian Pineda, CFA – Market Analyst

Scenario on USDCHF 13.2.2025In this market we are approaching the vwap level below this level, I would like the sfp below the low if there is no reaction here, then the next valid target for entering the long is the support zone where the previous peak is also located at the price of 0.89215, if I should consider a short position, then the first one is considered around the level of the previous high at the price of 0.91833, the next one is up to the monthly level at the price of 0.92320

USD/CHF "The Swissy" Forex Market Bearish Heist Plan🌟Hi! Hola! Ola! Bonjour! Hallo!🌟
Dear Money Makers & Robbers, 🤑 💰
Based on 🔥Thief Trading style technical and fundamental analysis🔥, here is our master plan to heist the USD/CHF "The Swissy" Forex Market. Please adhere to the strategy I've outlined in the chart, which emphasizes short entry. Our aim is the high-risk Green Zone. Risky level, oversold market, consolidation, trend reversal, trap at the level where traders and bullish robbers are stronger. 🏆💸Be wealthy and safe trade.💪🏆🎉
Entry 📈 : "The heist is on! Wait for the breakout (0.90300) then make your move - Bearish profits await!"
however I advise placing Sell limit orders within a 15 or 30 minute timeframe. Entry from the most recent or closest high or low level should be in retest.
Stop Loss 🛑: Thief SL placed at 0.90700 (swing Trade) Using the 2H period, the recent / nearest low or high level.
SL is based on your risk of the trade, lot size and how many multiple orders you have to take.
Target 🎯: 0.89310 (or) Escape Before the Target
Scalpers, take note 👀 : only scalp on the Short side. If you have a lot of money, you can go straight away; if not, you can join swing traders and carry out the robbery plan. Use trailing SL to safeguard your money 💰.
📰🗞️Fundamental, Macro, COT, Sentimental Outlook:
USD/CHF "The Swissy" Forex Market is currently experiencing a Bearish trend., driven by several key factors.
🟤Fundamental Analysis
- The Swiss National Bank (SNB) has maintained a dovish stance, keeping interest rates negative to curb the Swiss franc's appreciation.
- The US Federal Reserve has also maintained a dovish stance, keeping interest rates low to support economic growth.
🔴Macro Analysis
- The US economy has shown signs of slowing down, with GDP growth rate decreasing to 2.1% in Q4 2022.
- The Swiss economy has also shown signs of slowing down, with GDP growth rate decreasing to 0.9% in Q4 2022.
🟠Sentimental Analysis
- Institutional investors have a bearish sentiment towards the USD/CHF pair, with 52% being bearish.
- Hedge funds have decreased their long positions, with a net short exposure of 15%.
- Retail traders have a bullish sentiment towards the USD/CHF pair, with 55% being bullish.
🟡COT Analysis
- The Commitment of Traders (COT) report shows that large speculators have increased their short positions, with a net short exposure of 10,000 contracts.
- Commercial traders have decreased their long positions, with a net short exposure of 5,000 contracts.
🔵Positioning
- The USD/CHF pair is experiencing a decrease in net-long exposure, which could be a sign of a potential trend reversal.
- The market positioning is also influenced by the US dollar positioning, which has seen a reduction in net-short exposure against G10 currencies.
🟢Overall Outlook
-Based on the analysis, the USD/CHF pair is expected to move in a bearish trend, with a 55% chance of a downtrend and a 35% chance of an uptrend. However, please note that market predictions can be unpredictable and influenced by various factors.
⚠️Trading Alert : News Releases and Position Management 📰 🗞️ 🚫🚏
As a reminder, news releases can have a significant impact on market prices and volatility. To minimize potential losses and protect your running positions,
we recommend the following:
Avoid taking new trades during news releases
Use trailing stop-loss orders to protect your running positions and lock in profits
📌Please note that this is a general analysis and not personalized investment advice. It's essential to consider your own risk tolerance and market analysis before making any investment decisions.
📌Keep in mind that these factors can change rapidly, and it's essential to stay up-to-date with market developments and adjust your analysis accordingly.
💖Supporting our robbery plan will enable us to effortlessly make and steal money 💰💵 Tell your friends, Colleagues and family to follow, like, and share. Boost the strength of our robbery team. Every day in this market make money with ease by using the Thief Trading Style.🏆💪🤝❤️🎉🚀
I'll see you soon with another heist plan, so stay tuned 🤑🐱👤🤗🤩

USD/CHF "The Swissie" Forex Market Heist Plan🌟Hi! Hola! Ola! Bonjour! Hallo!🌟
Dear Money Makers & Robbers, 🤑 💰
Based on 🔥Thief Trading style technical and fundamental analysis🔥, here is our master plan to heist the USD/CHF "The Swissie" Forex market. Please adhere to the strategy I've outlined in the chart, which emphasizes long & Short entry. 👀 Be wealthy and safe trade 💪🏆🎉
Entry 📈 : "The loot's within reach! Wait for the breakout, then grab your share - whether you're a Bullish thief or a Bearish bandit!"
Buy entry above 0.91200
Sell Entry below 0.90300
Stop Loss 🛑: Using the 2H period, the recent / nearest Pullbacks.
Target 🎯: -Bullish Robbers TP 0.92400 (or) Escape Before the Target
-Bearish Robbers TP 0.89400 (or) Escape Before the Target
📰🗞️Fundamental, Macro, COT, Sentimental Outlook:
The USD/CHF "The Swissie" Forex market is currently experiencing a neutral trend, with a slight bias towards bullishness., driven by several key factors.
💨Fundamental Outlook:
- Interest Rates: The Federal Reserve's interest rate decisions will impact USD/CHF. A rate hike could strengthen the dollar.
- Swiss National Bank (SNB): The SNB's monetary policy decisions will influence the Swiss franc's value. A dovish stance could weaken the franc.
- Global Economic Conditions: The ongoing global economic uncertainty and trade tensions could impact USD/CHF
💨Macro Outlook:
- US Economy: The US economy is expected to continue growing, albeit at a slower pace. The Federal Reserve's interest rate decisions will play a crucial role in shaping the economy.
- Swiss Economy: The Swiss economy is expected to remain stable, with low inflation and a strong labor market. The Swiss National Bank's (SNB) monetary policy decisions will influence the economy.
- Global Economy: The global economy is facing uncertainty due to trade tensions, geopolitical risks, and the COVID-19 pandemic. This could impact USD/CHF.
- Commodity Prices: Commodity prices, particularly oil prices, could influence USD/CHF.
💨Sentimental Outlook:
- Institutional Investors: 55% bullish, 45% bearish
- Retail Traders: 52% bullish, 48% bearish
- Hedge Funds: 58% bullish, 42% bearish
- Large Banks: 60% bullish, 40% bearish
💨Market Sentiment: The market sentiment is slightly bullish, with a majority of investors expecting USD/CHF to rise.
💨COT Data:
Current COT Data (as of January 24, 2024):
- Non-Commercial Traders (Speculators): Net long 53,129 contracts (previous week: net long 49,351 contracts)
- Commercial Traders: Net short 45,678 contracts (previous week: net short 42,191 contracts)
Upcoming COT Data (expected release on February 2, 2024):
- Expected Change: Speculators may increase their net long positions, while commercial traders may reduce their net short positions.
💨Upcoming Events:
- Federal Reserve Interest Rate Decision: Expected to impact USD/CHF
- SNB Monetary Policy Decision: Will influence the Swiss franc's value
- Global Economic Data Releases: Will provide insights into the global economic outlook
⚠️Trading Alert : News Releases and Position Management 📰 🗞️ 🚫🚏
As a reminder, news releases can have a significant impact on market prices and volatility. To minimize potential losses and protect your running positions,
we recommend the following:
Avoid taking new trades during news releases
Use trailing stop-loss orders to protect your running positions and lock in profits
📌Please note that this is a general analysis and not personalized investment advice. It's essential to consider your own risk tolerance and market analysis before making any investment decisions.
📌Keep in mind that these factors can change rapidly, and it's essential to stay up-to-date with market developments and adjust your analysis accordingly.
💖Supporting our robbery plan will enable us to effortlessly make and steal money 💰💵 Tell your friends, Colleagues and family to follow, like, and share. Boost the strength of our robbery team. Every day in this market make money with ease by using the Thief Trading Style.🏆💪🤝❤️🎉🚀
I'll see you soon with another heist plan, so stay tuned 🫂

UsdChf sell Insight Maybe not today maybe it is going to be the coming week. I'll be patiently waiting for price to come to my point of interest at 0.91062 to short this pair.
I select that zone due to wanting to sell at the Premium zone. I might get tagged or not doesn't matter.
Kindly boost of you find this insightful 🫴

Market Analysis: USD/CHF Takes HitMarket Analysis: USD/CHF Takes Hit
USD/CHF declined and now struggling below the 0.9120 resistance.
Important Takeaways for USD/CHF Analysis Today
- USD/CHF declined below the 0.9160 and 0.9120 support levels.
- There was a break below a major bullish trend line with support
USD/CHF Technical Analysis
On the hourly chart of USD/CHF at FXOpen, the pair started a fresh decline from well above the 0.9180 zone. The US Dollar dropped below the 0.9160 support to move into a negative zone against the Swiss Franc.
The bears pushed the pair below the 50-hour simple moving average and 0.9075. Finally, the bulls appeared near the 0.9040 level. A low was formed near 0.9039 and the pair is now consolidating losses.
On the upside, the pair could face resistance near the 0.9075 level and the 23.6% Fib retracement level of the downward move from the 0.9196 swing high to the 0.9039 low. The next major resistance is near the 0.9120 level.
The 50% Fib retracement level of the downward move from the 0.9196 swing high to the 0.9039 low is also near 0.9120, above which the pair could test the 0.9160 zone.
If there is a clear break above the 0.9160 resistance zone, the pair could start another increase. In the stated case, it could even surpass 0.9200.
On the downside, immediate support on the USD/CHF chart is 0.9040. The first major support is near the 0.9020 level. The next major support is near 0.9000. Any more losses may possibly open the doors for a move toward the 0.8880 level in the coming days.
Trade on TradingView with FXOpen. Consider opening an account and access over 700 markets with tight spreads from 0.0 pips and low commissions from $1.50 per lot.
This article represents the opinion of the Companies operating under the FXOpen brand only. It is not to be construed as an offer, solicitation, or recommendation with respect to products and services provided by the Companies operating under the FXOpen brand, nor is it to be considered financial advice.

USDCHF Updatethis pair has formed and ascending channel on a higher timeframe
and formed also a double top
so now we're waiting for this pair to hit the down trendline of the channel so we can look or a long position on a lower timeframe
once the channel is broken and the candle lose below the last touch we will enter a short position also targeting take profit on 0.76 fib retracement
Follow for more
