USDCHF short biasI'll be anticipating to short usdChf from 0.91643 taking the Old New York high 0.91611
I didn't see the sell opportunity that happens today to I'm anticipating a pull back to my point of interest then I ride it down.
A believe it's going to be a bearish week.
Please share if you find this insightful 🫴
Usdchfanalysis

USDCHF - Bullish continuation !!Hello traders!
‼️ This is my perspective on USDCHF.
Technical analysis: Here we are in a bullish market structure from 4H timeframe perspective, so I expect price to continue bullish price action after filling the gap and rejecting from support zone + institutional big figure 0.91000.
Like, comment and subscribe to be in touch with my content!

USDCHF - Weekly forecast, Technical Analysis & Trading IdeasMidterm forecast:
0.89147 is a major support, while this level is not broken, the Midterm wave will be uptrend.
We will close our open trades, if the Midterm level 0.89147 is broken.
Technical analysis:
A trough is formed in daily chart at 0.89645 on 01/27/2025, so more gains to resistance(s) 0.91497, 0.92218, 0.94400 and more heights is expected.
Take Profits:
0.85510
0.86286
0.87474
0.88195
0.89147
0.90367
0.91497
0.92218
0.94400
0.96000
0.99200
1.01453
__________________________________________
❤️ If you find this helpful and want more FREE forecasts in TradingView,
. . . . . Please show your support back,
. . . . . . . . Hit the 👍 BOOST button,
. . . . . . . . . . . Drop some feedback below in the comment!
🙏 Your Support is appreciated!
Let us know how you see this opportunity and forecast.
Have a successful week,
ForecastCity Support Team

USDCHF - Short after filling the imbalance !!Hello traders!
‼️ This is my perspective on USDCHF.
Technical analysis: Here we are in a bearish market structure from 4H timeframe perspective, so I look for a short. I expect price to continue the retracement to fill that huge imbalance and then to reject from bearish OB.
Fundamental news: On Wednesday (GMT+2) we will see results of Interest Rate in USA, news with high impact on currency.
Like, comment and subscribe to be in touch with my content!

USDCHF TRADE IDEA: SHORT | SELL (28/01)Price had a huge swept and then broke downwards. This was worth looking into.
RR: 2.25
N.B.: This is not financial advice. Trade safely and with caution.

USDCHF - Weekly forecast, Technical Analysis & Trading IdeasMidterm forecast:
0.86129 is a major support, while this level is not broken, the Midterm wave will be uptrend.
__________________________________________
❤️ If you find this helpful and want more FREE forecasts in TradingView,
. . . . . Please show your support back,
. . . . . . . . Hit the 👍 BOOST button,
. . . . . . . . . . . Drop some feedback below in the comment!
🙏 Your Support is appreciated!
Let us know how you see this opportunity and forecast.
Have a successful week,
ForecastCity Support Team

USDCHF TRADE IDEA : LONG | BUY (23/01/25)Price has already tapped in. I’d look for a clear entry before entering. However this is clear - price did not break aggressively on the way down - rather up.
I’m expecting a buy with ≈ RR: 2.5
N.B.: This is not financial advice. Trade safely and with caution.

USDCHF H4 Projection!Price breaks the trend line and closes below. Now, the price retests the trendline and pushes down sharply with an FVG (fair value gap). We expect the rice to mitigate the FVG and then decline further. So initiate short positions partially near the supply and FVG zone after finding a bearish price action structure.

ALERT! USDCHF Ready to Plummet!
ALERT! USDCHF Ready to Plummet!
Extreme Order Block detected!
Entry point confirmed!

#USDCHF WEEKLYUSDCHF (Weekly Timeframe) Analysis
Market Structure:
The price is currently testing two significant resistance levels: the first being the upper boundary of a channel, and the second a key horizontal resistance zone. Additionally, the formation of a sell engulfing candlestick pattern suggests increased selling pressure at these levels.
Forecast:
A sell opportunity is expected as the price reacts to the dual resistance zones, with bearish momentum likely to push the price lower.
Key Levels to Watch:
- Entry Zone: Near the resistance levels or after confirmation of bearish rejection.
- Risk Management:
- Stop Loss: Placed above the second resistance level or the recent swing high to manage risk.
- Take Profit: Target the midline or lower boundary of the channel for potential downside movement.
Market Sentiment:
The confluence of the channel resistance, horizontal resistance, and the sell engulfing pattern reflects a bearish sentiment, with sellers likely to dominate the market in the short term. Proper confirmation is recommended before entering the trade to ensure alignment with market momentum.

USDCHF IDEAUSDCHF has formed a descending channel on H4 timeframe and it break it with a small candle but its breaking it with a goo candle now so we enter a short position with a take profit on the 3 touch o the lower blue ascending blue trendline
Follow us or more update and ideas
USDCHF - ShortUSDCHF Analysis - SHORT 👆
In this Chart USDCHF D1 Timeframe: By Nii_Billions.
❤️This Chart is for USDCHF market analysis.
❤️Entry, SL, and Target is based off our Strategy.
This chart analysis uses multiple timeframes to analyze the market and to help see the bigger picture on the charts.
The strategy uses technical and fundamental factors, and market sentiment to predict a BEARISH trend in USDCHF, with well-defined entry, stop loss, and take profit levels for risk management.
🟢This idea is purely for educational purposes.🟢
❤️Please, support our work with like & comment!❤️

USDCHF IdeaUSDCHF has formed a ascending channel with more than 3 touches which makes it a valid channel
we're waiting for an H4 candle to close below the last touch and a retest to the channel
when the retest get rejected we enter a short (sell) position
with a take profit which is a touch on a lower trendline and also 0.68
Follow us for more ideas and updates

USDCHF Rising Channel!HI,Traders !
USD-CHF is trading in an
Uptrend and the price
Has formed a rising
Parallel channel so
We are bullish biased
And we will be expecting
A further move up!
Comment and subscribe to help us grow!

USDCHF is in the overbought territoryUSDCHF the Stochastic Oscillator indicates that the pair is in the overbought territory, which might lead to a short-term pullback. if we broke 0.91444, next scalp target is 0.90972. is currently showing a bullish trend on the 4-hour time frame but upside is limited by 0.92123-0.92242 area. So soon maybe we will get a reversal bias.

Dollar Set to rally Before Trump is in office? #USDCHF UPDATEIn this video, we provided a quick update on our USDCHF trade that we analyzed and entered yesterday. We took some profits, broke even on the original position, and added a new position for a short-term play.
We still anticipate higher prices for the USD Dollar overall, especially as we approach President Trump’s upcoming term in office.
If you found this video helpful and want to see more like it, be sure to boost, follow, and share with your fellow traders.
Have a specific pair you’d like us to analyze? Drop it in the comments, and we’ll do our best to cover it this weekend.
Happy trading, and enjoy your weekend!

Is the Dollar Set to rally Before Trump is in office? #USDCHF In this video I go in depth as to why we believe we are set to see higher prices on USDCHF and the US Dollar as a whole.
On the monthly timeframe we can see a large ranging market for USDCHF but we believe this time it will different. Check out the video to find out why in detail! - @BlueOceanFx

Short term Long Flag formation could be complete; I biased towards long. Will it work out? Lets see!

USDCHF Scenario 1.1.2025Now I think we are in for a minor correction to the resistance zone at price 0.89 which is also, among other things, the fibo level 0.5 which if the market holds, we could look at the price level around 0.91.

Potential Upside Ahead for USD/CHF: Watch This ZoneUSD/CHF is trading within a rising wedge pattern, approaching a key resistance level around 0.9020. A breakout above this zone with confirmation could lead to further bullish momentum.
However, if the price fails to sustain above the wedge, a pullback toward the lower trendline or previous support zones is possible
DYOR, NFA

USDCHF bullish continuationPrice is above the 200dma
Looking for a small pullback to support and then continuation to the next resistance.
Also check out the H4 chart
Nicely supported by 20sma in this bullish trend.
This is not a trade recommendation, merely my own analysis. If you decide to trade this, you should be aware that trading carries a high level of risk, so only trade with money you can afford to lose. Please use sound money and risk management, trading without a stop or moving the stop away from price is a recipe for disaster. If you like my idea, please give a “boost” and follow me to get even more. Please comment and share your thoughts too!!
It’s not whether you are right or wrong, but how much money you make when you are right and how much you lose when you are wrong – George Soros


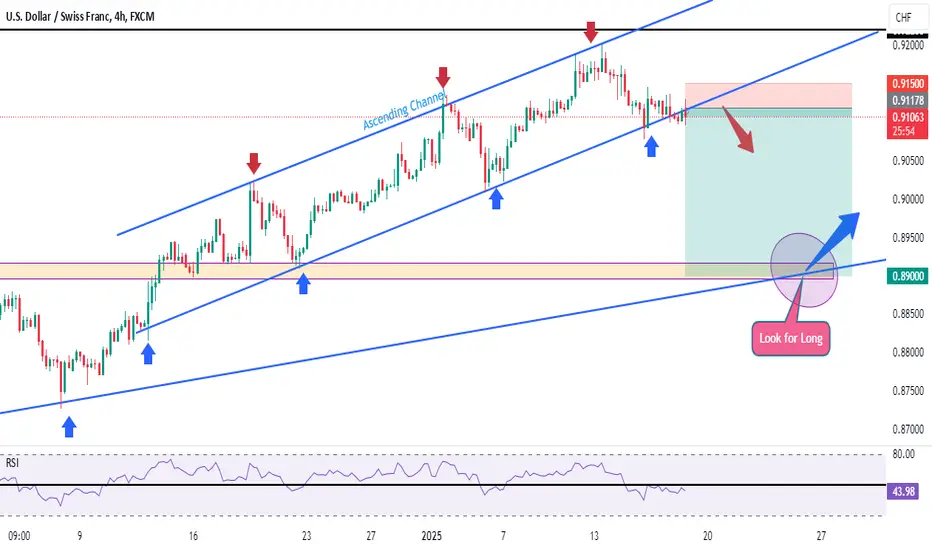
USDCHF LooongThis pair has been forming a strong bullish momentum for the past few weeks, and it had a slight pullback, but I do anticipate that the price might retest the zones at 0.904 and 0.915
Entry point at 0.892, Target 1 at 0.904, Target 2 at 0.915 and SL at 0.884
