USDCHF Short term Bullish!The USDCHF is bullish for the coming week. The pair is looking to complete a particular pattern, the target should be at least about 0.94500 our bluebox projection. At the moment we are expecting the pair to go lower into the bluebox before we see a bounce, the bounce should take the pair to 0.94500 before it turns lower again.
Usdchfforecast

USDCHF | Good Sell Opportunity.When it comes to USDCHF , a while ago, we've seen a strong impulse to the upside. And got rejected from a resistance. Right now price is staying near a supply zone as well. We also seen a multiple rejection from that area as well, which clearly shows the selling strength. Looks like there aren't many support areas till S1. So you could start booking profit from S1, which was the previous resistance area .
If you find this technical analysis useful, please like & share our ideas with the community.
What do you think is more likely to happen? Please share your thoughts in comment section. And also give a thumbs up if you find this idea helpful. Any feedback & suggestions would help in further improving the analysis.
Good Luck!
Disclaimer!
This post does not provide financial advice. It is for educational purposes only! You can use the information from the post to make your own trading plan for the market. But you must do your own research and use it as the priority. Trading is risky, and it is not suitable for everyone. Only you can be responsible for your trading.

USDCHF Short SignalsTime Frame: 4H
Symbol: USDCHF
Bias: Short
The price patter of USDCHF is demonstrating a short bias. We can avail the opportunity by going short if proper money management is in our favor.

USDCHF Long SignalsTime Frame: 4H
Symbol: USDCHF
Bias: Long
The price projection of this pair for short term shows a positive long bias. Though the majority of indicators like moving averages and oscillators are showing short signals , the strengths of the signals are very weak. We can expect a long trade from the current context.

USDCHF looking to fin new lows...As I wrote about it earlier, I still think there is room for this one to fall further down.
Since yesterday we have broken a daily trendline and the price is still hovering below 0.9155 minor resistance line.
The dollar was weak across the board today, and I'm looking for this one to finally form new lower low levels.
Might be a risky trade here, but since it's the end of the year I'm only risking 0,25% on this one. We are already up 8% for the month, so I don't mind "playing" this one again.

USDCHF NeutralTime Frame: 4H
Symbol: USDCHF
Bias: Neutral
The instrument is still rangebound and does not have any possibility of moving strongly in any direction. It is not wise to trade during low volatility period. We strongly recommend to avoid trading some upcoming trading days as we are usure.

USDCHF still looks bearish to me...I'm still looking for this one to form lower low levels and my ultimate target would be the 0.88 level, but for now, I'm still looking for this one to test the trend line on the weekly chart. The dollar is still weak and while hyperinflation is starting to kick in slowly I think we are going to see the dollar index falling a bit more and that can help us to pull down this one as well.
My entry point is on the 1hr chart but my long-term technical analysis is based on the daily, weekly, and monthly. And as always RR is minimum 1:2

USDCHF NeutralTime Frame: 4H
Symbol: USDCHF
Bias: Neutral
The market conditions are not favorable due to lack of momentum and any directional bias. We still have to wait for some better days.

usdchf long entry good support in trendline and weakening in strength
expecting a long entry
entry long after breakout in trendline
open target 0.9200, 0.9300, 0.9400

USDCHF NeutralTime Frame: Daily
Symbol: USDCHF
Bias: Neutral
For USDchf we are neutral. We are not yet positive about significant price moves in any direction.

USDCHF NeutralTime Frame: 4H
Symbol: USDCHF
Bias: Neutral
We are neutral for USDCHF today. As we are not biased in any direction, we do not see any high probability set up. Need to wait more for a better signal.

USDCHF NeutralTime Frame: 4H
Symbol: USDCHF
Bias: Neutral
We do not see any signal today. We are neutral considering the price channel, oscillations and fundamental strengths.

USDCHF NeutralTime Frame: 4H
Symbol: USDCHF
Bias: Neutral
For this instrument we are neutral today. The price is going up and down and there is no anticipation for a sharp move and therefore we can stay neutral until a proper price channel is detected.

USDCHF Long SignalsTime Frame: 4H
Symbol: USDCHF
Bias: Long
This instrument is range bound and does not have any high probability for strong down move. We can expect a LONG position with tight risk and reward ratio.

USDCHF Long SignalsTime Frame: 4H
Symbol: USDCHF
Bias: Long
The price projection shows a light long bias ,but we are not very optimistic about any impulsive move. We must wait for a good time.

USDCHF Long SignalsTime Frame: Daily
Symbol: USDCHF
Bias: Long
For USDCHF our bias is to go long. We expect an upward move from the current price pattern. As the price is range bound ,there is equal scope to move in either direction . But considering the short term price actions , our goal is to go long.

USDCHFThe US dollar rallied against the Swiss franc last week but has given up the gains. Quite frankly, this is a market that I think will try to break down below the uptrend line, sending this market down to the 0.88 handle. If we do break this trend line that I have drawn on the chart, look out below. Otherwise, I would anticipate a lot of sideways nonsensical Brownian motion.

USDCHF NeutralTime Frame: 4H
Symbol: USDCHF
Bias: Neutral
There is no directional bias in this pair today. The lack of momentum due to seasonal influence can be a major factor behind this lackadaisical nature. We do not see any specific pattern here.

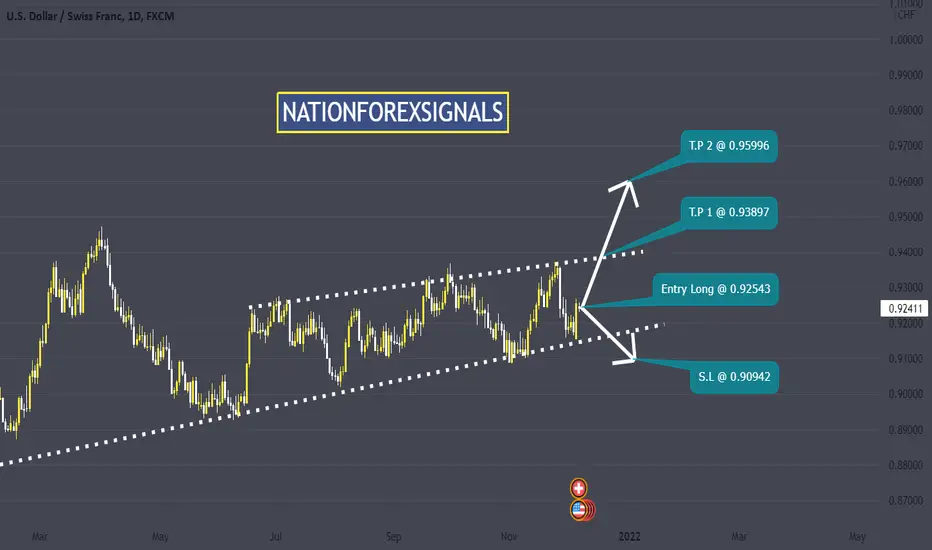
USDCHF Long SignalsTime Frame : 4H
Symbol: USDCHF
Bias: Long
The price action pattern of the USDCHF suggests a bullish trend. We are planning a buy trade in this situation. Considering the nearest support and resistance ,we are in favor of catapulting from a long bias.

USDCHF Long SignalsTime Frame: 4H
Symbol: USDCHF
Bias: Long
The price pattern of the instrument suggests a bullish pattern in the short term. Considering the support and resistance of the current price action, it is evident that there is a medium probability of upward move.

USDCHF Long SignalsTime Frame: Daily
Symbol: USDCHF
Bias: Long
USDCHF is in a rangebound situation. The pair is taking strength bit by bit to move up. The upward momentum indicates a strong dollar . As we see the pair is tilting up and gathering some strength to shake up the CHF ,our expectation to long the instrument will hold water. We are therefore projecting a long entry.
USDCHFHello. The price should rise to a minimum after the failure of the specified level to the previous ceiling

USDCHF Long SignalsTime Frame: Daily
Symbol: USDCHF
Bias: Long
It is a well recognized idea that history repeats itself. The idea is truly applicable here now. The current price pattern is suggesting a long trade which derive from a historical bias. If taken with caution, it may turn out to be a profitable high probability trade.
