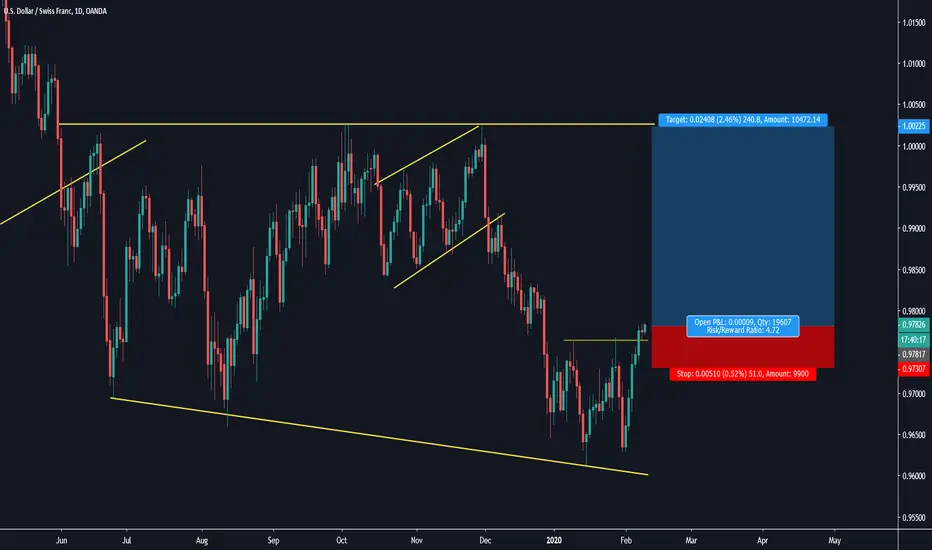
USDCHF Long IdeaAfter having accumulated on the 1D, probability of this just skyrocketing is extremely possible.
We'll be waiting for Price action confirmation before entry.
Usdchfforecast


USDCHF shortMaybe I jumped in a little early, bu I only took half size position as I used to. RR is okay, and I think we have a good chance to retest the lows and making new records. Also we are very near to a historical congestion zone on the monthly chart. If you check the price level 0.9603 we can see that from that area below many times price has tested those levels. It might just happen again.
Cheers everyone, and happy monday! :)

USDCHFThis pair is in the state of insecurity because he overall trend is bearish and bulls are very latent. But I tend to the bullish scenario so we'll see.


USDCHF long 0.96050The same thing could happen here .
Buy at 0.96050
SL 0.9568
TP1 0.9645 for an Intraday trade
TP2: leave it until the price reaches the lower trendline of the channel above.

#USDCHF, We are before a serious declineThe candles are located under the Ichimoku cloud.
The candles are placed below the average moving lines 100, 200.
The USDCHF broke the support line by $ 0.9656
All signs show a continuing weakening of the USDCHF so our recommendation will be Sell.
Target: 0.9340

USDCHF will shortA little but very clear 0-5 pattern for #USDCHF. Impulse down and channel up means short, form 0.97922

#USDCHF, Ideal time to buyThe USDCHF stopped exactly at the support line at 0.965 and the declines were stopped.
The USDCHF is on the rise.
The RSI has dropped to the 33-point area that it points to Oversold, and 2 times before the indicator has dropped to this area, the USDCHF has averaged 400 pips
Target: 0.9820

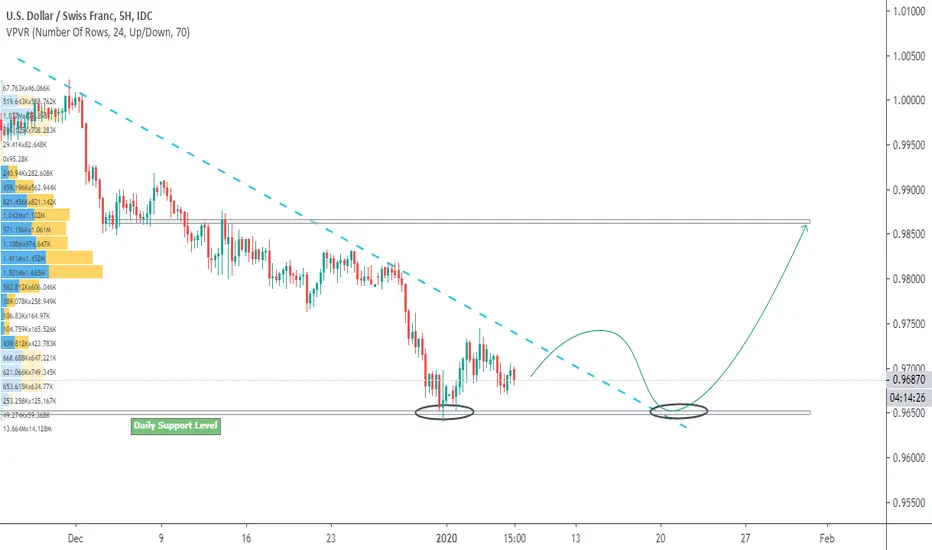
USDCHF forecast on H5, potential double bottom formation!!Plan : trendline breakout --> wait for prices to bounce off trendline support --> wait for the rejection candle pattern to form e.g. bullish engulfing , pinbar etc --> BUY
**Disclaimer** the content on this analysis is subject to change at any time without notice, and is provided for the sole purpose of assisting traders to make independent investment decisions.
Traders!! if you like my ideas and do take the same trade like i do, please write it in comment so we can manage the trade together.
_____________________________________________________________________________________________________________________
Thank you for your support ;)
GWBFX
USDCHF forecast on H5Note : wait for prices to bounce off horizontal key level support --> wait for the rejection candle pattern to form e.g. bullish engulfing , pinbar etc --> BUY
**Disclaimer** the content on this analysis is subject to change at any time without notice, and is provided for the sole purpose of assisting traders to make independent investment decisions.
Traders!! if you like my ideas and do take the same trade like i do, please write it in comment so we can manage the trade together.
_____________________________________________________________________________________________________________________
Thank you for your support ;)
GWBFX

USDCHF BUY SETUP usdchf price make a 3rd touch of the lower side of a diagonal pattern. Price is about to strat an upside move.
_________________________________________________________________________________________________________________________________________
Traders! if you like my ideas and do take the same trade, please write it in comment so we can manage the trade together.
_________________________________________________________________________________________________________________________________________
Disclaimer : The content on this analysis is subject to change at any time without notice, and is provided for the sole purpose of assisting traders to make independent investment decisions.
_________________________________________________________________________________________________________________________________________
Thank you for your support!

USDCHF POTENTIAL BUY SETUPPotential buy setup about usdchf. I will update following this analysis , so follow to get the notifications of potential trades entries :)

USDCHF SHORT IDEAOverall this pair I believe still has further more downside potential. Now that we’ve rejected some key levels & broken trendline/structure, this makes my bias even stronger for sells on this pair.
After such a strong impulse move down. Let’s wait for price to retrace to the 50/61.8 fib level to get a retest of That broken trend-line before considering shorting this pair.
Or alternatively wait for price to break daily resistance level and grab a entry on the retest of that level for a bit safer entry.


USDCHF sell on H5 trade update !!Note : if you followed my previous analysis you would have profited now (link below), make sure you use SL breakeven when your profit reaches +1R ;) enjoy
**Disclaimer** the content on this analysis is subject to change at any time without notice, and is provided for the sole purpose of assisting traders to make independent investment decisions.
Traders!! if you like my ideas and do take the same trade like i do, please write it in comment so we can manage the trade together.
_____________________________________________________________________________________________________________________
Thank you for your support ;)
GWBFX


USD/CHF: DAy-Swingtrade-OpportunityHey tradomaniacs,
welcome to another free signal!
Important: After a break below the trendline we`ve been retesting it again and jreected right at the 50 EMA and trendline.
Waiting for the market to break below support before I sell.
-----------------------------
Type: Day-Swingtrade
Market Sell: 0,98960
Stop-Loss: 0,99295
Target 1: 0,98640
Target 2: 0,98450
Target 3: 0,98100
Stop-Loss: 33,5 pips
Risk: 1-2%
Risk-Reward: 2,64
-----------------------------
LEAVE A LIKE AND A COMMENT - I appreciate every support! =)
Peace and good trades
Irasor
Wanna see more? Don`t forget to follow me.
Any questions? PM me. :-)

#USDCHF Are we ahead of sharp increases?As you can see in the graph above, the usdchf broke the resistance line at $ 0.9987, the ideal is more serious than breaking and moving away from the area but also a situation like that produces a buy signal.
We have the beginning of a green Ichimoku cloud that usually appears before the ascent begins.
Target: 1.045
(Because of our proximity to the resistance line if the usdchf returns below the resistance line, see the above signal as canceled)

USDCHF approaching resistance, look out for potential reversal!
USDCHF is approaching its resistance at 0.99988 where it is could reverse down to its support at 0.99350.
Trading CFDs on margin carries high risk.
Losses can exceed the initial investment so please ensure you fully
understand the risks.

#USDCHF, Will the increases continue?Great time to sell as long as resistance at 0.9985 hasn't broken.
According to the Stochastic we have reached a very high level, so it is unlikely to be broken.
We have a beginning of a red Ichimoku cloud that starts what can announce the beginning of a downtrend.
Target: 0.9870

USD/CHF SHORT TERM BullishExpecting USD/CHF to be bullish short term. Expecting price to hit upper trendline at 0.99878.
Focus Time Frame: 4H/1H
Market Condition
1D Short Term: Uptrend
1D Long Term: Downtrend
