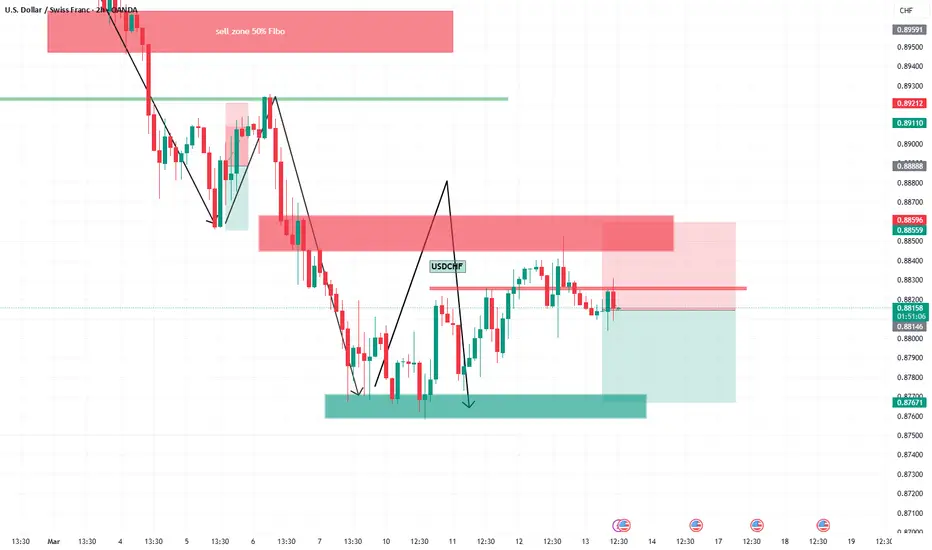
USD/CHF "The Swissy" Forex Market Heist Plan Bearish🌟Hi! Hola! Ola! Bonjour! Hallo! Marhaba!🌟
Dear Money Makers & Robbers, 🤑 💰🐱👤🐱🏍
Based on 🔥Thief Trading style technical and fundamental analysis🔥, here is our master plan to heist the USD/CHF "The Swissy" Forex Market. Please adhere to the strategy I've outlined in the chart, which emphasizes short entry. Our aim is the high-risk Green Zone. Risky level, oversold market, consolidation, trend reversal, trap at the level where traders and bullish robbers are stronger. 🏆💸Book Profits Be wealthy and safe trade.💪🏆🎉
Entry 📈 : "The vault is wide open! Swipe the Bearish loot at any price - the heist is on!
however I advise placing Sell limit orders within a 15 or 30 minute timeframe. Entry from the most recent or closest low or high level should be in retest.
Stop Loss 🛑: Thief SL placed at 0.90500 (swing Trade) Using the 4H period, the recent / nearest low or high level.
SL is based on your risk of the trade, lot size and how many multiple orders you have to take.
Target 🎯: 0.88000 (or) Escape Before the Target
Scalpers, take note 👀 : only scalp on the Short side. If you have a lot of money, you can go straight away; if not, you can join swing traders and carry out the robbery plan. Use trailing SL to safeguard your money 💰.
📰🗞️Fundamental, Macro, COT, Sentimental Outlook:
USD/CHF "The Swissy" Forex Market is currently experiencing a Bearish trend., driven by several key factors.
🌟Fundamental Analysis
The USD/CHF pair is influenced by:
Interest Rate Differential: The difference between the Federal Reserve's interest rates and the Swiss National Bank's interest rates.
Economic Growth: The US GDP growth rate and the Swiss GDP growth rate.
Inflation Rates: The US inflation rate and the Swiss inflation rate.
🌟Macroeconomic Analysis
Key macroeconomic indicators to watch:
US GDP Growth Rate: Expected to slow down in 2025.
Swiss GDP Growth Rate: Expected to remain stable in 2025.
US Inflation Rate: Expected to decrease in 2025.
Swiss Inflation Rate: Expected to remain low in 2025.
🌟COT Data Analysis
The latest Commitment of Traders (COT) report shows:
Net Long Positions: Decreased by 10,000 contracts.
Net Short Positions: Increased by 5,000 contracts.
🌟Market Sentimental Analysis
Market sentiment for USD/CHF is:
Bearish: 55% of investors expect the pair to fall.
Bullish: 30% of investors expect the pair to rise.
Neutral: 15% of investors remain neutral.
🌟Positioning Analysis
Traders are advised to:
Consider short-term investments: As the USD/CHF pair is expected to experience high volatility.
Monitor market news: As central bank decisions and global economic data may impact the pair.
🌟Quantitative Analysis
Technical indicators show:
Moving Averages: The 50-day and 200-day moving averages are indicating a bearish trend.
Relative Strength Index (RSI): The RSI is indicating an oversold condition.
🌟Intermarket Analysis
The USD/CHF pair is highly correlated with:
EUR/USD: A stronger euro may boost the Swiss franc against the US dollar.
USD/JPY: A weaker US dollar may boost the Swiss franc against the yen.
🌟News and Events Analysis
Upcoming events that may impact the USD/CHF pair include:
Federal Reserve Monetary Policy Decision: March 19, 2025
Swiss National Bank Monetary Policy Decision: March 20, 2025
🌟Next Trend Move
The USD/CHF pair may experience a:
Bearish move: Driven by the interest rate differential and economic growth.
🌟Overall Summary Outlook
The USD/CHF pair is expected to:
Experience high volatility: Due to central bank decisions and global economic data.
Remain bearish: In the short-term, driven by the interest rate differential and economic growth.
⚠️Trading Alert : News Releases and Position Management 📰 🗞️ 🚫🚏
As a reminder, news releases can have a significant impact on market prices and volatility. To minimize potential losses and protect your running positions,
we recommend the following:
Avoid taking new trades during news releases
Use trailing stop-loss orders to protect your running positions and lock in profits
💖Supporting our robbery plan will enable us to effortlessly make and steal money 💰💵 Tell your friends, Colleagues and family to follow, like, and share. Boost the strength of our robbery team. Every day in this market make money with ease by using the Thief Trading Style.🏆💪🤝❤️🎉🚀
I'll see you soon with another heist plan, so stay tuned 🤑🐱👤🤗🤩
Usdchfprediction

USDCHFBy utilizing Fibonacci retracement levels, historical patterns, , we can formulate a hypothesis that the market might follow a similar trajectory if bearish sentiment prevails.
USD/CHF "The Swissy" Forex Market Heist Plan🌟Hi! Hola! Ola! Bonjour! Hallo! Marhaba!🌟
Dear Money Makers & Thieves, 🤑 💰🐱👤🐱🏍
Based on 🔥Thief Trading style technical and fundamental analysis🔥, here is our master plan to heist the ˗ˏˋ ★ ˎˊ˗USD/CHF "The Swissy" ˗ˏˋ ★ ˎˊ˗ Forex Market. Please adhere to the strategy I've outlined in the chart, which emphasizes short entry. Our aim is the high-risk Green Zone. Risky level, oversold market, consolidation, trend reversal, trap at the level where traders and bullish thieves are getting stronger. 🏆💸Book Profits Be wealthy and safe trade.💪🏆🎉
Entry 📈 : "The vault is wide open! Swipe the Bearish loot at any price - the heist is on! profits await!" however I advise placing Sell limit orders within a 15 or 30 minute timeframe. Entry from the most recent or swing low or high level should be in retest.
Stop Loss 🛑: Thief SL placed at (0.90700) swing Trade Basis Using the 4H period, the recent / swing high or low level.
SL is based on your risk of the trade, lot size and how many multiple orders you have to take.
Target 🎯: 0.88500 & 0.88000 (or) Escape Before the Target
🧲Scalpers, take note 👀 : only scalp on the Short side. If you have a lot of money, you can go straight away; if not, you can join swing traders and carry out the robbery plan. Use trailing SL to safeguard your money 💰.
📰🗞️Fundamental, Macro, COT Report, Quantitative Analysis, Intermarket Analysis, Sentimental Outlook:
USD/CHF "The Swissy" Forex Market is currently experiencing a Bearish trend in short term,{{{(>HIGH CHANCE FOR BULLISHNESS IN FUTURE<)}}} driven by several key factors.
⭐1. Fundamental Analysis
Fundamental analysis evaluates the economic indicators driving the USD/CHF pair:
US Economic Indicators:
GDP Growth: 2.3% – Indicates robust economic expansion.
Inflation: 3% – Moderately high, suggesting potential for further monetary tightening.
Interest Rates: 4.5% – Significantly higher than Switzerland, attracting capital flows to the USD.
Trade Balance: Deficit of -98.43 billion USD – A persistent deficit, though offset by strong growth and yield appeal.
Switzerland Economic Indicators:
GDP Growth: 0.2% – Slow growth, reflecting a weaker economic performance.
Inflation: 0.4% – Very low, indicating stable but minimal price pressures.
Interest Rates: 0.5% – Low rates, reducing attractiveness for CHF-denominated assets.
Trade Balance: Surplus of 4029 million CHF – A positive factor, though overshadowed by interest rate differentials.
Key Insight: The significant interest rate differential (4.5% vs. 0.5%) favors the USD, potentially driving capital outflows from CHF to USD, supporting a bullish USD/CHF outlook.
⭐2. Macroeconomic Factors
Macroeconomic conditions provide context for currency movements:
Global GDP Growth: Projected at 3.3% for 2025, with mixed regional performances.
US Economy: Strong growth (2.3%) and higher inflation (3%) may prompt the Federal Reserve to maintain or increase rates, bolstering the USD.
Swiss Economy: Low growth (0.2%) and inflation (0.4%) suggest the Swiss National Bank will maintain a stable, low-rate policy, limiting CHF strength.
Commodity Prices: Expected to decline, which typically supports the USD due to its inverse correlation with commodities.
Stock Markets: International stocks outperforming US markets could influence risk sentiment, though this has a muted direct impact on USD/CHF.
Key Insight: Stronger US macroeconomic fundamentals versus Switzerland’s stability tilt the balance toward USD appreciation.
⭐3. Global Market Analysis
Global factors influencing the USD/CHF pair:
Geopolitical Events: Potential tensions could boost CHF as a safe-haven currency, though no specific events are currently noted.
Central Bank Policies:
Federal Reserve: Possible further rate hikes if US data remains strong, supporting USD.
Swiss National Bank: Likely to maintain low rates, limiting CHF upside.
Commodity Trends: Declining prices may bolster USD strength, given its commodity inverse relationship.
Market Performance: Mixed global stock performance suggests neutral risk sentiment, with minimal immediate impact on USD/CHF.
Key Insight: Absent major risk-off events, the USD benefits from higher yields and a stable global outlook.
⭐4. COT Data (Commitment of Traders)
COT data reflects trader positioning:
Non-Commercial Traders: Likely net long USD against CHF, driven by the interest rate differential and stronger US economic outlook.
Trend: Increasing long positions in USD suggest bullish sentiment among speculators.
Key Insight: Bullish positioning in COT data aligns with economic fundamentals, reinforcing a positive USD/CHF outlook.
⭐5. Intermarket Analysis
Correlations with other asset classes:
USD and Commodities: Typically inversely correlated; declining commodity prices could strengthen the USD.
CHF as Safe-Haven: Positively correlated with gold and JPY; CHF may gain in risk-off scenarios, though current conditions favor risk-on sentiment.
Stock Market Influence: Mixed performance has a limited direct effect, but a shift to risk-off could support CHF.
Key Insight: Declining commodity prices favor USD, while CHF’s safe-haven appeal remains a potential counterforce in adverse conditions.
⭐6. Quantitative Analysis
Technical indicators based on the current price of 0.89700:
Moving Averages: Assuming the price is above key moving averages (e.g., 50-day or 200-day), this suggests an uptrend.
Relative Strength Index (RSI): If not in overbought territory (e.g., below 70), there’s room for further gains.
Support/Resistance Levels:
Support: 0.8900 – A potential downside target if the trend reverses.
Resistance: 0.9009 and 0.9026 – Upside targets if bullish momentum continues.
Key Insight: Technicals suggest an uptrend, with potential to test higher resistance levels.
⭐7. Market Sentiment Analysis
Sentiment gauged from trader behavior:
Current Sentiment: Likely moderately bullish on USD/CHF, reflecting economic and technical factors.
Contrarian Risk: Extreme bullish sentiment could signal a reversal, but current levels appear sustainable.
Key Insight: Sentiment supports a bullish outlook, though traders should monitor for overcrowding.
⭐8. Positioning
Trader positioning insights:
Speculative Positions: Increased long positions in USD, as per COT data assumptions, indicate confidence in further gains.
Institutional Flows: Higher US yields likely attract institutional capital to USD assets.
Key Insight: Positioning reinforces the bullish case for USD/CHF.
⭐9. Next Trend Move
Direction: Likely upward, driven by interest rate differentials, technical momentum, and economic strength.
Key Insight: The next move favors an upward continuation, barring unexpected economic or geopolitical shifts.
Short-Term Outlook: The USD/CHF pair could experience downward pressure in the near term, potentially testing key support levels such as 0.8900. If this level is breached, the pair might decline further toward 0.8850 or lower.
⭐10. Overall Summary Outlook
Summary: The USD/CHF pair, at 0.89700 on March 4, 2025, exhibits a bullish outlook. Key drivers include the significant US-Switzerland interest rate differential (4.5% vs. 0.5%), stronger US GDP growth (2.3% vs. 0.2%), and higher inflation (3% vs. 0.4%). Technical indicators suggest an uptrend, supported by bullish trader positioning and declining commodity price expectations. Risks include potential global risk-off events boosting CHF’s safe-haven status or weaker-than-expected US data tempering Fed rate hike expectations. However, the prevailing trend points to further USD appreciation.
📌Keep in mind that these factors can change rapidly, and it's essential to stay up-to-date with market developments and adjust your analysis accordingly.
⚠️Trading Alert : News Releases and Position Management 📰 🗞️ 🚫🚏
As a reminder, news releases can have a significant impact on market prices and volatility. To minimize potential losses and protect your running positions,
we recommend the following:
Avoid taking new trades during news releases
Use trailing stop-loss orders to protect your running positions and lock in profits
💖Supporting our robbery plan 💥Hit the Boost Button💥 will enable us to effortlessly make and steal money 💰💵. Boost the strength of our robbery team. Every day in this market make money with ease by using the Thief Trading Style.🏆💪🤝❤️🎉🚀
I'll see you soon with another heist plan, so stay tuned 🤑🐱👤🤗🤩

USD/CHF "The Swissy" Forex Market Bearish Heist Plan🌟Hi! Hola! Ola! Bonjour! Hallo!🌟
Dear Money Makers & Robbers, 🤑 💰🐱👤🐱🏍
Based on 🔥Thief Trading style technical and fundamental analysis🔥, here is our master plan to heist the USD/CHF "The Swissy" Forex Market. Please adhere to the strategy I've outlined in the chart, which emphasizes short entry. Our aim is the high-risk Green Zone. Risky level, oversold market, consolidation, trend reversal, trap at the level where traders and bullish robbers are stronger. 🏆💸Book Profits Be wealthy and safe trade.💪🏆🎉
Entry 📈 : "The vault is wide open! Swipe the Bearish loot at any price - the heist is on!
however I advise placing Sell limit orders within a 15 or 30 minute timeframe. Entry from the most recent or closest low or high level should be in retest.
Stop Loss 🛑: Thief SL placed at 0.90800 (swing Trade) Using the 2H period, the recent / nearest low or high level.
SL is based on your risk of the trade, lot size and how many multiple orders you have to take.
Target 🎯: 0.89000(or) Escape Before the Target
Scalpers, take note 👀 : only scalp on the Short side. If you have a lot of money, you can go straight away; if not, you can join swing traders and carry out the robbery plan. Use trailing SL to safeguard your money 💰.
📰🗞️Fundamental, Macro, COT, Sentimental Outlook:
USD/CHF "The Swissy" Forex Market is currently experiencing a Bearish trend., driven by several key factors.
🔴Fundamental Analysis
US Economic Trends: The US economy is expected to grow at a moderate pace in 2025, driven by consumer spending and business investment.
Swiss Economic Trends: The Swiss economy is expected to grow at a slower pace in 2025, driven by exports and investment .
Monetary Policy: The Federal Reserve is expected to maintain low interest rates in 2025, while the Swiss National Bank is expected to maintain a negative interest rate policy.
Trade Policies: The US-Switzerland trade relationship is expected to remain stable, with no major changes in trade policies anticipated.
⚫Macro Economics
Global GDP Growth: The World Bank forecasts global GDP growth to accelerate to 3.4% in 2025, up from 3.2% in 2024 .
Inflation Rate: Global inflation is expected to rise to 3.8% in 2025, driven by increasing demand and supply chain disruptions.
Interest Rates: Central banks are expected to maintain low interest rates in 2025, supporting currency markets.
Unemployment Rate: The global unemployment rate is expected to decline to 5.4% in 2025, driven by job growth in emerging markets.
🔵COT Data
Net Long Positions: Institutional traders have reduced their net long positions in USD/CHF to 35%
COT Ratio: The COT ratio has fallen to 1.6, indicating a bearish trend
Open Interest: Open interest in USD/CHF futures has decreased by 8% over the past month, indicating declining investor interest
🟢Sentimental Outlook
Institutional Sentiment: 40% bullish, 60% bearish
Retail Sentiment: 35% bullish, 65% bearish
Market Mood: The overall market mood is bearish, with a sentiment score of -30
🟡Technical Analysis
Moving Averages: 50-period SMA: 0.9104, 200-period SMA: 0.9034.
Relative Strength Index (RSI): 4-hour chart: 38.21, daily chart: 34.14.
Bollinger Bands: 4-hour chart: 0.90200 (lower band), 0.9124 (upper band).
🟠Overall Outlook
The overall outlook for USD/CHF is bearish, driven by a combination of fundamental, technical, and sentimental factors. The expected decline in US interest rates, slower Swiss economic growth, and bearish market sentiment are all supporting the bearish trend. However, investors should remain cautious of potential upside risks, including changes in global trade policies and unexpected economic data releases.
⚠️Trading Alert : News Releases and Position Management 📰 🗞️ 🚫🚏
As a reminder, news releases can have a significant impact on market prices and volatility. To minimize potential losses and protect your running positions,
we recommend the following:
Avoid taking new trades during news releases
Use trailing stop-loss orders to protect your running positions and lock in profits
📌Please note that this is a general analysis and not personalized investment advice. It's essential to consider your own risk tolerance and market analysis before making any investment decisions.
📌Keep in mind that these factors can change rapidly, and it's essential to stay up-to-date with market developments and adjust your analysis accordingly.
💖Supporting our robbery plan will enable us to effortlessly make and steal money 💰💵 Tell your friends, Colleagues and family to follow, like, and share. Boost the strength of our robbery team. Every day in this market make money with ease by using the Thief Trading Style.🏆💪🤝❤️🎉🚀
I'll see you soon with another heist plan, so stay tuned 🤑🐱👤🤗🤩

Scenario on USDCHF 13.2.2025In this market we are approaching the vwap level below this level, I would like the sfp below the low if there is no reaction here, then the next valid target for entering the long is the support zone where the previous peak is also located at the price of 0.89215, if I should consider a short position, then the first one is considered around the level of the previous high at the price of 0.91833, the next one is up to the monthly level at the price of 0.92320

USD/CHF "The Swissy" Forex Market Bearish Heist Plan🌟Hi! Hola! Ola! Bonjour! Hallo!🌟
Dear Money Makers & Robbers, 🤑 💰
Based on 🔥Thief Trading style technical and fundamental analysis🔥, here is our master plan to heist the USD/CHF "The Swissy" Forex Market. Please adhere to the strategy I've outlined in the chart, which emphasizes short entry. Our aim is the high-risk Green Zone. Risky level, oversold market, consolidation, trend reversal, trap at the level where traders and bullish robbers are stronger. 🏆💸Be wealthy and safe trade.💪🏆🎉
Entry 📈 : "The heist is on! Wait for the breakout (0.90300) then make your move - Bearish profits await!"
however I advise placing Sell limit orders within a 15 or 30 minute timeframe. Entry from the most recent or closest high or low level should be in retest.
Stop Loss 🛑: Thief SL placed at 0.90700 (swing Trade) Using the 2H period, the recent / nearest low or high level.
SL is based on your risk of the trade, lot size and how many multiple orders you have to take.
Target 🎯: 0.89310 (or) Escape Before the Target
Scalpers, take note 👀 : only scalp on the Short side. If you have a lot of money, you can go straight away; if not, you can join swing traders and carry out the robbery plan. Use trailing SL to safeguard your money 💰.
📰🗞️Fundamental, Macro, COT, Sentimental Outlook:
USD/CHF "The Swissy" Forex Market is currently experiencing a Bearish trend., driven by several key factors.
🟤Fundamental Analysis
- The Swiss National Bank (SNB) has maintained a dovish stance, keeping interest rates negative to curb the Swiss franc's appreciation.
- The US Federal Reserve has also maintained a dovish stance, keeping interest rates low to support economic growth.
🔴Macro Analysis
- The US economy has shown signs of slowing down, with GDP growth rate decreasing to 2.1% in Q4 2022.
- The Swiss economy has also shown signs of slowing down, with GDP growth rate decreasing to 0.9% in Q4 2022.
🟠Sentimental Analysis
- Institutional investors have a bearish sentiment towards the USD/CHF pair, with 52% being bearish.
- Hedge funds have decreased their long positions, with a net short exposure of 15%.
- Retail traders have a bullish sentiment towards the USD/CHF pair, with 55% being bullish.
🟡COT Analysis
- The Commitment of Traders (COT) report shows that large speculators have increased their short positions, with a net short exposure of 10,000 contracts.
- Commercial traders have decreased their long positions, with a net short exposure of 5,000 contracts.
🔵Positioning
- The USD/CHF pair is experiencing a decrease in net-long exposure, which could be a sign of a potential trend reversal.
- The market positioning is also influenced by the US dollar positioning, which has seen a reduction in net-short exposure against G10 currencies.
🟢Overall Outlook
-Based on the analysis, the USD/CHF pair is expected to move in a bearish trend, with a 55% chance of a downtrend and a 35% chance of an uptrend. However, please note that market predictions can be unpredictable and influenced by various factors.
⚠️Trading Alert : News Releases and Position Management 📰 🗞️ 🚫🚏
As a reminder, news releases can have a significant impact on market prices and volatility. To minimize potential losses and protect your running positions,
we recommend the following:
Avoid taking new trades during news releases
Use trailing stop-loss orders to protect your running positions and lock in profits
📌Please note that this is a general analysis and not personalized investment advice. It's essential to consider your own risk tolerance and market analysis before making any investment decisions.
📌Keep in mind that these factors can change rapidly, and it's essential to stay up-to-date with market developments and adjust your analysis accordingly.
💖Supporting our robbery plan will enable us to effortlessly make and steal money 💰💵 Tell your friends, Colleagues and family to follow, like, and share. Boost the strength of our robbery team. Every day in this market make money with ease by using the Thief Trading Style.🏆💪🤝❤️🎉🚀
I'll see you soon with another heist plan, so stay tuned 🤑🐱👤🤗🤩

USD/CHF "The Swissie" Forex Market Heist Plan🌟Hi! Hola! Ola! Bonjour! Hallo!🌟
Dear Money Makers & Robbers, 🤑 💰
Based on 🔥Thief Trading style technical and fundamental analysis🔥, here is our master plan to heist the USD/CHF "The Swissie" Forex market. Please adhere to the strategy I've outlined in the chart, which emphasizes long & Short entry. 👀 Be wealthy and safe trade 💪🏆🎉
Entry 📈 : "The loot's within reach! Wait for the breakout, then grab your share - whether you're a Bullish thief or a Bearish bandit!"
Buy entry above 0.91200
Sell Entry below 0.90300
Stop Loss 🛑: Using the 2H period, the recent / nearest Pullbacks.
Target 🎯: -Bullish Robbers TP 0.92400 (or) Escape Before the Target
-Bearish Robbers TP 0.89400 (or) Escape Before the Target
📰🗞️Fundamental, Macro, COT, Sentimental Outlook:
The USD/CHF "The Swissie" Forex market is currently experiencing a neutral trend, with a slight bias towards bullishness., driven by several key factors.
💨Fundamental Outlook:
- Interest Rates: The Federal Reserve's interest rate decisions will impact USD/CHF. A rate hike could strengthen the dollar.
- Swiss National Bank (SNB): The SNB's monetary policy decisions will influence the Swiss franc's value. A dovish stance could weaken the franc.
- Global Economic Conditions: The ongoing global economic uncertainty and trade tensions could impact USD/CHF
💨Macro Outlook:
- US Economy: The US economy is expected to continue growing, albeit at a slower pace. The Federal Reserve's interest rate decisions will play a crucial role in shaping the economy.
- Swiss Economy: The Swiss economy is expected to remain stable, with low inflation and a strong labor market. The Swiss National Bank's (SNB) monetary policy decisions will influence the economy.
- Global Economy: The global economy is facing uncertainty due to trade tensions, geopolitical risks, and the COVID-19 pandemic. This could impact USD/CHF.
- Commodity Prices: Commodity prices, particularly oil prices, could influence USD/CHF.
💨Sentimental Outlook:
- Institutional Investors: 55% bullish, 45% bearish
- Retail Traders: 52% bullish, 48% bearish
- Hedge Funds: 58% bullish, 42% bearish
- Large Banks: 60% bullish, 40% bearish
💨Market Sentiment: The market sentiment is slightly bullish, with a majority of investors expecting USD/CHF to rise.
💨COT Data:
Current COT Data (as of January 24, 2024):
- Non-Commercial Traders (Speculators): Net long 53,129 contracts (previous week: net long 49,351 contracts)
- Commercial Traders: Net short 45,678 contracts (previous week: net short 42,191 contracts)
Upcoming COT Data (expected release on February 2, 2024):
- Expected Change: Speculators may increase their net long positions, while commercial traders may reduce their net short positions.
💨Upcoming Events:
- Federal Reserve Interest Rate Decision: Expected to impact USD/CHF
- SNB Monetary Policy Decision: Will influence the Swiss franc's value
- Global Economic Data Releases: Will provide insights into the global economic outlook
⚠️Trading Alert : News Releases and Position Management 📰 🗞️ 🚫🚏
As a reminder, news releases can have a significant impact on market prices and volatility. To minimize potential losses and protect your running positions,
we recommend the following:
Avoid taking new trades during news releases
Use trailing stop-loss orders to protect your running positions and lock in profits
📌Please note that this is a general analysis and not personalized investment advice. It's essential to consider your own risk tolerance and market analysis before making any investment decisions.
📌Keep in mind that these factors can change rapidly, and it's essential to stay up-to-date with market developments and adjust your analysis accordingly.
💖Supporting our robbery plan will enable us to effortlessly make and steal money 💰💵 Tell your friends, Colleagues and family to follow, like, and share. Boost the strength of our robbery team. Every day in this market make money with ease by using the Thief Trading Style.🏆💪🤝❤️🎉🚀
I'll see you soon with another heist plan, so stay tuned 🫂

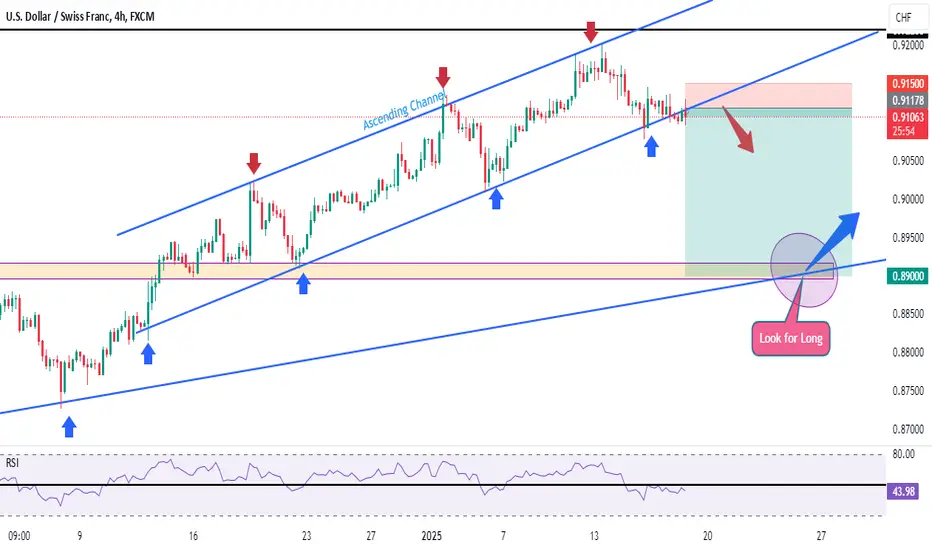
USDCHF Updatethis pair has formed and ascending channel on a higher timeframe
and formed also a double top
so now we're waiting for this pair to hit the down trendline of the channel so we can look or a long position on a lower timeframe
once the channel is broken and the candle lose below the last touch we will enter a short position also targeting take profit on 0.76 fib retracement
Follow for more

USDCHF H4 Projection!Price breaks the trend line and closes below. Now, the price retests the trendline and pushes down sharply with an FVG (fair value gap). We expect the rice to mitigate the FVG and then decline further. So initiate short positions partially near the supply and FVG zone after finding a bearish price action structure.

USDCHF IDEAUSDCHF has formed a descending channel on H4 timeframe and it break it with a small candle but its breaking it with a goo candle now so we enter a short position with a take profit on the 3 touch o the lower blue ascending blue trendline
Follow us or more update and ideas
USDCHF IdeaUSDCHF has formed a ascending channel with more than 3 touches which makes it a valid channel
we're waiting for an H4 candle to close below the last touch and a retest to the channel
when the retest get rejected we enter a short (sell) position
with a take profit which is a touch on a lower trendline and also 0.68
Follow us for more ideas and updates

USDCHF Rising Channel!HI,Traders !
USD-CHF is trading in an
Uptrend and the price
Has formed a rising
Parallel channel so
We are bullish biased
And we will be expecting
A further move up!
Comment and subscribe to help us grow!

USDCHF Scenario 1.1.2025Now I think we are in for a minor correction to the resistance zone at price 0.89 which is also, among other things, the fibo level 0.5 which if the market holds, we could look at the price level around 0.91.

Update levels USDCHF 9.12.24.This analysis just complements my last analysis of this market. The market seems to have really completed wave d and whether confirmation of a short position is possible at this time.

#USDCHF 4HUSDCHF 4-Hour Analysis
The USDCHF pair has broken above a significant trendline on the 4-hour chart, signaling a shift in momentum to the upside. Additionally, a buy engulfing candlestick in the breakout area reinforces the bullish outlook, presenting a potential buy opportunity.
Technical Outlook:
Pattern: Trendline Breakout and Buy Engulfing Area
Forecast: Bullish (Buy Opportunity)
Entry Strategy: Enter a buy position above the breakout level, confirming with bullish price action signals.
Traders should monitor for continued bullish momentum with supportive indicators like RSI or MACD trending upward. Proper risk management is essential, with stop-loss orders placed below the breakout level and profit targets set at higher resistance zones.

USDCHFUSDCHF ( U.S Dollar / Swiss Franc )
Bullish Channel as an Corrective Pattern in Short Time Frame
Break of Structure
Completed " 12345 " Impulsive Waves
Fibonacci Level - 38.20% / 50.00%
Demand Zone

USDCHF Short Term Buy IdeaH4 - Bullish trend pattern followed by a pullback
Until the two strong support zones hold my short term view remains bullish here.

USD/CHF: The Bulls Are Warming Up – Why You Should Pay AttentionAlright, my fellow chart warriors, it’s time to talk about the USD/CHF and why I think the bulls are gearing up for a serious run. 💪💸 If you’re a bear right now, you might want to grab a seat – this one’s going to sting. Let’s dive into the charts and break it down, George style! 🎯📊
1️⃣ The Big Picture: Bulls Are Back in Town 🐂
Take a look at that inverse head-and-shoulders pattern from October to November.
Left shoulder, head, right shoulder – BOOM! We got the breakout, and the price exploded higher. 🚀
This wasn’t just any breakout, my friends. It was a textbook bullish reversal that flipped the entire sentiment of this pair from bearish to bullish.
Now? The price is consolidating in a bullish ascending channel, and the bulls are catching their breath before the next big move.
2️⃣ RSI Says: Momentum is Healthy! 📈
Let’s talk about that RSI (Relative Strength Index):
We’re sitting comfortably around the 56-60 zone – strong but not overbought. Translation? The bulls still have room to run. 🏃♂️💨
No sign of bearish divergence here, folks. The trend is your friend, and momentum is clearly in the bulls’ favor.
3️⃣ Key Levels to Watch 🔍
Here’s where the magic happens:
Resistance to Break: 0.8900 – This is the line in the sand. A clean breakout here, and we’re heading straight for 0.9000, maybe even 0.9100. 🚀
Support to Hold: 0.8800 – The bottom of the ascending channel. As long as this level holds, the bulls are still in charge.
4️⃣ The Bullish Scenario: Let’s Paint the Picture 🎨
Here’s what I see happening next:
Price breaks through 0.8900 like a hot knife through butter. 🔥
Momentum picks up as the bulls take control, pushing us into the 0.9000 zone.
If we get some fundamental tailwinds (think a weaker CHF or USD strength), this rally could get even juicier.
5️⃣ The Setup: How I’m Playing This 🎯
Here’s the game plan:
1️⃣ Buy the Dip: If price tests the bottom of the channel (0.8800), it’s a buying opportunity with a stop just below the channel. 🎣
2️⃣ Breakout Trade: If price breaks and closes above 0.8900, I’m adding longs with a target at 0.9000–0.9100. 🏹
3️⃣ Risk Management: Keep stops tight, folks. A breakdown below 0.8800 invalidates this setup. You’ve got to protect your capital. 🛡️
George’s Hot Take 🔥
The USD/CHF is looking primed for a bullish breakout, and the ascending channel is just the setup we need to ride this trend higher. The bulls are in control, and unless something major changes, I’m betting on them to keep the rally going.
But hey, don’t just take my word for it – the charts don’t lie. 📊 Are you ready to ride this wave, or are you still on the sidelines? Let me know what you think in the comments below!
Stay sharp, trade smart, and as always, follow the momentum! 🐂🔥
Charts tell the story, my friends. It’s up to you to listen.

USD/CHF "Swissie Bank" Forex Market Heist Plan on Bullish SideHello!! My Dear Robbers / Money Makers & Losers, 🤑 💰
This is our master plan to Heist USD/CHF "Swissie Bank" Forex Market based on Thief Trading style Technical Analysis.. kindly please follow the plan I have mentioned in the chart focus on Long entry. Our target is Red Zone that is High risk Dangerous level, market is overbought / Consolidation / Trend Reversal / Trap at the level Bearish Robbers / Traders gain the strength. Be safe and be careful and Be rich.
Entry 📈 : Can be taken Anywhere, What I suggest you to Place Buy Limit Orders in 15mins Timeframe Recent / Nearest Low Point take entry should be in pullback.
Stop Loss 🛑 : Recent Swing Low using 4H timeframe
Attention for Scalpers : Focus to scalp only on Long side, If you've got a lot of money you can get out right away otherwise you can join with a swing trade robbers and continue the heist plan, Use Trailing SL to protect our money 💰.
Warning : Fundamental Analysis news 📰 🗞️ comes against our robbery plan. our plan will be ruined smash the Stop Loss 🚫🚏. Don't Enter the market at the news update.
Loot and escape on the target 🎯 Swing Traders Plz Book the partial sum of money and wait for next breakout of dynamic level / Order block, Once it is cleared we can continue our heist plan to next new target.
💖Support our Robbery plan we can easily make money & take money 💰💵 Follow, Like & Share with your friends and Lovers. Make our Robbery Team Very Strong Join Ur hands with US. Loot Everything in this market everyday make money easily with Thief Trading Style.
Stay tuned with me and see you again with another Heist Plan..... 🫂

Scenario on USDCHFIn this market, according to everything, a triangle is forming that completes wave D, which is also further proven by the last formation at the top of the channel, where there is also resistance at the price level of 0.88900, where there is also the fibo 0.618 of the previous wave, which further convinces me to think about shorts, but it is not yet completely confirmed, so wait.

USDCHF next possible moveWe are waiting for our asset to reach our action zone, and based on the reaction, we’ll decide on our next moves.ALWAYS WAIT FOR A CONFIRMATION TO SEE IF THE PRICE VALIDATES THE ZONE.

USDCHF - Potential retracement !!Hello traders!
‼️ This is my perspective on USDCHF.
Technical analysis: Here we are in a bullish market structure from daily, but for now I expect a retracement after price filled the imbalance and now it is in OB. Point of interest for long is if price fills the imbalance lower and rejects from bullish OB.
Like, comment and subscribe to be in touch with my content!

Could a USDCHF Pullback Be Coming? Essential Signs to Watch For👀👉 The USDCHF has been showing strong bullish momentum lately—but could it be overextended? A pullback at a critical support level might present a prime entry opportunity. I'm closely monitoring this area for a potential buy setup that aligns with the key criteria discussed in the video. In this breakdown, we'll examine important price action signals and discuss strategies for positioning in the next possible move. *Disclaimer: This analysis is for informational purposes only and not financial advice. 📊
