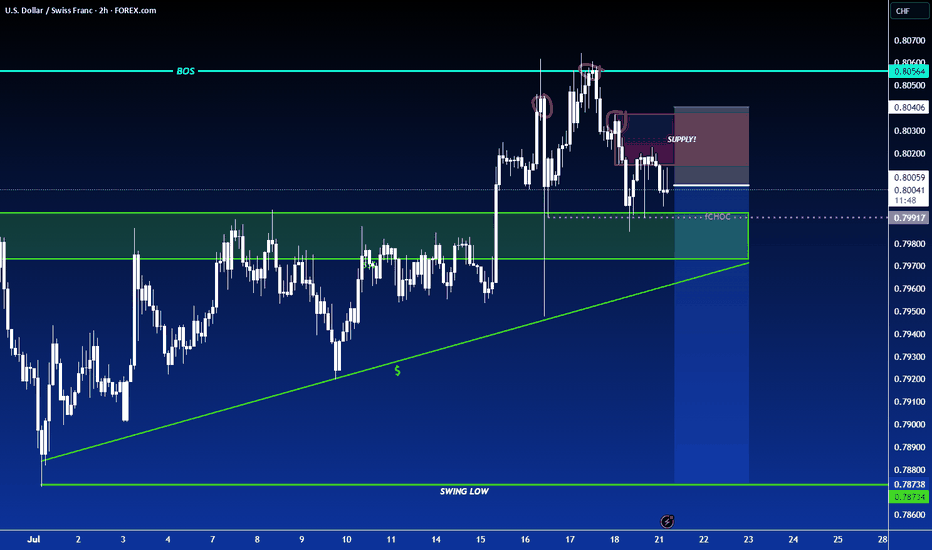
Is USDCHF Ready to Drop? Short Setup Explained📉 USDCHF Trade Idea Breakdown
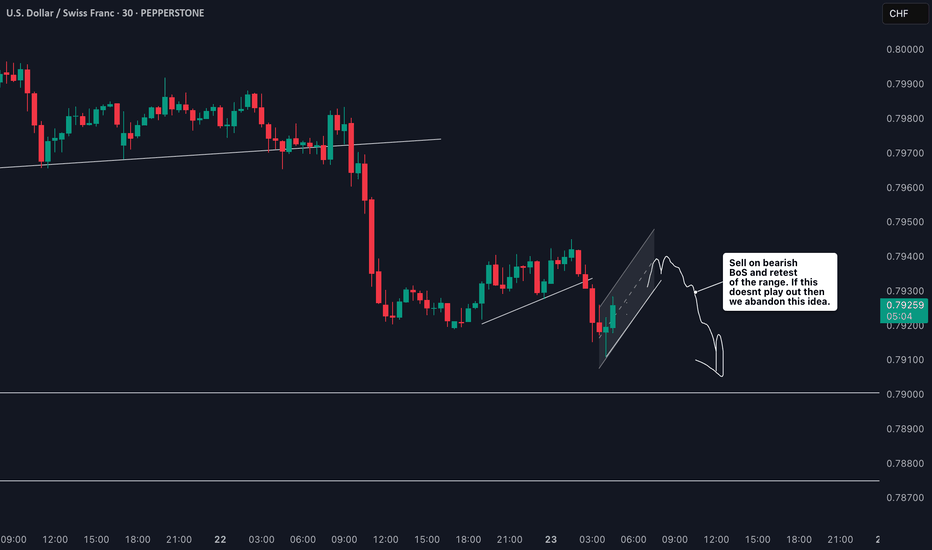
Taking a close look at USDCHF, we’re currently in a clear downtrend 🔻. Price is under pressure on the higher timeframes, but on the lower timeframes (15m & 30m), we’re seeing a pullback 🌀.
What I’m watching for now is a rejection at resistance 🔄 followed by a bearish break in market structure ⛔️. If that confirms, I’ll be looking to take a short entry with targets set at the two previous lows marked out in the video 🎯📉.
Stop loss placement would be just above the recent swing high for risk management 🛑.
As always — this is not financial advice ⚠️.
Usdchfsell
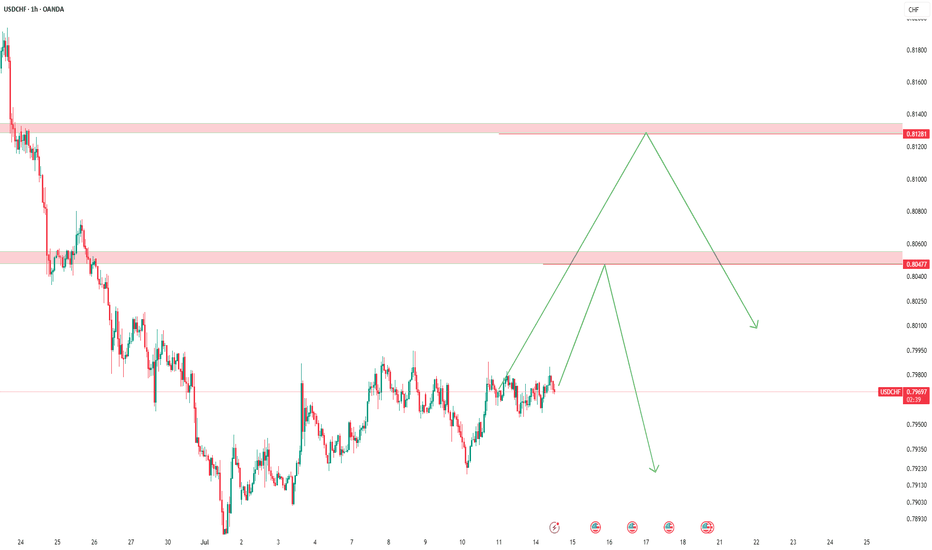
USDCHF – Two Levels, One PlanWe’re watching two key resistance zones for a potential short.
If the first level holds and gives a signal, we’ll short from there.
If that level breaks, we may switch to a short-term buy up to the next level.
Once price reaches the second resistance, we’ll be ready for another sell opportunity.
No predictions — just following the flow.
#USDCHF: Will USD Breakthrough The Strong Bearish Downtrend? The USDCHF currency pair has experienced significant volatility due to the ongoing trade dispute between the United States and China, which has led to a substantial decline in the DXY index. Consequently, CHF and JPY have emerged as the most stable currencies in the market.
Despite the USDCHF currency pair reversing its bullish trend, we anticipate a potential reversal back to a bearish position. We believe this reversal may be a temporary trap, and the currency pair is likely to regain its bullish position in the future.
There are two potential areas where the USDCHF currency pair could reverse from its current trend. The first area is relatively early, and if the USDCHF currency pair crosses a specific region, we may have a second safe option that could provide greater stability.
We extend our best wishes and best of luck in your trading endeavours. Your unwavering support is greatly appreciated.
If you wish to contribute, here are several ways you can assist us:
- Like our ideas
- Comment on our ideas
- Share our ideas
Team Setupsfx_🚀❤️
How to Trade USDCHF 's Downtrend with Precision📉 Market Breakdown: USDCHF Under Pressure
Currently keeping a close watch on USDCHF 💵🇨🇭 — the pair has been in a strong, sustained bearish trend 🔻, and the overall pressure remains clearly to the downside.
My bias is firmly bearish 📊, but I’m not rushing in. Instead, I’m patiently waiting for an optimal entry 🎯 — one that offers the right balance of confluence, structure, and reduced risk 🧠🛡️.
🎥 In today’s video, we dive into:
✅ Market structure
✅ Price action
✅ The prevailing trend
✅ Entry zones with minimized risk
I also walk you through my personal entry strategy and trading plan 📋, it's not just an idea drop.
📌 Disclaimer: This is not financial advice — the content is for educational purposes only.
USDCHF..SHORT📌 USDCHF – Multi-Scenario Setup
This pair has two key levels: one short-term, the other long-term.
If price reaches the first level and shows solid bearish reaction, I’ll enter a short.
If that level breaks and confirms, I’ll go long—but manage the long aggressively, since I’ll look to exit around the higher level.
If the price pushes beyond even the second zone, I’ll be ready to buy again.
❗️I’m never upset by a loss or a broken level.
The market leads—I follow.
Claiming “it must drop from here” or “it has to rise” is wishful thinking, not trading.
✅ Stay calm, stay flexible, and stay prepared for every scenario.
USD/CHF 4H Bearish Setup: FVG Rejection & EMA Resistance Strateg🔵 Chart Structure
🔻 Downtrend Identified
* Lower highs & lower lows forming.
* Resistance line sloping down 📉.
🧲 EMA 70 (0.82387)
* Acting as dynamic resistance 🔴.
* Price currently sitting just below it ⬇️.
💠 FVG (Fair Value Gap) — 0.82441 to 0.83097
* Price expected to fill the imbalance here.
* Confluence with resistance = 🔥 ideal sell zone.
🎯 Trade Plan (Short Setup)
🟦 Entry Point:
* 💥 0.82415
* Just under EMA + inside FVG zone.
🛑 Stop Loss:
* ❌ 0.83110
* Above FVG + above previous high = protected stop.
🎯 Take Profit:
* ✅ 0.80150
* Near prior demand zone + horizontal support.
* Target zone clearly marked in light blue 🧊.
⚖️ Risk-Reward Ratio
🎲 Estimated around 2.5:1 or better.
✅ High reward potential if resistance holds.
⚠️ Caution / Notes
🔎 Watch for bearish confirmation candles 🕯️ at entry zone.
📆 Be aware of economic news that could impact USD or CHF.
🧪 If price closes above 0.83110, setup becomes invalid ❌.
📌 Summary
Element Level Emoji
🔵 Entry 0.82415 💥
🛑 Stop Loss 0.83110 ❌
✅ Take Profit 0.80150 🎯
🔻 Trend Bias Bearish 📉
📐 Tools Used EMA, FVG, Resistance 📊
USD/CHF Short Trade Idea - UpdatedPrice capped beneath 100-day EMA; risk aversion + SNB rhetoric keep CHF firm; bearish momentum intact below 0.8200.
USD weakness persists triggered by fresh US tariff threats,
a deepening US-China trade rift, and US fiscal instability underpin
CHF demand.
Technically, strong bearish momentum remains below 0.8300.
Current trading around 0.8200 confirms downside bias.
USDCHF Analysis: Break & Retest or Mean Reversion?Hello traders!
USDCHF is offering two trading scenarios on the daily timeframe.
The first scenario suggests the pair may react bearishly from the resistance zone, setting up a break-and-retest opportunity that could drive price lower toward the 0.80001 area.
The second scenario anticipates a bounce toward the 0.89100 region, where a mean reversion setup may come into play (if sellers step in and price action confirms bearish intent near that resistance).
Discretionary Trading: Where Experience Becomes the Edge
Discretionary trading is all about making decisions based on what you see, what you feel, and what you've learned through experience. Unlike systematic strategies that rely on fixed rules or algorithms, discretionary traders use their judgment to read the market in real time. It's a skill that can't be rushed, because it's built on screen time, pattern recognition, and the ability to stay calm under pressure.
There's no shortcut here. You need to see enough market conditions, wins, and losses to build that intuition—the kind that tells you when to pull the trigger or sit on your hands. Charts might look the same, but context changes everything, and that's something only experience can teach you.
At the end of the day, discretionary trading is an art, refined over time, sharpened through mistakes, and driven by instinct. It's not for everyone, but for those who've put in the work, it can be a powerful way to trade.
USDCHF Discretionary Analysis: Bounce at 0.85Hello traders.
I'm anticipating the momentum on USDCHF to carry on. Got my eyes locked on the 0.85 area. It might turn into a strong bounce point. If the signs are there, I'm jumping in with a short.
Discretionary Trading: Where Experience Becomes the Edge
Discretionary trading is all about making decisions based on what you see, what you feel, and what you've learned through experience. Unlike systematic strategies that rely on fixed rules or algorithms, discretionary traders use their judgment to read the market in real time. It's a skill that can't be rushed, because it's built on screen time, pattern recognition, and the ability to stay calm under pressure.
There's no shortcut here. You need to see enough market conditions, wins, and losses to build that intuition—the kind that tells you when to pull the trigger or sit on your hands. Charts might look the same, but context changes everything, and that's something only experience can teach you.
At the end of the day, discretionary trading is an art, refined over time, sharpened through mistakes, and driven by instinct. It's not for everyone, but for those who've put in the work, it can be a powerful way to trade.
USDCHF Imbalance Zone Possible Set Up for Bearish ContinuationBased on the current analysis of USDCHF, there's a compelling bearish setup forming on the 4-hour timeframe. Let's dive into the details! 🔍
Fundamental Analysis 💹
USDCHF is currently under significant bearish pressure at 0.8655 📉. The Swiss Franc has been strengthening against the USD, likely due to its safe-haven status amid current market uncertainties. This fundamental backdrop supports our technical bearish bias! 🇨🇭
Technical Analysis on 4H Chart 📈
The price is trading below both the 20 EMA (0.8677) and 50 EMA (0.8715) 📊, confirming the bearish momentum. This bearish EMA alignment creates a perfect environment for short entries! ⚡
Imbalance Zone Opportunity 🎯
There's a clear imbalance zone between 0.8664 - 0.8674 that hasn't been properly retested yet. This zone represents an area where price moved quickly, leaving behind unfilled orders. If price retraces into this zone, it could act as a magnet for sellers! 💰
The Perfect Setup 🔄
Wait for price to retrace into the imbalance zone (0.8664 - 0.8674) ⬆️
Look for bearish price action confirmation (engulfing candles, rejection wicks) 🕯️
Confirm a bearish structure break after the retracement 📉
Enter short position with stops above the recent swing high (~0.8680) 🚫
Target the equilibrium level (0.8661) as first take-profit 🎯
Extended targets at previous lows or 1:2 risk-reward ratio 💸
Risk Management ⚠️
Keep your stop loss tight above the imbalance zone
Consider scaling out at key support levels
Total risk should not exceed 1-2% of your trading capital 💵
This setup offers an excellent risk-to-reward opportunity if executed properly! The bearish momentum is strong, with both EMAs confirming the downtrend. The imbalance zone provides a high-probability entry point for shorts! 🔥
Possible Bearish Market on USDCHFUSDCHF has been moving between support and resistance levels thereby creating a sideways movement on daily and weekly timeframes, also creating some flag patterns, currently, there is a potential sells on weekly and daily timeframes,
we might see a little movement up to the resistance zone at 92081, creating a triple top pattern before starting the downward movement again.
let's watch out for the market this week.
like and share your opinion
USD/CHF Short Trade Setup: Resistance Rejection Analysis🔵 Resistance Area (Blue Box)
🟥 Stop Loss: 0.86283 🔴 (Red dot at the top)
🔹 Entry Point: 0.85993 🔵 (Blue dot in the middle)
🟢 Target Point: 0.84518 ✅ (Green dot at the bottom)
📉 Trade Plan:
📌 Short Entry at 0.85993 (Expecting rejection from resistance)
🚨 Stop Loss at 0.86283 (Above resistance to protect against breakout)
🎯 Target at 0.84518 (Potential downside move)
📊 Market Structure:
📉 Prior Downtrend: Strong bearish move before consolidation
🔄 Sideways Price Action: Price struggling in resistance
⚡ Possible Breakdown: Expecting a fall if price holds below resistance
USDCHF Updatethis pair has formed and ascending channel on a higher timeframe
and formed also a double top
so now we're waiting for this pair to hit the down trendline of the channel so we can look or a long position on a lower timeframe
once the channel is broken and the candle lose below the last touch we will enter a short position also targeting take profit on 0.76 fib retracement
Follow for more
USDCHF - ShortUSDCHF Analysis - SHORT 👆
In this Chart USDCHF D1 Timeframe: By Nii_Billions.
❤️This Chart is for USDCHF market analysis.
❤️Entry, SL, and Target is based off our Strategy.
This chart analysis uses multiple timeframes to analyze the market and to help see the bigger picture on the charts.
The strategy uses technical and fundamental factors, and market sentiment to predict a BEARISH trend in USDCHF, with well-defined entry, stop loss, and take profit levels for risk management.
🟢This idea is purely for educational purposes.🟢
❤️Please, support our work with like & comment!❤️
Scenario on USDCHFIn this market, according to everything, a triangle is forming that completes wave D, which is also further proven by the last formation at the top of the channel, where there is also resistance at the price level of 0.88900, where there is also the fibo 0.618 of the previous wave, which further convinces me to think about shorts, but it is not yet completely confirmed, so wait.
USDCHF: 04/04/2024Dear Traders,
I wanted to provide you with an update on the USDCHF currency pair. As you know, the DXY has been extremely bullish since the beginning of February, and this has caused the USDCHF to rally without any major corrections. This has been supported by both fundamental and technical factors.
However, we are now seeing some strong bearish behavior on the USD, and this is likely to have a significant impact on USD pairs. In particular, we have some major news coming up tomorrow that is likely to affect the USD pairs significantly.
I will keep you updated on the situation as it develops.
good luck and trade safe
#USDCHF: 500+ Pips Upcoming Bearish Move, Let not miss it! FX:USDCHF
Price has changed the character and turned bearish since last few weeks. indicating price to drop further, currently price is making small correction on daily timeframe. However, there is a strong bearish area which in our view price will be heading towards. In our opinion, if you are planning to trade on USDCHF please wait for price to complete it correction and once the behaviour changes you can enter a sell entry accordingly to your plan and analysis. Thanks.
Team Setupsfx_


