Sell USD/CHF Bearish PennantThe USD/CHF pair on the M30 timeframe presents a potential selling opportunity due to a recent downward breakout from a well-defined Bearish Pennant pattern. This suggests a shift in momentum towards the downside in the coming Hours.
Key Points:
Sell Entry: Consider entering a short position around the current price of 0.8915, positioned close to the breakout level. This offers an entry point near the perceived shift in momentum.
Target Levels:
1st Support – 0.8862
2nd Support – 0.8825
Stop-Loss: To manage risk, place a stop-loss order above 0.8970. This helps limit potential losses if the price unexpectedly reverses and breaks back upwards.
Thank you.
Usdchfshort

USDCHFAnalysis of USDCHF 1 hour time frame
When the price reaches, we can enter the position by complying with the capital management

USDCHF Broken Support Retest!USD-CHF broke the rising
Support line and is now
Making a retest of the line
Which is now a resistance
And from where we will
Be expecting a local
Move down!

USDCHF - Looking To Sell Pullbacks In The Short TermH4 - Bearish trend pattern
No opposite signs
Until the strong resistance zone holds I expect the price to move lower further after pullbacks

USDCHF potential short 2R
Fondamental :
Traders priced a 25 points rate cut this year
Technical Analysis Based on the Chart :
The accompanying USD/CHF chart highlights a clear downtrend, reinforced by a break below a key support level at 0.90046. Key technical observations include:
Moving Averages: The 50-day Simple Moving Average (SMA) is at 0.9052, while the 200-day SMA is at 0.90878. The current price is below these moving averages, indicating sustained selling pressure.
Fibonacci Retracement: Fibonacci retracement levels show resistance at 0.90046 (50%) and 0.90357 (61.8%). These levels could act as potential reversal points if there is a corrective rebound.
Support and Resistance Levels: Immediate support is around 0.89552. A break below this level could lead to testing the lower support at 0.88776.
Market Sentiment: The Swiss franc, often viewed as a safe haven, may continue to gain against the USD amid geopolitical tensions and economic uncertainties, especially if the Federal Reserve's outlook remains unclear.

USDCHF tm:1hHello traders.
I hope you doing well.
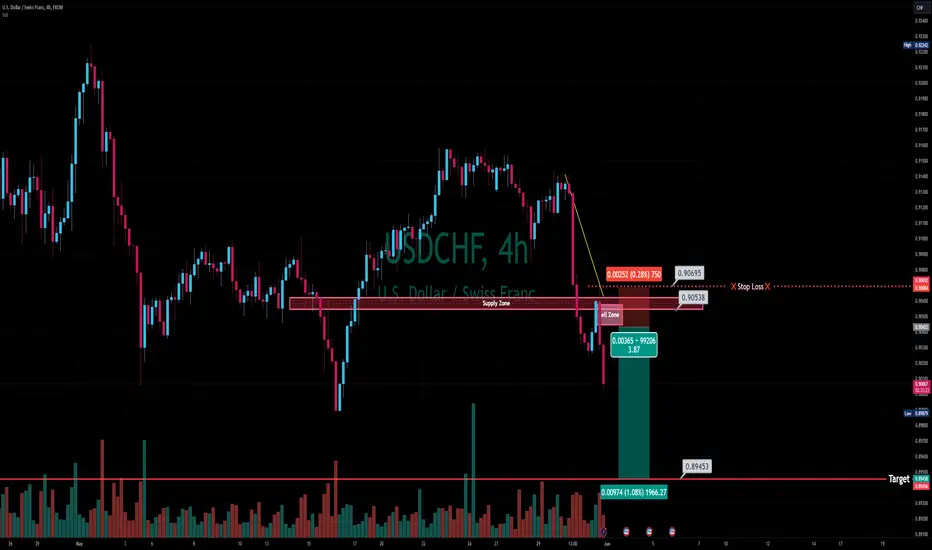
These areas are based on my personal strategy and I will share it with you.
Open a sell position on the supply area or open a buy position on the demand area.
Your entry point, stop loss, and target point are based on money management and the amount of money in your trading account.
But I promise you that by trading in the areas of my trading strategy, you will definitely make a profit, because these areas, although they seem simple, are my experience of 8 years of learning and trading.
I hope you will achieve maximum continuous profit with me by using supply and demand areas.
Good luck traders.
Mohammad Goodarzi

SELL TRADE SETUP ON USDCHFHey Trader,
Check out this analysis on USDCHF.
A long entry plan is best above the intraday support area (leading to the range continuation).
Alternatively, a short trade can be considered if the price breaks below the intraday key zone (support), retests, and resists. A short trade can be considered.
Trade safe.

USDCHF WEEKLY ANALYSISHello, traders here is a setup of USDCHF as you can see the price has been in a bullish form for the past weeks and now it has reached a zone of resistance that has been tested multiple times in the past and the price started showing rejection signs from the resistance zone as you can see there are two bearish engulfments candle sticks and that is a sign that price can go down in any moment.

Swing trade, short setup USDCHF👋Hello Traders,
Our 🖥️ AI system detected that there is an H4 or higher timeframe ICT Short setup in USDCHF for Swing trade.
Please refer to the details Stop loss, FVG(Sell Zone),open for take profit.
For more ideas, you are welcome to visit our profile in tradingview.
Have a good day!
Please give this post a like if you like this kind of simple idea, your feedback will bring our signal to next better level, thanks for support!
ICT Short setup USDCHF Swing trade and scalping👋Hello Traders,
Our 🖥️ AI system detected that there is an ICT Short setup in USDCHF for scalping.
Please refer to the details Stop loss, FVG(Supply Zone),open for take profit.
For more ideas, you are welcome to visit our profile in tradingview.
Have a good day!
Please give this post a like if you like this kind of simple idea, your feedback will bring our signal to next better level, thanks for support!

USDCHF Short Trade Setup A #short trade opportunity recently presented itself on the #dollarswissy (#USDCHF) #trading chart 📉.
This is indicated by the #bearish engulfing candlestick 🕯️ pattern just below the 0.91081 horizontal resistance level.
This indicates a rejection of the same level, with potential price move in the downward 👇 ⬇️ direction (#sell).
Sufficient downward momentum should see price dumping towards the 0.90000 psychological level and possibly testing the strength of the 0.89955 horizontal support level.
As always, please apply appropriate risk management.
Happy trading!
#majorpair

USDCHFThe USD/CHF pair is showing a bearish move in the 4-hour timeframe, having declined over 60 pips, likely completing a 50% retracement of the last bullish impulse. This suggests a potential short-term bearish continuation. However, for the long term, the price may resume its bullish trend once the retracement phase is completed.

USDCHF - Downside move ✅Hello traders!
‼️ This is my perspective on USDCHF.
Technical analysis: Here we are still in a bearish market structure as price did not break previous high, so I expect we can see bearish price action after price rejected from liquidity zone + institutional big figure 0.91000. My target is imbalance filled + order block.
Like, comment and subscribe to be in touch with my content!

USDCHF DAILY SETUPHello, traders here is a setup of USDCHF as you can see the price have created a bearish flag pattern (rising wedge pattern) and has already broken it and if you look closely the price created a head and shoulders pattern inside the flag pattern. This give's more indication that the price is likely to go down under these circumstances.

USDCHF SELLHi fellow traders, USDCHF is ready to make a move lower from the blue box after completing the correction. Target the 0.8968 level. Good luck and trade safe!

ICT Unicorn Sell setupafter reaching to 0.922 and take the buy side liquidity, we saw a quick displacement and bearish FVG at 0.914. it can go below the equal lows at 0.9 and take the sell side liquidity below it

USDCHF - Swing trade - 1:2.4 RRLooking to take a sells based off daily trendline break
Trendline has been broken, now waiting for a daily closure below the range.

USDCHFIn the USD/CHF 4-hour timeframe, a bearish trend is emerging as the price completes a 38% retracement following a breakout from a rising wedge pattern. The subsequent formation of an ABC pattern suggests further downside potential. Traders may anticipate continued bearish momentum as the market adheres to this technical structure.

USDCHF expecting a short liquidationUSDCHF gives me bullish vibe. I see a possibile short liquidation in the next days, considering that most of the retail are short. Looking at the chart, USDCHF is trying to bounce back up from main daily trendline. I think we can see a possible 200/250 pips rally to the upside before looking for a reversal pattern. Risk reward is not one of my best, but i am entering for a swing trade that i am confident to hold and i expect to go with stops at break even before the end of this week

USD/CHF Showing Amazing Bearish P.A , Short Setup Soon !This Is An Educational + Analytic Content That Will Teach Why And How To Enter A Trade
Make Sure You Watch The Price Action Closely In Each Analysis As This Is A Very Important Part Of Our Method
Disclaimer : This Analysis Can Change At Anytime Without Notice And It Is Only For The Purpose Of Assisting Traders To Make Independent Investments Decisions.

Perfect setup, bad luck USDCHFI posted this setup some days ago and i was monitoring this pair. I placed a sell limit order at 0.9230, and unfortunately entry wasn't trigger for some pips. I will look for a new entry short as soon as i will find an opportunity, even if i expect 0.92 to be touched again in the coming weeks.

USDCHF 1H Short Trade - 1:6 RRRTP: 0.88932
SL: 0.91649
In this trading strategy, we present a compelling opportunity for a long position on the USDCHF currency pair, focusing on the 1-hour timeframe. By incorporating key technical indicators such as the Exponential Moving Average (EMA) 200, Moving Average Convergence Divergence (MACD) for trend analysis, and Supertrend for entry signals, traders can aim to achieve a favorable risk-to-reward ratio of 1:6.
Indicators:
EMA200: The EMA200 serves as a critical indicator of the long-term trend direction.
MACD Trend: The MACD indicator helps traders assess the strength and direction of the trend.
Supertrend: The Supertrend indicator acts as a reliable tool for identifying entry points in alignment with the prevailing trend.

USDCHF Short Trade Setup A #short trade opportunity recently presented itself on the #dollarswissy (#USDCHF) #trading chart 📉.
This is indicated by the #bearish harami candlestick 🕯️ pattern just below the 0.91593 horizontal resistance level.
This indicates a rejection of the same level, with potential price move in the downward ⬇️ direction (#sell).
Sufficient downward momentum should see price dumping towards the 0.90000 psychological level and possibly testing the strength of the 0.89955 horizontal support level.
As always, please apply appropriate risk management.
Happy trading!
#majorpair
