USDCHF LONG 🏹Descending pattern + Double Bottom + Candle rejection
Also rejection from major support
We can look for a buy after a bullish pressure or a clear upward momentum
Comment down your ideas or doubts
Usdchfsignal

USDCHF | Perspective for the new week | Follow-upWe had a very good trading opportunity on our last trade on this pair as the price moved over 500pips in our direction since my last publication (see link below for reference purposes). Fr0.92300 has held price "Supported" five good times in the past hereby making this level a very viable Demand zone we can "trust". However, this same level has been a strong Support/Resistance level on the weekly chart (see below) and considering this character I shall be very careful here as a Breakdown might insinuate a risk of further decline... Let's take a look at what I think;
Tendency: Neutral
Structure: Breakdown | Supply & Demand | Trendline | Reversal Pattern (H and S)
Observation: i. The Trendline indicated on the chart has been a significant factor in deciding the prevailing bias of participants in the market since December 2020 as price tend to follow in the direction of a Break above/below at any given point in time.
ii. Since the break above of trendline (Fr0.91400) happened in early March 2021, Price has found a niche above Fr0.92200 which has become a strong Demand level.
iii. Demand level is considered strong due to the number of times the price has rejected this level to the upside in the past (five times!).
iv. Even as this level is considered strong, I am in a dilemma as the Breakdown of the Trendline during last week trading session might either be a false Breakdown or an incitation of a further decline in the nearest future should the price decide not to respect the Demand zone and do a Breakdown.
v. To be on the safe side for a rally continuation, I shall be looking to buy above Neckline which will also be a Key level @ Fr0.92750 for Bullish expectations.
vi. How to know if Breakdown is valid or not? When the price does not respect Demand zone and break down the Fr0.92000 area then we look forward to correction of Breakdown to join the decline train.
vii. This been said, we can not ignore the Reversal setup forming on the Daily chart as I see a Head and Shoulder pattern forming should price rally in the coming week (see chart below).
Trading plan: BUY confirmation with a minimum potential profit of 150 pips.
SELL confirmation with a minimum potential profit of 170 pips.
Risk/Reward : 1:5
Potential Duration: 5 to 10days
NB: This speculation might be considered to make individual decisions on the lower timeframe.
Watch this space for updates as price action is been monitored.
Risk Disclaimer:
Margin trading in the foreign exchange market (including foreign exchange trading, CFDs, etc.) has a high risk and is not suitable for all investors. The content of this speculation (including all data) is organized and published by me for the sole purpose of education and assistance in making independent investment decisions. All information herein is for your reference only and I take no responsibility.
You are hereby advised to carefully consider your investment experience, financial situation, investment objective, risk tolerance level, and consult your independent financial adviser as to the suitability of your situation prior to making any investment.
I do not guarantee its accuracy and is not liable for any loss or damage which may result directly or indirectly from such content or the receipt of any instruction or notification therewith.
Past performance is not necessarily indicative of future results.


Analyzing USD/CHF and taking a look at a low-risk buy set-upOverview - Recently, USD/CHF has slid below the 0.93 level.
However, on the lower end of the 0.92 level there lies some support. Let's
take a look at whether buyers have a good chance.
Analysis - From the chart we can see 0.9220 level can provide some support
if price drops to that level.
Probable trade set-up - Based on the support level, a buy entry at 0.9220 with
SL below 0.9180 and TP at 0.94 is a low-risk trade set-up.
Disclaimer - This is simply an analysis and not a trade recommendation. The trades will be
executed only if it meets the required criteria.

USDCHF Sell Trade Idea (My View)Back To Smaller TFs We Go... Lol... USDCHF Sell Opportunity... The Week Is Still Young Let's Go!!! SL & TP On Chart!!!


usdchf bulltrendif price making push down to retest support area then if 4h structure change from bear to bull we can long with a good risk to reward


USDCHF potential to drop down- 2nd ideaAnother way to look at it and still we expect it to dropdown.

USDCHF potential to drop down Hello traders, this is my idea on UC, lets wait and see how it's going to move.

USD/CHF Broken Resistance, Now Testing As SupportThis broke above resistance and is now retracing to test it as support. Looking for a long entry between 0.382 and 0.5 Fibonacci, can use 1HR timeframe with MACD to more accurately pinpoint when this turns higher.
Above there is a big resistance level so I am setting the TP at the bottom of this at 0.91833 and SL is just below 0.786 Fib


SELL SELL SELLHello Team, price has reached supply with a great risk to reward ratio shorts shall be our bias. price created an ascending channel. kindly leave a comment

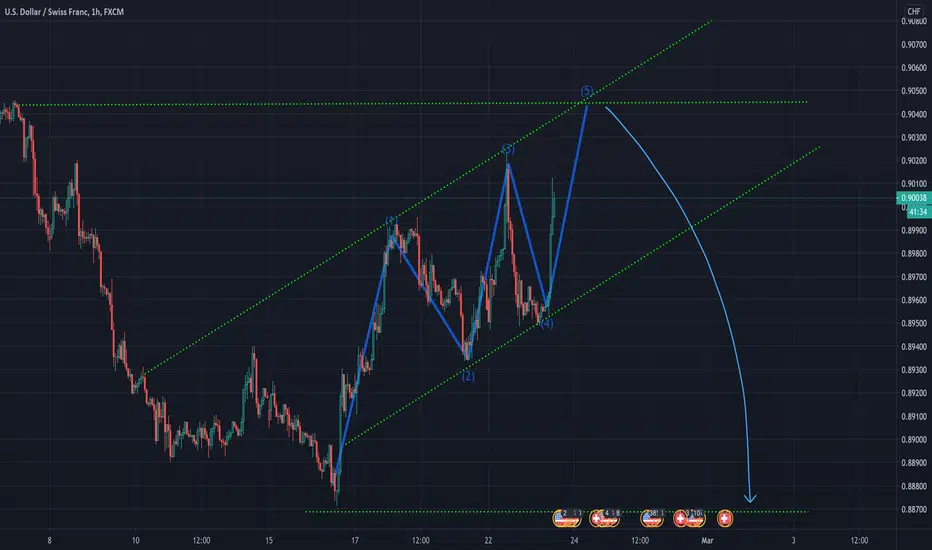
USDCHF sales from the level of the main target 0.88770USDCHF sales from the level of the main target 0.88770
❤️ If you find this helpful and want more FREE forecasts in TradingView
. . . . . Please show your support back,
. . . . . . . . Hit the 👍 LIKE button,
. . . . . . . . . . . Drop some feedback below in the comment!
❤️ Your Support is very much 🙏 appreciated!❤️
💎 Want us to help you become a better Forex trader?
Now, It's your turn!
Be sure to leave a comment let us know how do you see this opportunity and forecast.
USDCHF Buy Trade (My View)Looking For a Buy Position USDCHF. Banking on Bullish Trend To Continue With This Pair.
Fibs For TP 1$2 (Yellow Line Above FIBS Resistance)

USDCHF - Mark UpPlease view the chart for a breakdown of my analysis on this pair. If you have any questions, please be sure to leave a comment below.

USD/CHF - BUY TRADE SETUP#USDCHF - Possible Buy Trade setup.
Use Max (0.5% or 1%) Risk / Trade.
What Do You Think About This?
Please Comment below OR Share Your IDEA.

USDCHF | Perspective for the new weekThe price moved in our direction (180pips) as predicted in my last speculation on this pair (see link below for reference purposes).
After a 2 month long battle, Buyers finally broke above the key Fr0.89300 level (neckline) on Thursday... A complete reversal pattern is formed (Inverse Head and Shoulder) as I anticipate a rally soon.
Tendency: Uptrend ( Bullish )
Structure: Reversal pattern (Inverse H & S)| Breakout | Supply & Demand
Observation: i. It is fascinating to see how my Key Level @ Fr0.89000 becomes a decision maker last week after an emphatic breakout.
ii. Buyers finally redeems the hope of going Long in the coming week(s).
iii. After finding bottom @ Fr0.87600, Price has continued to appreciate as it keeps finding Higher Highs till the Breakout happens.
iv. I can not ignore the appearance of the Inverse H & S (a very strong reversal pattern); Bearish Leg that began mid-2020 falls to make a Shoulder and then rises to the Neckline(Fr0.89000); price then falls again and below the former Shoulder to make a Head and then rises again; finally, the price falls again but not as far as the second Shoulder to usher in a successful Breakout.
v. Looking forward to a correction into Demand zone as I shall watch out for significant spring up from this proposed new Demand area.
Trading plan: BUY confirmation with a minimum potential profit of 200 pips.
Risk/Reward : 1:4
Potential Duration: 10 to 20 days
NB: This speculation can be considered to make decisions on lower timeframes.
Watch this space for updates as price action is been monitored.
Risk Disclaimer:
Margin trading in the foreign exchange market (including foreign exchange trading, CFDs, etc.) has a high risk and is not suitable for all investors. The content of this speculation (including all data) is organized and published by me for the sole purpose of education and assistance in making independent investment decisions. All information herein is for your reference only and I take no responsibility.
You are hereby advised to carefully consider your investment experience, financial situation, investment objective, risk tolerance level, and consult your independent financial adviser as to the suitability of your situation prior to making any investment.
I do not guarantee its accuracy and is not liable for any loss or damage which may result directly or indirectly from such content or the receipt of any instruction or notification therewith.
Past performance is not necessarily indicative of future results.

USD/CHF - BUY - TRADE SETUPUSDCHF - Looks Like Bullish Trend Started.
Head and Shoulder Pattern Neckline also broke.
Entry is On Retest Level. Wait for Confirmation Candle.
What Do You Think About This?
Please Comment below & LIKE to Support us.
If you want Chart Analysis for any Currency Pair or Instrument.
Kindly mentioned in the comment section. All the Best !!
