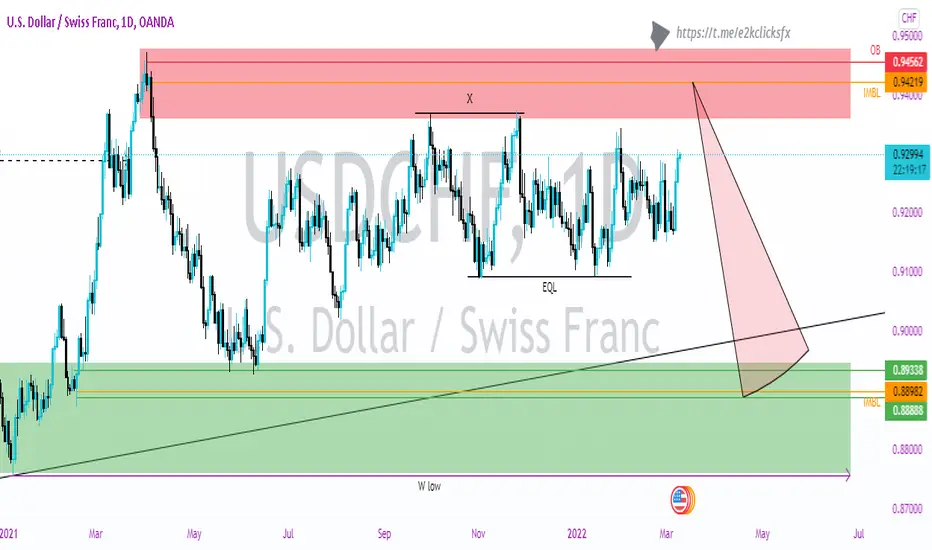
USDCHF Daily Short!
Overview:
USDCHF has reached levels that last experienced days of heavy testing dating back 25, Mar 21 through 05, Apr 21.
Considering price has approached this zone three additional times, it is likely it will penetrate a little deeper prior to sell-off.
0.94791 - 0.94983 has Confluence of Resistance and could be monitored for reversal cues on smaller time-frame if price gets to this zone.
Note: Idea is to complement your research.
Check comments section for future updates on idea.
Like this idea? Like, Share, Comment, Follow, (...)
Thank you. Happy Trading.
Usdchftrade

USDCHF-ShortUSDCHF
Market is currently on the resistance of ascending Channel, At the same time not able to cross the resistance level above. So good time to look for selling opportunity.

USDCHF SHORTS 📉📉📉📉 Expecting bearish price action on UCHF as price takes out buy side liquidity above old highs + rejects and important area of institutional figure 0.93000 + taking out stop above the weekly highs. The targets are into the H4 imbalance.
What do you think ? Comment below..

USDCHFUSDCHF ranging weekly at an accumulation phase; a tap back into weekly OB will give a pump....
Find entry n tp in TA.
Trade safe....
NB: Patience + risk management = winning trade
$usdchhf #e2kclicks
USDCHF above 0.9250 onboard basedThe pair gained above 0.9250 onboard based on US dollar buying. The escalation of Russia and Ukraine has increased demand for safe-haven assets like the US dollar. The minor pullback in the US treasury also supported the pair at lower levels.
Bullish scenario-
The primary levels to Watch – 0.9300. Any convincing surge above confirms intraday bullishness. A jump to 0.9341/0.9380/0.9435/0.9500 is possible.
Bearish scenario-
Intraday support – 0.92450. Break below that level will take the pair to 0.9170/0.9090/0.9050.
CCI (50) - Bullish

USDCHF Bearish Bias !!!USD-CHF rose to retest descending resistance
Because it's trading in a tight wedge now I guess
We will see a decline from the horizontal resistance level 0.9270
Towards the rising support level below

USDCHF Will Go Up! Buy!USD CHF is trading in a medium term bullish channel.
The pair has retested the support of the ascending channel 0.9200,
we may see an upward trend from these areas
BUy!!

#USDCHF H1TODAY IS THE THIRTEENTH DAY OF FEBRUARY
TIME : 8:21 P.M
#USD/CHF ANALYSIS
IN H1 SHORT
🇺🇸 Good night everyone this channel was created for premium signals in trading.
THIS CHART TREND ACTION WILL GO TO 0.91875 AND AFTER THAT WILL HAVE REACHED IT WE SHOULD BUY FROM THIS ZONE : 0.91875 BETWEEN 0.91850.
SO THE TARGET OF OUR PROFIT POINT WILL HAVE TO BE PUT 0.93250

USDCHFUSDCHF is Consistently making Higher Lows except consecutive Higher Highs . We can say it's a Weak UP TREND , but it could be start of a BIG BULLISH MOVE .More over Fundamentally USD has been gotten Strong Recently so we Can Expect a Long Bulls Move .
Look For Buys in the Yellow Rectangle Touching trend Line !

USDCHF | Good Buy Opportunity.If you find this technical analysis useful, please like & share our ideas with the community.
What do you think is more likely to happen? Please share your thoughts in comment section. And also give a thumbs up if you find this idea helpful. Any feedback & suggestions would help in further improving the analysis.
Good Luck!
Disclaimer!
This post does not provide financial advice. It is for educational purposes only! You can use the information from the post to make your own trading plan for the market. But you must do your own research and use it as the priority. Trading is risky, and it is not suitable for everyone. Only you can be responsible for your trading.

USDCHF Will this move happen?The situation in this currency pair look pretty clear.
In monthly:
The price is currently moving sideways within a range. The price is currently in supply area where we can expect a rejection to the downside.
Weekly
The price has made an explosive move to the upside creating a price imbalance. We could expect a correction to balance the price.
Daily
The situation in daily is the same as weekly. We could expect a correction to the downside to cover the imbalance.
According to the technical analysis we could expect a move to the downside.

USDCHFAfter the completion of the pullback and the failure of the set level, it can be sold. Are you agree?

USDCHF SHORTThis is USDCHF 1H timeframe analysis i am expecting it to fall from where it is at a moment it has a reversal that i refer as a head and shoulders pattern, let us all see how it goes.

USDCHF: Elliot Trade DailyHello friends. As it is clear in the chart, the flow of orders regarding USDCHF has a completely upward guard and we expect a bull trend from this chart, and this upward trend may take years. The third wave, which is also visible in the chart, is expected to rise to the bottom of the downtrend line. Good luck and make a profit.

USDCHF SHORTS 📉📉📉📉 Expecting bearish price action on this pair as price is overly extendend and right now is taking out liquidity above old highs aka resistance, rejecting a daily orderblock bearish area and a filling a bearish imbalance on the same timeframe. Price has been delivered with a lot of bullish imbalances that has to be filled next week.
What do you think ? Comment below..

USD/CHF DAILY BUY SET UPHi TRADERS this is my trade set up for the USD/CHF for the new week ahead
USD/CHF pair is coming up to area of resistance again and has touched 2 times since it last broke through, if it breaks through this time I can see a strong move higher, so we are buying only
This is my analysis only please trade with caution and risk management in place
clean crisp charts I hope it helps if you have any questions please private message me
good luck for this weeks trading
please follow like and comment thanks

Trading Idea Regarding USDCHFAccording to my analysis this pair is creating new supply or demand area...so there are two possibilities
1-it will break above the weekly falling resistance (if successfully created demand area)
2-came back towards the demand area (if successfully created supply area)


USDCHF top-down analysisHello traders, this is the full breakdown of this pair. We will take this trade if all the conditions are satisfied as discussed in the analysis. Smash the like button if you find value in this analysis and drop a comment if you have any questions or let me know which pair to cover in my next analysis.

USDCHFBecause the downtrend is marked after the surface is broken I expect the price to fall to the previous floor. Are you agree?

USDCHF on hourly time frame trade ideaBuy @ 0.91520-620
Stop Loss: 0.91300
Take profit1 : 0.91920
Take Profit2: 0.92220

USDCHF UP Trend.!#USDCHF Looking for Buy trade setup as I mentioned in the Chart.!
Keep Supporting LIKE, COMMENT And FOLLOW.!
Thank You.!

USDCHF Long call small time frame tradeEntry: 0.9200 (when hourly candle closes above 0.9200)
Stop loss: 0.91710
TP1: 0.92250
TP2: 0.92500
