USDCHF LONG 🏹Descending pattern + Double Bottom + Candle rejection
Also rejection from major support
We can look for a buy after a bullish pressure or a clear upward momentum
Comment down your ideas or doubts
Usdchftrade


USD/CHF - a beautiful short positionPrice broked a trend line. I expected the retest to 0.9375. If it happens, I'll open a short.
Write in the comments all your questions and instruments analysis of which you want to see.
Friends, push the like button, write a comment, and share with your mates - that would be the best THANK YOU.
P.S. I personally will open entry if the price will show it according to my strategy.
Always make your analysis before a trade

Analyzing USD/CHF and taking a look at a low-risk buy set-upOverview - Recently, USD/CHF has slid below the 0.93 level.
However, on the lower end of the 0.92 level there lies some support. Let's
take a look at whether buyers have a good chance.
Analysis - From the chart we can see 0.9220 level can provide some support
if price drops to that level.
Probable trade set-up - Based on the support level, a buy entry at 0.9220 with
SL below 0.9180 and TP at 0.94 is a low-risk trade set-up.
Disclaimer - This is simply an analysis and not a trade recommendation. The trades will be
executed only if it meets the required criteria.


USD/CHF New Trade And Analysis 1:13 Risk Reward !This is an educational + analytic content that will teach why and how to enter a trade
Make sure you watch the price action closely in each analysis as this is a very important part of our method
Disclaimer : this analysis can change at anytime without notice and it is only for the purpose of assisting traders to make independent investments decisions


USDCHF next week trading planUSDCHF an important weekly support zone and probably the best place to open a buy entry. I have shown the analysis in the chart


USD POSSIBLE SELL AFTER HITTING KEY LEVEL ON DAILYUSD POSSIBLE SELL AFTER HITTING KEY LEVEL ON DAILY

USDCHF Cup & Handle chart patternAnother classic example of a cup and handle chart pattern, Guys the markets always repeat them selves, after a while you will be able to analyze the market by just looking at it,
Wait for a handle to form. The handle often takes the form of a sideways or descending channel or a triangle. Buy when the price breaks above the top of the channel or triangle.
Please get in touch with us should you have any questions

USDCHF - Mid / Long term - Long SetupStrong rally to 2.618% Fib and price resistance.
Mid term play could be a long position on correction/consolidation to the 0.904-0.909 area (white circle). Price support, trendline support and Fib .618% retrace. If this area holds could be looking at Inv H&S setting up and a big wave 3 to the 0.96-0.97 area.


USDCHF Sell (My View)Looking For a Sell Position USDCHF. Banking on Bearish Trend To Develop With This Pair
Fibs For TP 1$2
Idea Based On Trend Analysis!! {{{FoRexIsaJoKe}}}

USDCHFTrend: Up
Pattern: Falling wedge, double bottom
Waiting for signal on retest of the broken wedge to buy


USDCHF potential to drop down- 2nd ideaAnother way to look at it and still we expect it to dropdown.

USDCHF potential to drop down Hello traders, this is my idea on UC, lets wait and see how it's going to move.

USD/CHF Broken Resistance, Now Testing As SupportThis broke above resistance and is now retracing to test it as support. Looking for a long entry between 0.382 and 0.5 Fibonacci, can use 1HR timeframe with MACD to more accurately pinpoint when this turns higher.
Above there is a big resistance level so I am setting the TP at the bottom of this at 0.91833 and SL is just below 0.786 Fib


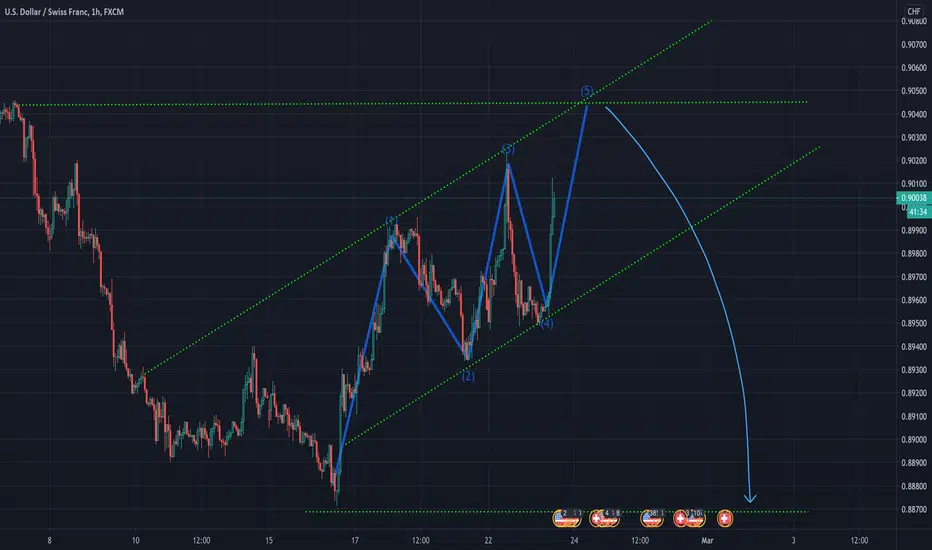
USDCHF sales from the level of the main target 0.88770USDCHF sales from the level of the main target 0.88770
❤️ If you find this helpful and want more FREE forecasts in TradingView
. . . . . Please show your support back,
. . . . . . . . Hit the 👍 LIKE button,
. . . . . . . . . . . Drop some feedback below in the comment!
❤️ Your Support is very much 🙏 appreciated!❤️
💎 Want us to help you become a better Forex trader?
Now, It's your turn!
Be sure to leave a comment let us know how do you see this opportunity and forecast.
USDCHF Buy Trade (My View)Looking For a Buy Position USDCHF. Banking on Bullish Trend To Continue With This Pair.
Fibs For TP 1$2 (Yellow Line Above FIBS Resistance)
