USDCHF | Short Term PredictionD : Bearish Trend
15m :
"Wait for the NY Killzone session to take sell-side liquidity for a long position.
Wait for the NY Killzone session to take an immediate buy-side liquidity sweep from previous sessions, and also a buy-side liquidity sweep within the NY session, then take a short position.
Do not deviate from the 1-minute confirmation process."
Usdchftrade

USDCHF | Buying Opportunity15m: London session is expected to sweep most of the sell-side liquidity. Wait for the maximum sell-side liquidity sweep, and if there is any bullish confirmation, take a long position followed by a 1m bullish confirmation.

USDCHFPair : USDCHF ( U.S Dollar / Swiss Franc )
Description :
Completed " 12345 " Impulsive Waves and " ABC " Corrective Waves
Break of Structure
RSI - Divergence
Bearish Channel as an Corrective Pattern in Short Time Frame
Fibonacci Level - 50.00%

USDCHF Weekly Analysis and OutlookUSDCHF Weekly Analysis and Outlook
This week, the USDCHF pair has shown a strong downward trajectory, closing in a bearish continuation phase. This downward momentum indicates a negative sentiment among traders, suggesting further potential for decline.
Current Market Overview:
The pair has been steadily moving downwards, supported by unfavorable market conditions and bearish sentiment. As it approaches a key resistance zone, traders should closely monitor the price action. A successful rejection at this resistance would likely confirm the continuation of the bearish trend.
Expectations and Potential Scenarios:
Upon retesting the resistance zone, we anticipate that the USDCHF will continue its downward momentum. This rejection could open the door to lower levels, offering traders potential opportunities to capitalize on the bearish trend.
Primary Expectation: If the resistance holds, the price is likely to sustain its downward movement, potentially targeting lower support levels. This scenario would reinforce the bearish outlook, making it a favorable environment for short positions.
Alternative Scenario: However, if the price breaks through the resistance, a temporary pullback could occur. Traders should be prepared for this scenario, as it might provide opportunities to reassess entry points at higher levels before resuming the downward trend.
Conclusion:
In summary, the USDCHF pair is poised for further downward movement following its recent bearish phase. Traders should watch for a decisive rejection at the resistance zone, which could serve as a catalyst for continued declines. Maintaining awareness of both bearish and corrective scenarios will be crucial for effective trading strategies. Stay updated with market developments and adjust your positions accordingly.
By Piptera Digital Solutions,
Invest Wisely!

USDCHFPair : USDCHF ( U.S Dollar / Swiss Franc )
Description :
Completed " 12345 " Impulsive Waves
Break of Structure
RSI - Divergence
Bullish Channel as an Corrective Pattern in Short Time Frame
CHoCH
Demand Zone

USDCHF
The USD/CHF has hit our selling target and is now exhibiting bullish momentum. The completion of the Elliott Wave 12345 pattern and the formation of a double bottom indicate a reversal. We are now entering a buying position, anticipating an Elliott Wave ABC correction.

USDCHF H4 Projection!
Now price moving above the FVG zone. Before initiating long positions Wait until the price reaches the fair value gap and make a bullish price action structure. Good Luck

USD/CHF - Bearish Reversal Anticipated from Key Resistance LevelThe USD/CHF currency pair currently exhibits a Bearish Butterfly Harmonic Pattern. This pattern is significant as it is forming at a key resistance area, indicating a potential reversal in price action. The pattern's completion point, identified as Point D, aligns with a 61.8% Fibonacci retracement level, further reinforcing the likelihood of a bearish movement.
Potential Reversal Zone (PRZ):
Point D, also known as the Potential Reversal Zone (PRZ), is the critical area where we anticipate a reversal from the current uptrend. At this point, the confluence of the Bearish Butterfly Harmonic Pattern and the 61.8% Fibonacci level strengthens the probability of a significant bearish reversal.
Entry, Stop Loss, and Take Profit Levels:
To capitalize on the anticipated bearish movement, we recommend entering a short position at 0.90055. To manage risk effectively, a stop loss should be placed at 0.90175, slightly above the PRZ to allow for minor price fluctuations without triggering an early exit.
Take Profit Targets:
We have identified three take profit levels to gradually secure profits as the price moves in the anticipated bearish direction:
TP-1: 0.89935
TP-2: 0.89815
TP-3: 0.89695
These take-profit levels are strategically placed to capture gains at significant price points, providing a structured exit strategy to maximize profitability while managing risk.
Conclusion:
The formation of a Bearish Butterfly Harmonic Pattern at a key resistance area, coupled with the alignment of the 61.8% Fibonacci retracement level, suggests a high probability of a bearish reversal in the USD/CHF currency pair. By entering at 0.90055 with a stop loss at 0.90175 and targeting the specified take-profit levels, traders can effectively benefit from the expected downward movement.
Disclaimer:
This technical analysis report is provided for informational purposes only and should not be construed as financial advice. Traders are encouraged to conduct their own research and consider their risk tolerance before entering any trades.

USDCHF BULLISH ROBBERY PLAN TO MAKE AND TAKE MONEYMy Dear Robbers / Traders,
This is our master plan to Heist USDCHF Bank based on Thief Trading style Technical Analysis.. kindly please follow the plan I have mentioned in the chart focus on Long entry. Our target is Red Zone that is High risk Dangerous level market is overbought / Consolidation / Trend Reversal at the level Bearish Robbers / Traders gain the strength. Be safe and be careful and Be rich.
Note: If you've got a lot of money you can get out right away otherwise you can join with a swing trade robbers and continue the heist plan,
Loot and escape on the target 🎯 Swing Traders Plz Book the partial sum of money and wait for next breakout of dynamic level / Order block, Once it is cleared we can continue our heist plan to next new target.
support our robbery plan we can easily make money & take money 💰💵 Join your hands with US. Loot Everything in this market everyday.

USDCHF - Looking To Sell Pullbacks In The Short TermH4 - Bearish trend pattern
Currently it looks like a pullback is happening
Until the strong resistance zone holds my short term view remains bearish here.

USDCHF Broken Support Retest!USD-CHF broke the rising
Support line and is now
Making a retest of the line
Which is now a resistance
And from where we will
Be expecting a local
Move down!

USDCHF SELLHi fellow traders, USDCHF is ready to make a move lower from the blue box after completing the expanding flat pattern. Target the 0.8948 level and move your stoploss to break even as soon as we reach the ‘Risk free zone’. Good luck and trade safe!

USDCHF - Looking To Sell Pullbacks In The Short TermH4 - Bearish trend pattern
No opposite signs
Until the strong resistance zone holds I expect the price to move lower further after pullbacks

USDCHF WEEKLY ANALYSISHello, traders here is a setup of USDCHF as you can see the price has been in a bullish form for the past weeks and now it has reached a zone of resistance that has been tested multiple times in the past and the price started showing rejection signs from the resistance zone as you can see there are two bearish engulfments candle sticks and that is a sign that price can go down in any moment.

USDCHF Short Trade Setup A #short trade opportunity recently presented itself on the #dollarswissy (#USDCHF) #trading chart 📉.
This is indicated by the #bearish engulfing candlestick 🕯️ pattern just below the 0.91081 horizontal resistance level.
This indicates a rejection of the same level, with potential price move in the downward 👇 ⬇️ direction (#sell).
Sufficient downward momentum should see price dumping towards the 0.90000 psychological level and possibly testing the strength of the 0.89955 horizontal support level.
As always, please apply appropriate risk management.
Happy trading!
#majorpair

USDCHFThe USD/CHF pair is showing a bearish move in the 4-hour timeframe, having declined over 60 pips, likely completing a 50% retracement of the last bullish impulse. This suggests a potential short-term bearish continuation. However, for the long term, the price may resume its bullish trend once the retracement phase is completed.

USDCHF Short Trade Setup A #short trade opportunity recently presented itself on the #dollarswissy (#USDCHF) #trading chart 📉.
This is indicated by the #bearish harami candlestick 🕯️ pattern just below the 0.91593 horizontal resistance level.
This indicates a rejection of the same level, with potential price move in the downward ⬇️ direction (#sell).
Sufficient downward momentum should see price dumping towards the 0.90000 psychological level and possibly testing the strength of the 0.89955 horizontal support level.
As always, please apply appropriate risk management.
Happy trading!
#majorpair

USDCHF Technical Analysis and Trade IdeaThe USD/CHF currency pair has exhibited bullish tendencies on the higher time frame. Currently, we are witnessing a significant retracement as price has encountered resistance. In the accompanying video, we explore a potential trading opportunity, contingent upon the development of favorable price action. We identify key support and resistance levels, along with an optimal entry point based on a 61.8% Fibonacci retracement. The discussion encompasses chart patterns, price action analysis, and a particular form of price behavior that, if advantageous, would warrant market entry. As a disclaimer, the information provided is solely for educational purposes and should not be construed as financial advice. Trading carries inherent risks, and it is imperative to implement sound risk management practices at all times.

USDCHF Swing setupUSDCHF charts looks good for the next weeks. My plan is clear, i am waiting higher price to start selling. When the price will be traded above 0.92, i will enter short targeting the support zone at 0.89

USDCHF WAIT to SHORTUSDCHF WAIT to SHORT
Trade to be initiated only when the inner TL (blue color) is broken to the downside and SL above the Right shoulder. Its a 3 minute video where I have explained. Enjoy watching

USDCHF - A Godsend In addition to my longer-term swing trade (if not already a position trade) in the form of a USDCHF long with a profit target of +760 pips, seen here
I am also entering a "shorter-term" USDCHF long trade here at 0.83600, with a target of 0.87100.
Thus a good +340 pips would be possible here.
The probability that the weakness of the USDCHF will also come to an end by the end of the year tomorrow at the latest is exorbitantly high and the CRV at these levels is more palatable than ever.
Otherwise, the fundamental reasons remain the same as in the longer-term trade above.
-> The SNB will no longer be happy with the current levels of the CHF as soon as it returns from its skiing holiday in the Swiss Alps.

FX Wars Episode 5 - The (USD) Empire strikes back!I go long the USD vs CHF here from 0.843.
I give the trade a high probability of 80% to be a winner, lets see!
Once upon a time in an FX universe far, far away...
The (supposedly) evil US(D) empire was pushed to the brink of defeat by the CHF rebellion, but "something" suddenly happened...
...life stirred into the USD again and it was sent back to fulfil its task (the bondage of all other currencies).
What that "something" was I will unravel after the (profitable) end of this trade.
USD facts:
- The market is pricing in almost 7 rate cuts for 2024
-> this is diametrically opposed to the expectations of the FED members, who expect a total of 3 rate cuts for 2024
- Is the market once again too euphoric here and is frontrunning itself with possible rate cut fantasies?
-> I would like to leave this question open for now, as I also expect more than 3 interest rate cuts by the FED in 2024
But the fact is: market expectations can only be fulfilled if either
A) there is a recession in the USA and or
B) inflation permanently falls below the 2% mark
CHF view:
The SNB is currently on Christmas holiday and is probably letting loose while skiing in the Swiss mountains followed by apres-ski party hits.
But as soon as the party is over and the hangover is felt all the harder in the new year, the Swiss National Bank will have a heart attack when it looks at the value of the franc.
-> It is now more "overvalued" than it was during the corona crisis, when the SNB had to intervene to actively weaken the CHF
- Now these are completely different circumstances under which the SNB has to operate and yet it can be anything but satisfied with the strength of the franc...
More on this later in the comments...

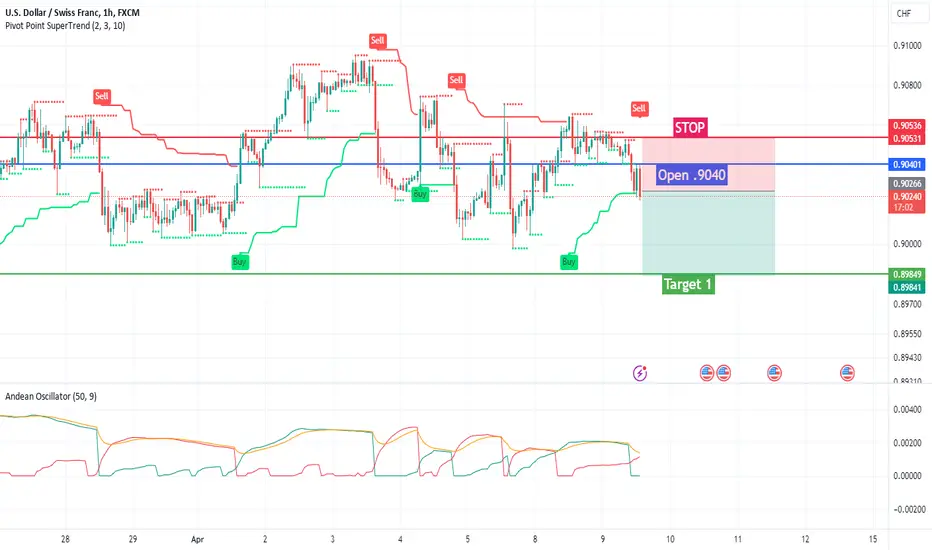
SHORT USD/CHF from .9040Apround the 13th March the price of USD/CHF broke through the key 200 EMA on the H1 time frame. Around the 20th March, the price returned to the 200 and this acted as solid support.
AT the end of last week, we saw the price return to the 200 and make several attempts to break through. Although these BEARISH breaks were successful they were met with determined BULLISH replies and price moved back above the 200 but did not make any further progress north.
A look at the charts currently (13:30 9/4/24) sees the price of USD/CHF being squeezed back under the 200 by the 100, 50 and 25 EMA.
This is significant.
This indicates that USD/CHF are losing the battle to holf the 200 and I~m now in SHORT from .9040.
Currently (on H1 time frame) the 25 50 and 100 EMA's are reading .9018/.9021/9016 and I expect/anticipate that we'll see the 25, 50 and 100 EMA's begin to cross over each other (south) and in an hour or two we will see the faster EMA's start attacking the 200 which would be very BEARISH for USD/CHF.
Adding to this anlaysis is:
a). price is now under the 200 EMA.
b). RSI declining
c). Fast and slow MACD lines crossing south over the zero line
d). Andean Oscillator red SELL line rising as the green BUY line declines.
All in all its hard to see where USD/CHF can go other than south from these levels.