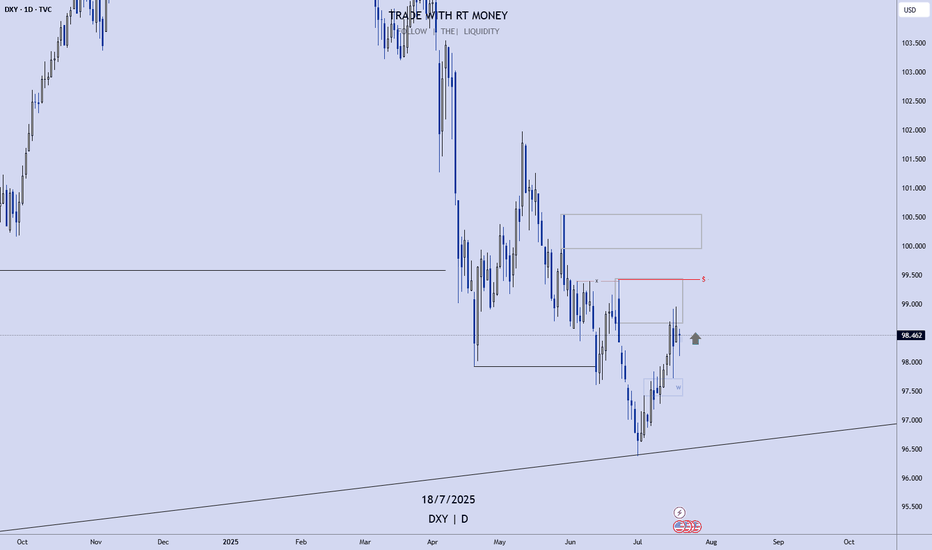
USD Is Still Bullish! Wait For Buys!Welcome back to the Weekly Forex Forecast for the week of July 21-25th.
In this video, we will analyze the following FX market:
USD
The DXY has run bullish last week, up into an area of Supply, where the momentum hesitates now. Next week may pull back a bit... before continuing higher to the buy side liquidity.
Look out for the short term pullback to the W +FVG for a high probability move higher!
Enjoy!
May profits be upon you.
Leave any questions or comments in the comment section.
I appreciate any feedback from my viewers!
Like and/or subscribe if you want more accurate analysis.
Thank you so much!
Disclaimer:
I do not provide personal investment advice and I am not a qualified licensed investment advisor.
All information found here, including any ideas, opinions, views, predictions, forecasts, commentaries, suggestions, expressed or implied herein, are for informational, entertainment or educational purposes only and should not be construed as personal investment advice. While the information provided is believed to be accurate, it may include errors or inaccuracies.
I will not and cannot be held liable for any actions you take as a result of anything you read here.
Conduct your own due diligence, or consult a licensed financial advisor or broker before making any and all investment decisions. Any investments, trades, speculations, or decisions made on the basis of any information found on this channel, expressed or implied herein, are committed at your own risk, financial or otherwise.
Usdfutures
USD INDEX (DXY)... Bias is BEARISH!Bias is Bearish.
Price is still in a -FVG, though
it has almost filled it. But
until there is a candle close
on a daily basis, my bias will
remain bearish.
My view is the 5 days of
bullish PA is simply just
a retracement... an internal
move after a BOS.
The low resistance liquidity
run below the previous lows
can potentially draw price
lower.
There is a fair chance that
today's high will be swept
before it turns around.
USD Index (DXY, DX1!, ) Weekly Update.... BEARISHYes, I did call for bearishness in the Weekly Outlook. And yes, the USD has moved bullishly since Tuesday. However, I did state that price would move up into the fair value gap, and from there, the bears would take over.
Remember, I described an External to an Internal RUn on LQ. Price has moved from Discount to Premium prices. Currently, price is positioned to make the downward move!
I do believe price has finally started to turn over, as the FVG has been filled ... to the pip!
We should be looking to see the bearish FVG will hold, and watch for valid sell setups.
I do not trade DXY, but use it as an indicator, as I mentioned in the Outlook video. I would be looking for buys in xxxUSD pairs, and sells in USDxxx pairs. Also, Gold should continue upwards, as well as S&P, NAS, and DJ.
May profits be upon you.
USD buyers ready to test resistance again?Today's focus: USD Index
Pattern – Continuation
Possible targets – 105.60
Support – 103.40
Resistance – 104.20
Today’s update is on the USD index. Do we have a new uptrend? For us, we want to see resistance beaten. If we can see a break, this could set up a new move to 105.60 and a break of that level take price out of its consolidation range and gets an uptrend going. For now, we have a short-term up trend, but buyers have more work to do to confirm it overall.
If we see a new retracement, we want to see support hold. A move back to 102.70 is a worry if you’re on the short-term bull side. With momentum back in the buyer’s court, will we see a break of resistance?
Thanks for stopping by. Good trading, and have a great day.
USD looks to break last low and support... The USD Futures Daily chart is already pointing that way... Once it breaks the yellow support line, it will look for 99.
MACD slowing its ascent, while VolDiv is crossing down itself and below zero line.
TD Setup is bearish for the USD.
Bearish outlook overall.
US Dollar Index Futures (DX1!), H1 Potential for Bullish riseType : Bullish Rise
Resistance : 103.960
Pivot: 102.925
Support : 102.240
Preferred Case: On the H1, price is moving above the ichimoku cloud and along the ascending trendline which supports our bullish bias that price will rise from the pivot at 102.925 where the swing low support is to the 1st resistance at 103.960 in line with the swing high resistance, 127.2% fibonacci extension and 100% fibonacci projection
Alternative scenario: Alternatively, price may break pivot structure and drop to the 1st support at 102.240 in line with the overlap support and 78.6% fibonacci projection.
Fundamentals: The CPI is forecast to rise by 0.7 percent from the previous month's 0.3 percent, but this is unlikely to affect the two 50-basis-point rate rises already factored in for June and July. This gives us a weak bullish view for the US Dollar Index Futures.


