USD/IDR Flirts with Key Weekly Resistance Amid VolatilityThe Indonesian Rupiah (IDR) is currently at a critical juncture, with technical indicators suggesting potential upside for the USD/IDR exchange rate, while fundamental factors introduce significant uncertainties. A recent technical breakout points to a bullish trend; however, economic policies, global trade dynamics, and geopolitical developments present potential headwinds.
Technical Analysis: Ascending Triangle Breakout
On the weekly timeframe, the USD/IDR chart has exhibited a significant technical development. After a period of consolidation, the pair formed an ascending triangle pattern, characterized by a horizontal resistance line around the 16,263 level and an ascending trendline connecting successive lows.
It's important to note that breakouts often experience volatility, and it may be prudent to set a stop-loss order to protect against false breakouts.
The Ascending Triangle Formation
Over the course of several years, the USD/IDR chart has formed an ascending triangle pattern. This pattern is characterized by:
Horizontal Resistance: A flat resistance line, around the 16,263 IDR level. This line marks the upper bound of the price consolidation, indicating that the price has had trouble moving above this level on previous attempts.
Ascending Trendline: A rising trendline connecting successive lows. This line indicates an underlying upward pressure on the price, with each subsequent low being higher than the previous one.
These two components together create the ascending triangle shape, with the resistance line forming a flat top, and the trendline forming the rising base. This is a bullish continuation pattern, which typically resolves itself by breaking upwards.
Waiting for Breakout Confirmation
The USD/IDR pair is currently in a holding pattern, awaiting confirmation of a breakout above the horizontal resistance level. If the current candle closes decisively above the resistance, which is approximately at 16,850 IDR, it would signal a confirmed breakout. This development could pave the way for bullish momentum to overpower the resistance, potentially triggering a strong upward trend.
Implications of the Breakout
Bullish Momentum: The breakout signals a potential shift in momentum towards the bulls. The previously stagnant trading range has been broken, and the market is now expecting the pair to move higher.
Pattern Projection: Ascending triangle breakouts often project a potential price target. A common way to estimate this target is to measure the vertical height of the base of the triangle (the widest part of the triangle) and project that distance upward from the point of breakout. In this case, this method would give a long-term price projection.
Increased Volatility: Breakouts are generally accompanied by increased volatility as the market adapts to the new trend. The recent trading range which has been seen is now broken and the price is expected to trend upwards in a less volatile manner.
Fundamental Analysis
Bank Indonesia's Monetary Policy
On January 15, 2025, BI unexpectedly reduced its benchmark 7-day reverse repurchase rate by 25 basis points to 5.75%, marking the first cut since September 2024. This decision aims to stimulate economic growth amid global uncertainties and a low inflation outlook. However, the rate cut led to the Rupiah depreciating to a six-month low, reflecting market concerns about potential capital outflows and currency stability.
National Debt Obligations
In 2025, Indonesia faces substantial debt servicing responsibilities, with approximately Rp 800 trillion of central government debt maturing. This includes Rp 705 trillion in Government Securities (SBN) and Rp 95 trillion in loans from bilateral, multilateral, and commercial sources. The significant debt repayment obligations may limit fiscal flexibility, necessitating prudent financial management to maintain economic stability.
Domestic Economic Growth
The Indonesian government has set an economic growth target of 5.2% for 2025, consistent with its 2024 goal. International organizations offer similar projections, with the International Monetary Fund (IMF) estimating growth at 5.1%. Despite these optimistic forecasts, BI's recent rate cut indicates concerns over weaker-than-expected economic performance in late 2024, highlighting the need for policies that bolster domestic consumption and investment.
These factors collectively impact the Rupiah's performance, underscoring the importance of vigilant economic monitoring and responsive policy measures to navigate the challenges ahead.
Disclaimer: This is not a financial advisor. This analysis is purely for informational purposes and should not be considered as investment advice. Trading involves risk, and you should consult with a financial professional before making any decisions.
USDIDR
USDIDR Buy On WeaknessThis chart shows the USD/IDR pair (U.S. Dollar/Indonesian Rupiah) on a weekly timeframe. Below is the analysis based on the visible trend lines, price action, and channels:
1. Ascending Channel:
The chart illustrates a clear upward channel that has been maintained since 2017, suggesting a long-term bullish trend in the USDIDR pair.
The price has bounced from the lower bound of the channel, which indicates that the support line around the 15,200 region is holding well.
2. Support and Resistance:
Support: The price is currently hovering around 15,459. The nearest strong support zone is at 15,200 as it coincides with both historical price levels and the lower bound of the upward channel.
Resistance: There are several resistance levels ahead:
16,400 (the dotted line): This seems to be a mid-level resistance line within the channel.
16,600: This appears to be the next major resistance, as indicated by the chart and could represent a key decision zone.
3. Possible Future Movement:
The chart suggests a bullish bias in the future, as indicated by the projected zigzag path. The price is expected to bounce between resistance and support lines before possibly reaching towards the upper boundary of the channel near 16,600.
Short-term correction: Before further bullish movement, the price might dip slightly towards the 15,400 or 15,200 support levels.
4. Long-Term Outlook:
The price trend continues to suggest an upward movement in the long term, as the channel is clearly moving upwards. A breakout above the 16,400–16,600 resistance zone could accelerate the USDIDR towards new highs.
Conclusion :
Bullish Outlook: The USDIDR seems to be in a long-term bullish channel. After potentially testing support at 15,200, the price may resume its upward trajectory, targeting 16,400 and possibly 16,600 in the coming months.
Trade Like A Sniper - Episode 41 - USDIDR - (13th June 2024)This video is part of a video series where I backtest a specific asset using the TradingView Replay function, and perform a top-down analysis using ICT's Concepts in order to frame ONE high-probability setup. I choose a random point of time to replay, and begin to work my way down the timeframes. Trading like a sniper is not about entries with no drawdown. It is about careful planning, discipline, and taking your shot at the right time in the best of conditions.
A couple of things to note:
- I cannot see news events.
- I cannot change timeframes without affecting my bias due to higher-timeframe candles revealing its entire range.
- I cannot go to a very low timeframe due to the limit in amount of replayed candlesticks
In this session I will be analyzing USDIDR, starting from the 3-Month chart.
If you want to learn more, check out my TradingView profile.
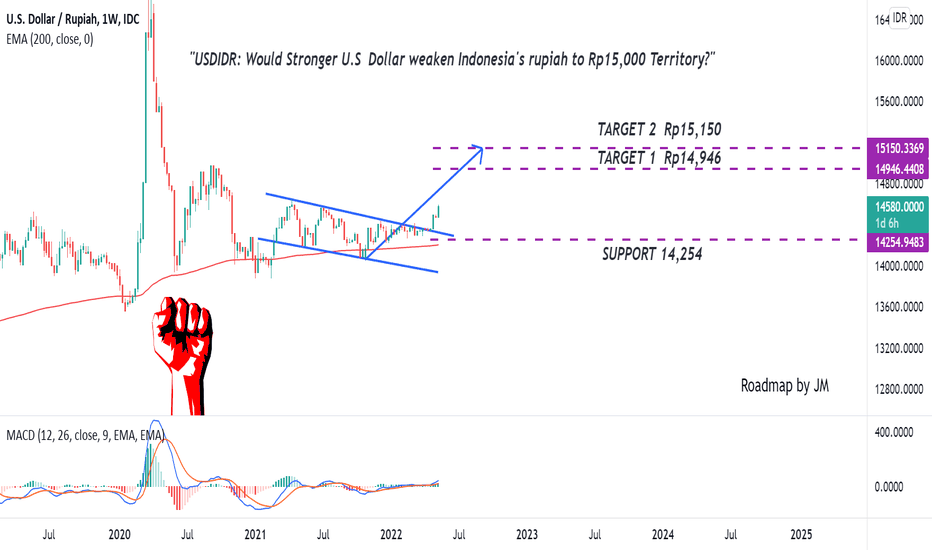
Would Stronger Dollar Weaken Indonesia's rupiah to Rp15,000?The inflation rate has reached above 8% territory in the U.S. Higher Inflation Rate forced the Fed to raise the interest rate again by 50 basis points in May 2022 and it seems the Fed will remain hawkish for stabilizing inflation to a more normalized level. Commonly, the Increasing interest rate will make a stronger dollar because it will attract investment capital from investors abroad seeking higher returns on bonds and interest-rate products. Therefore, a bullish/Stronger Dollar outlook might prevail and potentially weakens Indonesia's Rupiah.
From Chart Perspective:
USD/IDR is moving above the Exponential moving average of 200, which means a bullish bias. Recently, The pair has broken out of the falling wedge pattern, accompanied by a golden cross in the MACD indicator. it signifies a potential bullish bias to the target area.
Smash the Follow and Give us Thumbs up for More Educational content!
* Disclaimer: This is for educational purposes only, We are not responsible for any of your financial decision.
USDIDR 19th APRIL 2022Rupiah tends to move flat despite the strengthening of the US dollar against major currencies. In addition, the demand for the dollar has increased, and the demand for other safe haven assets has also increased, as indicated by the increase in gold prices and also followed by an increase in the yield of the US Treasury to the level of 2.88%. In addition, the release of Indonesia's trade balance data as of March 2022 recorded a surplus of US$ 4.53 billion, wherein March's export performance was the highest in history, which also limited the weakening of rupiah.
Rupiah will strengthen in a limited range of Rp.14,000 - Rp.14,700 per USD.
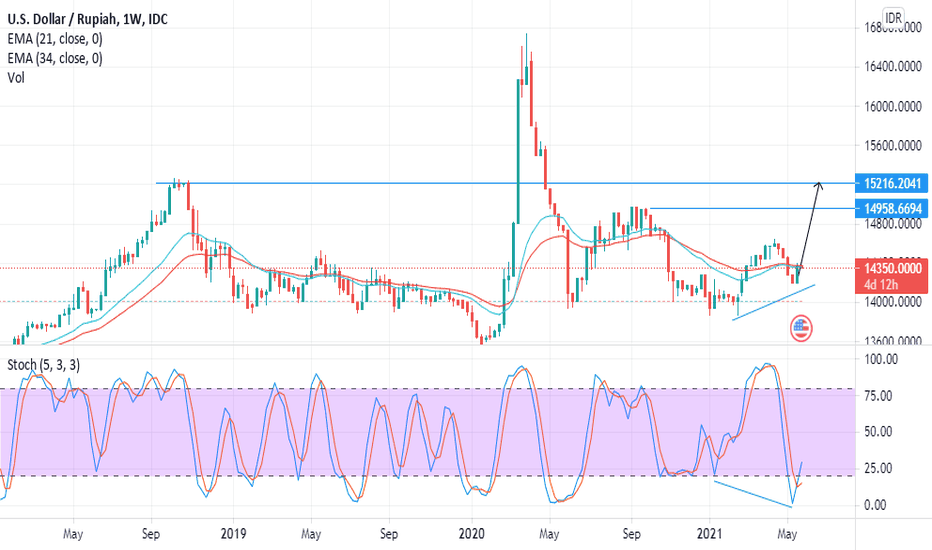
Bullish Bias on USDIDRIndonesia rupiah would like to weakening since we've got a pennant pattern on this market as their bullish continuation signal. Buy on break should be your consideration with the supply area as price target and 14300 as a bullish invalidation if the price goes down and close below it
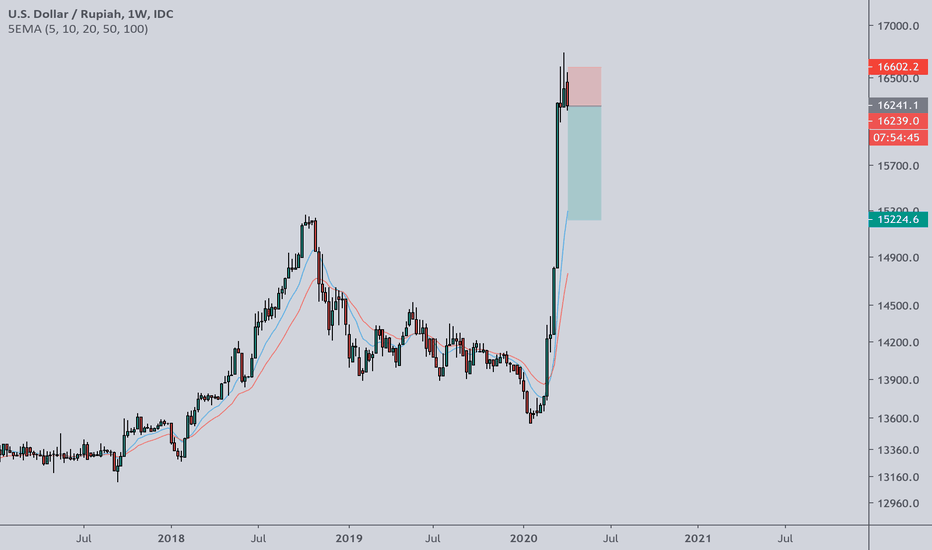
usd idr pullback area 15600 - 15400 rupiahOverall bisa dilihat usd idr ada didalam formasi big triangle dengan retest ath sebelumnya di area 6700 rupiah, kemungkinan pullback dalam beberapa minggu kedepan ada di area 15600 - 15400 rupiah atau line 0.786 area fibonacci retracement . Perhatikan faktor fundamental khususnya terkait krisis yg sedang terjadi, jika usd mampu menembus area 17000 rupiah per dollar, siap siap tampung dollar ya guys.
Di sisi lain usd idr juga membentuk ascending wedge (trend garis biru) dengan harga puncak di area 18000 rupiah per dollar, estimasi mencapai target wedge dalam 4 tahun kedepan berdasar perhitungan bagan, tepat dengan siklus krisis global /8tahun.
So...bukan harga barang yang turun, rupiahmu lemah!
Stay safe stay at home. Dirumah doeloe !!!!
IHSG: Are You On The BEAR or BULL Side?Jika banyak sekuritas mendowngrade target IHSG, kami masih dalam posisi dengan target IHSG kami dari sejak awal tahun. Siapa yang akan benar? Market is always right.
IHSG saat ini menguji area - area resistennya di kisaran 6350 - 6470. Jika area - area ini dapat dilampaui, terbuka peluang bagi IHSG untuk kembali bergerak bullish dengan target kenaikan di 6900 dengan minor target 6633. Jika momentum kenaikan dapat dipertahankan, maka target utama ada di 7300.
Apa yang bisa membuat momentum kenaikan menjadi kuat? Cek ulasan USDIDR kami.
Are you on the BEAR or BULL side?
By GaleriSaham
Final trend confirmation for Indonesian Rupiah?The movement of US Dollar to Rupiah seems in the end of consolidation? After 3x the price breaks the trend line, according to the fan principle theory, the third will be a strong confirmation. We see that US dollar will strengthen toward Rupiah to upper consolidation range 14525 - 14550. If US Dollar then breaks 14550, seems the USDIDR will rally.
#galerisaham | Global Market
Rising Wedge on Weekly TF- Currently the price is moving inside the Rising Wedge on weekly timeframe and looks like it trying to broke the 1st trendline. Invalidated if the price managed to hold 13200 price for a long time and expect a sideway price movement in between fibonacci line .
- Breaking the 2nd up trend line (bright yellow line) would be devastating for this currency..
let see how this plays out. peace..
USDIDR Points Towards Continuation of WeaknessThe USDIDR also trends with its peers in Singapore and Thailand for continued downward movement. Although weakness in the past week is showing weaker signals in RSI and the bull bear crowd sentiment indicator, nearly all exponential moving averages suggest further continuation of the trend. In spite of this, price action is fast approaching a 2018 trend line which could reappear as long-term support and a reversal, although this is not likely to come to fruition for a number of trading days unless volatility really picks up.
If you would like to see more charts check out www.tradingview.com or if you want more analysis go to www.linkedin.com
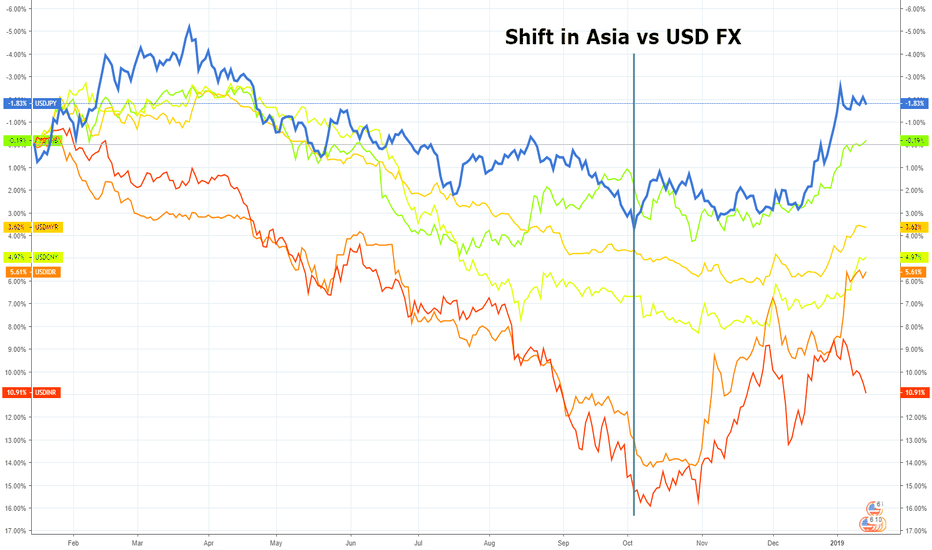
Asia Forex: Comparison chart vs USDFor the purposes of taking a broader view of movements in forex markets...
Chart: 1-year performance of JPY, THB, MYR, CNY, IDR, INR vs the USD (inverted)
Since October, there has been a marked improvement in the performance of Asian currencies. The change means Asian currencies have paired losses over the last 12 months, with the yen and Tai bot entering the black.
A relief rally or turning point for Asia FX?
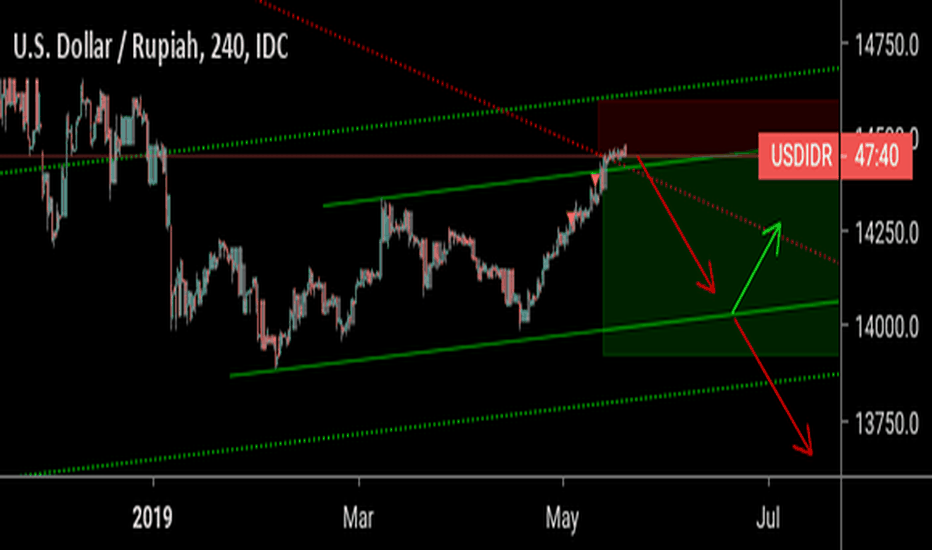
USD / IDR time for a correction - because everything correctsThis is 100% technical analysis and 0% fundamental analyis. I would like to see for myself if TA can stand on its own.
By my count there is some strong bearish divergence shown on the RSI. Three higher highs have translated to lower highs on the RSI, indicating slowing momentum. When that slowing momentum is also coincident with what seems to be (I only spent 5 mins on it) wave 5 of 5. Since this is the first time I have looked up the currency pair on a technical chart it would be unlikely that I did so "at the top" but right now it is a plausible scenaro.
Saying that I would normally expect wave 5 to at least reach the top of the channel, and of course, normally top the wave 3 high as well. However, it seems a real posibility that it will fall short. The IDR has been weakening for years and a correction may be warranted - especially if the USD loses strength.
What will happen now is the start of a small correction (to start with to the lower trend line) but keep an eye on signs that the correction may be steeper or deeper. If the lower trend-line is broken with momentum and volume I would stay in the short trade. Because wave 5 (if it turns out to be the wave 5 top) is truncated (lower) it would indicate there is significant downward pressure and the correction could be swift.
My other scenario is a lot more bullish; that this is just sub-wave 1 of the larger degree 5th wave up. This would mean all time highs for IDR in a year or two.
I am not "trading" IDR but keeping an eye on it. I don't trade FOREX - mainly commodities like bitcoin, silver, gold, and crude. This is published for my own education. Comments welcome. Let's see how it turns out.


