USDJPY – From Shorts to Longs!USDJPY has been trading within a rising channel, maintaining an overall bullish structure in the medium term.
🔍 Current Setup:
We previously looked for shorts from the weekly resistance near the upper bound of the channel — and price reacted as anticipated.
Now, we are waiting for a retest of the lower bound, which is the intersection of the lower trendline and the daily support area, to look for trend-following longs in line with the prevailing bullish trend.
📌 Plan:
Shorts have already played out from the upper bound.
Next, watch for bullish reversal signals around the lower trendline + support confluence for potential long entries.
🎯 Patience is key — let price come to you before taking action.
📚 Always follow your trading plan regarding entry, risk management, and trade management.
Good luck!
All Strategies Are Good; If Managed Properly!
~Richard Nasr
Disclosure: I am part of Trade Nation's Influencer program and receive a monthly fee for using their TradingView charts in my analysis.
USDJPY

USD/JPY Poised for Breakout as Fundamentals & Technicals AlignUSDJPY is entering a critical juncture where both macroeconomic conditions and price structure are pointing toward a potential bullish continuation. The pair has been consolidating just under a descending trendline after a sharp drop from July’s highs, but strong US fundamentals, a persistently dovish Bank of Japan, and upcoming political catalysts are creating the perfect environment for an upside breakout. If buyers can reclaim momentum above near-term resistance, the path toward retesting multi-month highs appears open, with yen crosses likely to follow the lead.
Technical Analysis (4H Chart)
Price is consolidating around 147.46 after falling from the 150.91 high.
A descending trendline from the late-July peak is being tested. A confirmed breakout would likely accelerate bullish momentum.
Key upside targets:
148.96 – immediate resistance & short-term target (previous swing high).
150.91 – major resistance at July’s high.
Stop-loss at 146.43 safeguards against deeper retracements.
The structure reflects a series of bullish continuation patterns (flags, breakouts, retracements).
Fundamental Analysis
Current Bias: Bullish
USD Strength: Strong US data and anticipation of Trump’s “major” economic announcement are lifting the dollar.
JPY Weakness: Despite better-than-expected Japan Eco Watchers Survey, the BoJ’s ultra-loose stance continues to suppress yen demand.
Rate Differentials: Still heavily in USD’s favor, sustaining upward pressure on USD/JPY.
Risk Sentiment: Even with mild geopolitical tensions, USD’s safe-haven appeal is preventing JPY from benefiting.
Risks:
Disappointing US political announcements.
Hawkish surprises from the BoJ.
Sharp swings in risk sentiment favoring the yen.
Key News/Events Ahead:
Trump’s economic policy reveal.
US CPI & PPI releases.
BoJ policy signals or commentary.
Leader/Lagger Dynamics:
USDJPY is the leader for yen crosses, often setting the tone for GBPJPY, AUDJPY, and CHFJPY.
Summary:
USDJPY’s bullish outlook is reinforced by the combination of favorable fundamentals and a technical setup pointing toward a breakout. A move above 147.80–148.00 could open the door to 148.96 in the short term and 150.91 in the medium term. With yen crosses closely tied to USDJPY’s movements, this pair’s breakout could spark broader JPY weakness across the board, making it a pivotal chart to watch in the days ahead.

USD-JPY Local Short! Sell!
Hello,Traders!
USD-JPY made a retest
Of the horizontal resistance
Of 148.101 from where we
Are already seeing a bearish
Reaction so we will be
Expecting a further
Bearish move down
Sell!
Comment and subscribe to help us grow!
Check out other forecasts below too!
Disclosure: I am part of Trade Nation's Influencer program and receive a monthly fee for using their TradingView charts in my analysis.

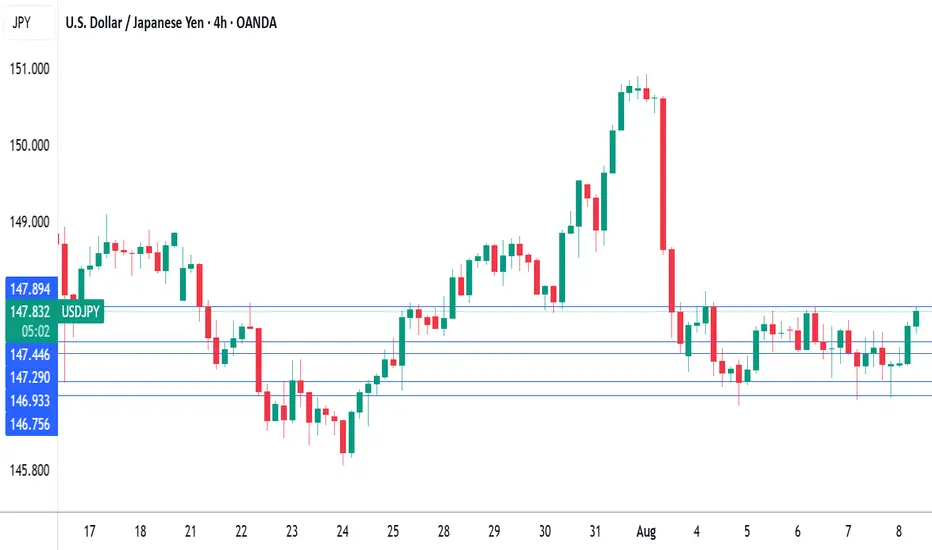
BoJ minutes indicate potential rate hike, yen slipsThe Japanese yen is lower on Friday. USD/JPY is trading at 147.66 in the North American session, up 0.38% on the day.
The Bank of Japan minutes from the July 31 meeting signaled that the BoJ remains committed to further rate hikes. This reiterates comments from BOJ President Ueda that he will raise rates, provided that growth and inflation are in line with the BoJs forecasts.
At the same time, members expressed concern about the uncetainty due to tariffs. Members acknowledged that the recent trade agreement between the US and Japan had reduced uncertainty and had made it more likely that inflation would be sustainable at the 2% target. Still, members noted that "high uncertainties remain regarding trade policies and their impact".
On Thursday, the government lowered its growth forecast for this fiscal year due to US tariffs and sticky inflation, which has hurt capital expenditure and consumer demand.
Speaking of consumer demand, Japan's household spending nosedived in in June with a decline of 5.2%. This was a sharp reversal from the May gain of 4.6% and well below the market estimate of -3.0%. Year-on-year, household spending eased to 1.3%, compared to 4.7% in May and shy of the market estimate of 2.6%.
The Federal Reserve is on track to lower rates in September, which would mark the first rate reduction since December 2024. Last week's soft July employment report saw nonfarm payrolls fall to 73 thousand. This was well short of the market estimate of 110 thousand and included sharp downward revisions to the May and June releases.
USD/JPY has pushed above resistance at 147.30 and is testing 147.45. Above, there is resistance at 147.89
1.4694 and 146.75 are the next support levels
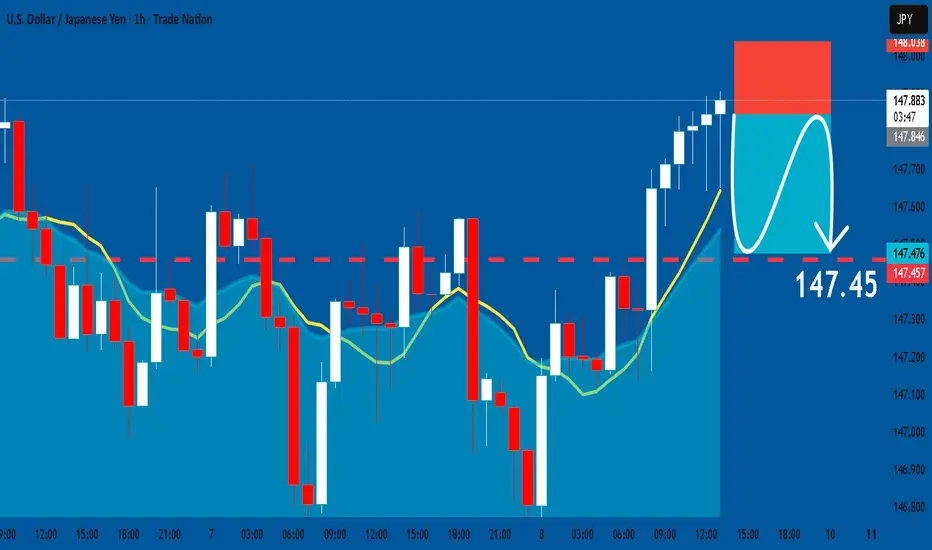
USDJPY: Short Trading Opportunity
USDJPY
- Classic bearish setup
- Our team expects bearish continuation
SUGGESTED TRADE:
Swing Trade
Short USDJPY
Entry Point - 147.84
Stop Loss - 148.03
Take Profit - 147.45
Our Risk - 1%
Start protection of your profits from lower levels
Disclosure: I am part of Trade Nation's Influencer program and receive a monthly fee for using their TradingView charts in my analysis.
❤️ Please, support our work with like & comment! ❤️
USDJPY Weakening or a Correction to the Uptrend✏️ OANDA:USDJPY is approaching the old Break out support zone. The convergence zone of the 2 EMA lines. If there is a sweep to the support zone at the beginning of the week, it will be an opportunity to buy to continue the bullish wave structure. When this 146.200 zone is broken, the uptrend will be broken and we have to wait for new momentum to determine the next trend.
📉 Key Levels
Support: 146.200-143.200
Resistance: 150.800-154.500
Buy zone 146.300 (Support & Trendline)
Buy zone 143.200 Strong support zone
Target 154.500
Leave your comments on the idea. I am happy to read your views.

USD Set To bounce? EUR/USD, USD/JPY, USD/CHFIt has been a week since the US dollar plunged following a weak NFP report. Given it has consolidated within a tight range near last week's low, alongside price action clues on EUR/USD, USD/JPY and USD/CHF, I suspect the dollar could bounce before its losses resume.
Matt Simpson, Market Analyst at City Index and Forex.com

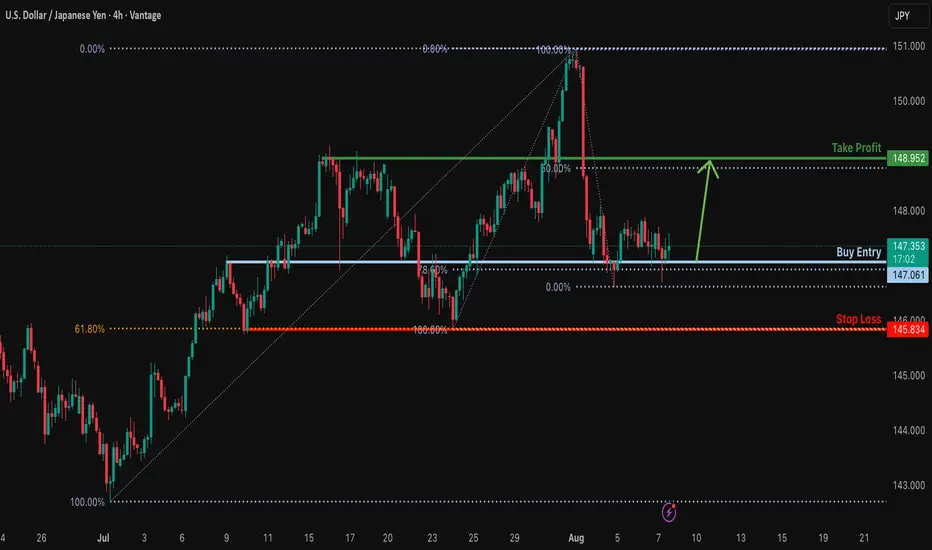
Bullish reversal?USD/JPY is reacting off the support level which is an overlap that aligns with the 78.6% Fibonacci retracement and could bounce from this level to our take profit.
Entry: 147.06
Why we like it:
There is an overlap support level that lines up with the 78.6% Fibonacci retracement.
Stop loss: 145.83
Why we like it:
There is a multi-swing low support.
Take profit: 148.95
Why we like it:
There is a pullback resistance level that is slightly above the 50% Fibonacci retracement.
Enjoying your TradingView experience? Review us!
Please be advised that the information presented on TradingView is provided to Vantage (‘Vantage Global Limited’, ‘we’) by a third-party provider (‘Everest Fortune Group’). Please be reminded that you are solely responsible for the trading decisions on your account. There is a very high degree of risk involved in trading. Any information and/or content is intended entirely for research, educational and informational purposes only and does not constitute investment or consultation advice or investment strategy. The information is not tailored to the investment needs of any specific person and therefore does not involve a consideration of any of the investment objectives, financial situation or needs of any viewer that may receive it. Kindly also note that past performance is not a reliable indicator of future results. Actual results may differ materially from those anticipated in forward-looking or past performance statements. We assume no liability as to the accuracy or completeness of any of the information and/or content provided herein and the Company cannot be held responsible for any omission, mistake nor for any loss or damage including without limitation to any loss of profit which may arise from reliance on any information supplied by Everest Fortune Group.
USDJPYLooking for buys for usdjpy as price is lined up for a potential run higher to take liquidity.

USD/JPY BEARS ARE STRONG HERE|SHORT
Hello, Friends!
We are targeting the 145.012 level area with our short trade on USD/JPY which is based on the fact that the pair is overbought on the BB band scale and is also approaching a resistance line above thus going us a good entry option.
Disclosure: I am part of Trade Nation's Influencer program and receive a monthly fee for using their TradingView charts in my analysis.
✅LIKE AND COMMENT MY IDEAS✅

XAU/USD | Gold at a Turning Point – Breakout or Breakdown Ahead?By analyzing the gold chart on the 4-hour timeframe, we can see that after our last analysis, gold continued its correction and dropped to $3358. It’s currently trading around $3367, and for the bullish scenario to remain valid, we need to see price hold above $3358 and soon close above $3370. If this happens, another bullish move could follow.
Otherwise, if gold breaks and stabilizes below $3358, this scenario will be invalidated, and the alternative outlook suggests further downside toward $3349 and $3339. This analysis will be updated — and don’t forget to show your support, friends!
Please support me with your likes and comments to motivate me to share more analysis with you and share your opinion about the possible trend of this chart with me !
Best Regards , Arman Shaban

USDJPY – DAILY FORECAST Q3 | W32 | D7 | Y25📊 USDJPY – DAILY FORECAST
Q3 | W32 | D7 | Y25
Daily Forecast 🔍📅
Here’s a short diagnosis of the current chart setup 🧠📈
Higher time frame order blocks have been identified — these are our patient points of interest 🎯🧭.
It’s crucial to wait for a confirmed break of structure 🧱✅ before forming a directional bias.
This keeps us disciplined and aligned with what price action is truly telling us.
📈 Risk Management Protocols
🔑 Core principles:
Max 1% risk per trade
Only execute at pre-identified levels
Use alerts, not emotion
Stick to your RR plan — minimum 1:2
🧠 You’re not paid for how many trades you take, you’re paid for how well you manage risk.
🧠 Weekly FRGNT Insight
"Trade what the market gives, not what your ego wants."
Stay mechanical. Stay focused. Let the probabilities work.
FX:USDJPY

Fundamental Market Analysis for August 7, 2025 USDJPYEvent to watch today:
15:30 EET. USD - Unemployment Claims
USDJPY:
The yen is benefitting from falling Treasury yields and mounting expectations that the Bank of Japan could move to a token rate hike as early as this autumn. Minutes of the 30-31 July meeting revealed that two board members want tightening on the table should inflation stay above 2 %. In parallel, the Finance Ministry has expanded its FX-intervention envelope to ¥20 trn, signalling a readiness to cap USDJPY below 150.
The U-S dollar stays under pressure: weak labour data increases the odds of a September Fed cut, while a scandal over the dismissal of the Bureau of Labor Statistics head fuels doubts about data integrity. The 10-year U-S yield has slid to 3.95 %, narrowing the spread with JGBs and dulling the dollar’s carry appeal.
A restraining factor is caution within Japan’s ruling coalition, which warns against rapid tightening given the threat of new U-S tariffs. Even so, the overall risk balance still favours yen strength thanks to potential intervention and the likelihood of a BoJ policy pivot, keeping the pair biased lower.
Trade recommendation: SELL 147.550, SL 147.850, TP 146.500

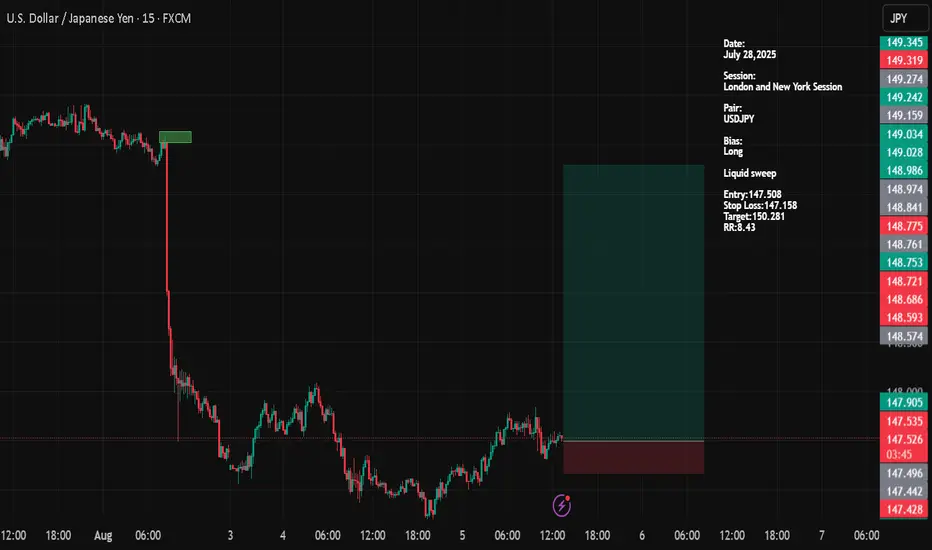
USDJPYDate:
August 05,2025
Session:
New York Session
Pair:
USDJPY
Bias:
Long
Liquid sweep
Entry:147.508
Stop Loss:147.158
Target:150.281
RR:8.43
USD/JPY 30Min Engaged ( Bullish Reversal Entry Detected )Time Frame: 30-Minute Warfare
Entry Protocol: Only after volume-verified breakout
🩸Bullish Reversal : 147.120
➗ Hanzo Protocol: Volume-Tiered Entry Authority
➕ Zone Activated: Dynamic market pressure detected.
The level isn’t just price — it’s a memory of where they moved size.
Volume is rising beneath the surface — not noise, but preparation.
🔥 Tactical Note:
We wait for the energy signature — when volume betrays intention.
The trap gets set. The weak follow. We execute.

USDJPY: Long Trade Explained
USDJPY
- Classic bullish formation
- Our team expects growth
SUGGESTED TRADE:
Swing Trade
Buy USDJPY
Entry Level - 147.26
Sl - 147.12
Tp - 147.53
Our Risk - 1%
Start protection of your profits from lower levels
Disclosure: I am part of Trade Nation's Influencer program and receive a monthly fee for using their TradingView charts in my analysis.
❤️ Please, support our work with like & comment! ❤️

USDJPY resistance at 148.90The USDJPY pair is currently trading with a bearish bias, aligned with the broader downward trend. Recent price action shows a retest of the falling resistance, suggesting a temporary relief rally within the downtrend.
Key resistance is located at 148.90, a prior consolidation zone. This level will be critical in determining the next directional move.
A bearish rejection from 148.90 could confirm the resumption of the downtrend, targeting the next support levels at 146.10, followed by 145.40 and 144.60 over a longer timeframe.
Conversely, a decisive breakout and daily close above 148.90 would invalidate the current bearish setup, shifting sentiment to bullish and potentially triggering a move towards 149.75, then 150.20.
Conclusion:
The short-term outlook remains bearish unless the pair breaks and holds above 148.90. Traders should watch for price action signals around this key level to confirm direction. A rejection favours fresh downside continuation, while a breakout signals a potential trend reversal or deeper correction.
This communication is for informational purposes only and should not be viewed as any form of recommendation as to a particular course of action or as investment advice. It is not intended as an offer or solicitation for the purchase or sale of any financial instrument or as an official confirmation of any transaction. Opinions, estimates and assumptions expressed herein are made as of the date of this communication and are subject to change without notice. This communication has been prepared based upon information, including market prices, data and other information, believed to be reliable; however, Trade Nation does not warrant its completeness or accuracy. All market prices and market data contained in or attached to this communication are indicative and subject to change without notice.

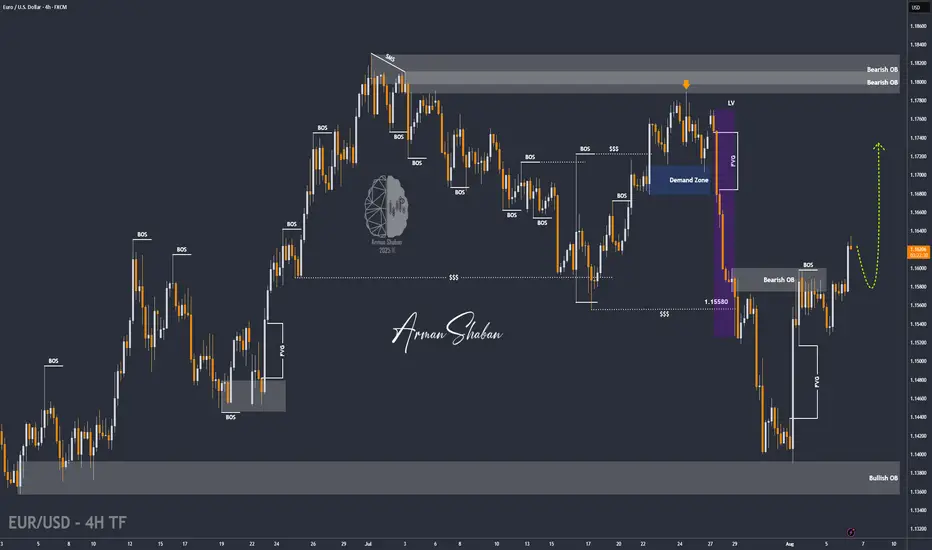
EUR/USD | Holding Above 1.16 Could Unlock More Upside! (READ IT)By analyzing the EURUSD chart on the 4-hour timeframe, we can see that the price reacted beautifully to all the marked zones on the chart. Especially after reaching the 1.14 demand area, it experienced a strong bullish move, rallying over 200 pips to hit 1.16. Currently, EURUSD is trading around 1.16220, and if it holds above the 1.16 level, we can expect further upside. The next bullish targets are 1.16435, 1.16780, 1.17100, and 1.17500.
Please support me with your likes and comments to motivate me to share more analysis with you and share your opinion about the possible trend of this chart with me !
Best Regards , Arman Shaban
USDJPY Will Fall! Sell!
Take a look at our analysis for USDJPY.
Time Frame: 12h
Current Trend: Bearish
Sentiment: Overbought (based on 7-period RSI)
Forecast: Bearish
The price is testing a key resistance 147.518.
Taking into consideration the current market trend & overbought RSI, chances will be high to see a bearish movement to the downside at least to 144.599 level.
P.S
The term oversold refers to a condition where an asset has traded lower in price and has the potential for a price bounce.
Overbought refers to market scenarios where the instrument is traded considerably higher than its fair value. Overvaluation is caused by market sentiments when there is positive news.
Disclosure: I am part of Trade Nation's Influencer program and receive a monthly fee for using their TradingView charts in my analysis.
Like and subscribe and comment my ideas if you enjoy them!

DeGRAM | USDJPY will retest the support level📊 Technical Analysis
● USDJPY is riding an ascending channel after a bullish breakout above the long-term descending trendline and successful retests of the 144.9–146.6 zone as support.
● Price is carving higher highs and higher lows, with the current bullish pennant pointing to a measured move toward the 150.8 resistance if 147.2 is breached on strong momentum.
💡 Fundamental Analysis
● The yen remains under pressure as US labor data stays firm and Fed officials hint at fewer cuts, reinforcing US-Japan rate divergence.
● BOJ’s dovish tone in recent speeches and widening trade deficit further weigh on JPY.
✨ Summary
Buy 145.2–146.2; confirmation >147.2 targets 150.8. Invalidation below 142.8 support zone.
-------------------
Share your opinion in the comments and support the idea with like. Thanks for your support!

Volatile Times for GBPJPY: What’s Going On Behind the Moves?Good morning, Guys,
I’m anticipating a new short opportunity on GBPJPY once the pair reaches my sell zone level. From there, my target is set at 197.934.
Every like from you is what truly motivates me to keep sharing these insights.
Massive thanks to everyone who shows love and support!

USDJPY – DAILY FORECAST Q3 | W32 | D6 | Y25📊 USDJPY – DAILY FORECAST
Q3 | W32 | D6 | Y25
Daily Forecast 🔍📅
Here’s a short diagnosis of the current chart setup 🧠📈
Higher time frame order blocks have been identified — these are our patient points of interest 🎯🧭.
It’s crucial to wait for a confirmed break of structure 🧱✅ before forming a directional bias.
This keeps us disciplined and aligned with what price action is truly telling us.
📈 Risk Management Protocols
🔑 Core principles:
Max 1% risk per trade
Only execute at pre-identified levels
Use alerts, not emotion
Stick to your RR plan — minimum 1:2
🧠 You’re not paid for how many trades you take, you’re paid for how well you manage risk.
🧠 Weekly FRGNT Insight
"Trade what the market gives, not what your ego wants."
Stay mechanical. Stay focused. Let the probabilities work.
FX:USDJPY

USDJPY Bullish Momentum Continues ? Hello traders, what do you think about USDJPY?
As of now, USDJPY is showing a slight upward movement after the recent correction. The price is trading around 147.59, not changing much since the beginning of the session.
The Japanese yen remains under pressure due to Japan’s slow recovery and ongoing economic challenges, giving USD an edge to capitalize on recent gains.
From a technical standpoint, USDJPY is moving in an ascending wedge pattern. After testing the trendline support near 147, the pair could be headed toward the psychological target of 150, or even higher towards the upper trendline boundary in the coming days.
Keep an eye on the price action near key resistance levels as the market continues to evaluate global economic factors, especially the upcoming US jobs data and Fed policy outlook.
What’s your take on USDJPY? Do you expect this pair to rise further? Let me know in the comments below!
