Bullish bounce off 61.8% Fibonacci support?USD/JPY is falling towards the support level which is a pullback support that aligns with the 61.8% Fibonacci retracement and could bounce from this level to our take profit.
Entry: 143.43
Why we like it:
There is a pullback support level that aligns with the 61.8% Fibonacci retracement.
Stop loss: 142.88
Why we like it
There is a pullback support level that lines up with the 61.8% Fibonacci projection.
Take profit: 144.38
Why we like it:
There is an overlap resistance level.
Enjoying your TradingView experience? Review us!
Please be advised that the information presented on TradingView is provided to Vantage (‘Vantage Global Limited’, ‘we’) by a third-party provider (‘Everest Fortune Group’). Please be reminded that you are solely responsible for the trading decisions on your account. There is a very high degree of risk involved in trading. Any information and/or content is intended entirely for research, educational and informational purposes only and does not constitute investment or consultation advice or investment strategy. The information is not tailored to the investment needs of any specific person and therefore does not involve a consideration of any of the investment objectives, financial situation or needs of any viewer that may receive it. Kindly also note that past performance is not a reliable indicator of future results. Actual results may differ materially from those anticipated in forward-looking or past performance statements. We assume no liability as to the accuracy or completeness of any of the information and/or content provided herein and the Company cannot be held responsible for any omission, mistake nor for any loss or damage including without limitation to any loss of profit which may arise from reliance on any information supplied by Everest Fortune Group.
USDJPY

Bearish continuation?USD/CAD has rejected off the resistance level which is a pullback resistance and could drop from this level to our take profit.
Entry: 1.3595
Why we like it:
There is a pullback resistance level.
Stop loss: 1.3644
Why we like it:
There is an overlap resistance level that aligns with the 50% Fibonacci retracement.
Take profit: 1.3545
Why we like it:
There is a support level at the 100% and the 78.6% Fibonacci projection.
Enjoying your TradingView experience? Review us!
Please be advised that the information presented on TradingView is provided to Vantage (‘Vantage Global Limited’, ‘we’) by a third-party provider (‘Everest Fortune Group’). Please be reminded that you are solely responsible for the trading decisions on your account. There is a very high degree of risk involved in trading. Any information and/or content is intended entirely for research, educational and informational purposes only and does not constitute investment or consultation advice or investment strategy. The information is not tailored to the investment needs of any specific person and therefore does not involve a consideration of any of the investment objectives, financial situation or needs of any viewer that may receive it. Kindly also note that past performance is not a reliable indicator of future results. Actual results may differ materially from those anticipated in forward-looking or past performance statements. We assume no liability as to the accuracy or completeness of any of the information and/or content provided herein and the Company cannot be held responsible for any omission, mistake nor for any loss or damage including without limitation to any loss of profit which may arise from reliance on any information supplied by Everest Fortune Group.

USDJPY – 4H . [[ TRIANGLE PATTERN ]]Technical Breakdown:
Symmetrical triangle pattern clearly formed with clean ABCDE wave structure.
The price has broken out from the upper resistance (trendline), confirming a bullish breakout scenario.
Next key area to watch is the supply zone near 145.800 – 146.200, where price may either:
Face resistance and retrace,
Or break through for continuation.
---
🔍 Key Levels:
Support Base (Retest zone): ~143.000
Breakout Entry Trigger: Above 144.200
Supply Zone Target: 145.800 – 146.200
Invalidation Level (Break Below Triangle): <142.500
---
🧠 Analysis Insight:
This is a classic triangle consolidation breakout, with price respecting both ascending and descending boundaries before thrusting upward.
Look for possible pullback retest entries before continuation to the supply zone.
Volume and momentum confirmation on breakout is key for sustainability.
---
🎯 Strategy Note:
Use low-risk entry setups on breakout retest.
Ideal for scalp to swing trades, with strong risk-reward structure.

USD/JPY) Bearish trend analysis Read The ChaptianSMC trading point update
Technical analysis iUSD/JPY on the 30-minute timeframe, showing a rejection from resistance zones and a potential move toward lower support levels.
---
Analysis Breakdown
Technical Components:
1. Resistance Zones:
Primary Resistance: Near 145.500 (upper yellow box), which has previously been rejected multiple times (red arrows).
FVG (Fair Value Gap) Resistance Level: Around 144.400, also acting as strong resistance, especially near the EMA 200.
2. Downtrend Line:
The price is moving below a downward trendline, respecting bearish structure.
Last rejection from both the trendline and FVG zone confirms selling pressure.
3. EMA 200 (144.075):
Price is hovering around this level, showing indecision.
Bearish bias remains unless price breaks and holds above it.
4. Target Zone:
A clearly marked support level around 142.543, shown as the bearish target.
Includes multiple event markers (potential news catalysts or key dates), suggesting added volatility.
5. RSI (14):
Currently near 55.23, with a prior rejection from higher RSI levels.
Bearish divergence not clear, but no overbought conditions.
---
Bearish Idea Summary:
Thesis: Rejection from resistance zones + trendline + EMA suggests continuation to downside.
Expecting: Price to either:
Retest the upper resistance zone (around 145.000–145.500) and reject again, or
Break below current levels and continue lower toward 142.543.
---
Trade Idea Concept:
Entry Option 1: Sell on confirmed rejection from FVG zone or upper resistance.
Entry Option 2: Sell on break and retest below 144.000.
Target: 142.543 (support zone).
Stop Loss: Above the resistance zone or trendline (e.g., >145.600).
Mr SMC Trading point
Risks to Watch:
Invalidation: Clean break and close above 145.500 would invalidate the bearish setup.
News Impact: Note the icons near the target zone – monitor economic releases around that time.
---
Please support boost 🚀 this analysis)

USDJPY Trading RangeUSDJPY saw some corrections late on Friday. Overall, the pair remains sideways in a wide range of 143,000-145,100 and has yet to establish a clear continuation trend.
The wider band in the sideways trend is extended at 146,000 and 142,000.
The trading strategy will be based on the band that is touched.
Pay attention to the breakout as it may continue the strong trend and avoid trading against the trend when breaking.
Support: 143,000, 142,000
Resistance: 145,000, 146,000

Nasdaq Oro EurUsd UsdJpyPost analysis of the entries this Friday, market compress the week and today gave us the respite to have a good weekend

Dollar Momentum Fades | Can 143.07 Hold as Support?USDJPY – Dollar Momentum Fades | Can 143.07 Hold as Support?
🌍 Fundamental & Macro Outlook
USDJPY has faced strong downside pressure recently as risk-off sentiment boosts demand for the Japanese Yen, following escalating tensions between Israel and Iran.
The US Dollar Index (DXY) rallied on geopolitical concerns but is struggling to sustain momentum near the 98.30 resistance zone.
Despite the Bank of Japan's ultra-loose monetary policy, JPY is acting as a safe haven in current global risk conditions.
Traders are awaiting next week’s monetary policy decisions from both the Federal Reserve and the Bank of Japan. Both central banks are expected to keep rates unchanged, but forward guidance could spark major volatility.
According to UOB Group, the dollar's recovery potential is weakening, and further downside toward 142.20 is possible, unless price reclaims the 144.60–144.95 resistance zone.
📉 Technical Analysis – H1 Chart
🔸 Trend Structure
USDJPY remains in a mild downtrend, but price has bounced from the 143.074 key support zone.
A recovery towards 144.624 is in play, but that zone must be cleared for bullish continuation.
🔸 EMA Outlook
Price is currently testing the EMA 89 and 200 — a rejection from this area could trigger another move down.
EMA 13 & 34 are now acting as short-term dynamic support.
🔸 Key Price Zones
Resistance: 144.60 – 145.26
Support: 143.07 – 142.20
🧠 Market Sentiment
Risk aversion continues to dominate as geopolitical headlines drive sentiment.
The Yen is benefitting from capital protection flows despite Japan’s dovish stance.
Large funds may be starting to hedge by rotating into JPY from elevated USD levels.
🎯 Trading Scenarios for June 13
📌 Scenario 1 – Short Setup (Rejection at Resistance)
Entry: 144.60 – 144.90
Stop-Loss: 145.30
Take-Profit: 143.60 → 143.07 → 142.50
📌 Scenario 2 – Long Setup (Rebound from Support)
Entry: 143.10 – 143.20
Stop-Loss: 142.70
Take-Profit: 144.00 → 144.60
✅ Wait for confirmation at key levels — avoid trading in the middle of the range when volatility is headline-driven.
✅ Conclusion
USDJPY remains trapped between strong resistance at 145.26 and buying interest at 143.07. If risk sentiment persists, the Yen may continue to strengthen. However, central bank decisions next week (Fed & BoJ) will be the major catalysts for any medium-term breakout.

USDJPY Strong support formed. Excellent buy opportunity.The USDJPY pair is trading within a Channel Down since the start of the year but following the April 22 Low, it has been rising on Higher Lows. Today that trend-line was tested and again produced a rebound (so far).
Since the April 22 Low was very close to the 139.600 Support (from the September 16 2024 Low), there are higher probabilities that we will have a trend change to bullish, at least for the medium-term.
The natural Resistance now is the 1D MA200 (orange trend-line), so we will target just below it at 148.675 (Resistance 1).
-------------------------------------------------------------------------------
** Please LIKE 👍, FOLLOW ✅, SHARE 🙌 and COMMENT ✍ if you enjoy this idea! Also share your ideas and charts in the comments section below! This is best way to keep it relevant, support us, keep the content here free and allow the idea to reach as many people as possible. **
-------------------------------------------------------------------------------
Disclosure: I am part of Trade Nation's Influencer program and receive a monthly fee for using their TradingView charts in my analysis.
💸💸💸💸💸💸
👇 👇 👇 👇 👇 👇

Yen Rallies as Risk Aversion ReturnsThe Japanese yen strengthened to approximately 143 per dollar, marking a third consecutive day of gains as investors turned to safe-haven assets following Israel’s preemptive strike on Iran. The operation, aimed at nuclear facilities, heightened global risk aversion. Adding to market uncertainty were renewed U.S. tariff threats by Trump. Meanwhile, BoJ Governor Ueda reiterated the bank’s readiness to raise interest rates if inflation nears the 2% target.
Resistance is at 145.30, while support stands near 142.50.

Potential bearish drop?USD/JPY is rising towards the resistance level which is a pullback resistance that aligns with the 38.2% Fibonacci retracement and could drop from this level to ur take profit.
Entry: 144.11
Why we like it:
There is a pullback resistance level that lines up with the 38.2% Fibonacci retracement.
Stop loss: 145.07
Why we like it:
There is a pullback resistance level that lines up with the 78.6% Fibonacci retracement.
Take profit: 142.00
Why we like it:
There is a pullback support level that is slightly below the 78.6% Fibonacci projection.
Enjoying your TradingView experience? Review us!
Please be advised that the information presented on TradingView is provided to Vantage (‘Vantage Global Limited’, ‘we’) by a third-party provider (‘Everest Fortune Group’). Please be reminded that you are solely responsible for the trading decisions on your account. There is a very high degree of risk involved in trading. Any information and/or content is intended entirely for research, educational and informational purposes only and does not constitute investment or consultation advice or investment strategy. The information is not tailored to the investment needs of any specific person and therefore does not involve a consideration of any of the investment objectives, financial situation or needs of any viewer that may receive it. Kindly also note that past performance is not a reliable indicator of future results. Actual results may differ materially from those anticipated in forward-looking or past performance statements. We assume no liability as to the accuracy or completeness of any of the information and/or content provided herein and the Company cannot be held responsible for any omission, mistake nor for any loss or damage including without limitation to any loss of profit which may arise from reliance on any information supplied by Everest Fortune Group.

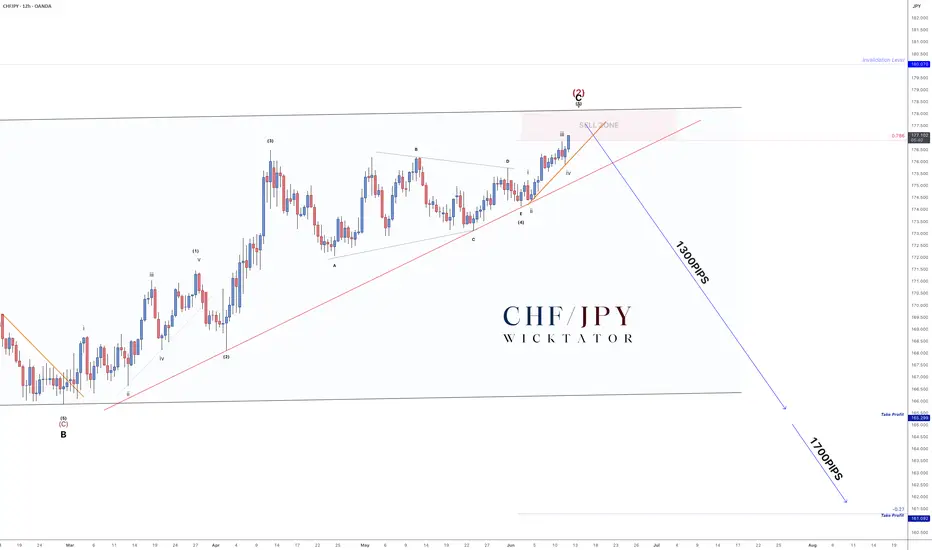
CHFJPY - How To Enter This MASSIVE 1700pip Swing Trade!As promised - here’s the lower timeframe breakdown after hitting 100+ likes.
We’re in wave 5, currently moving cleanly into the swing zone. Since wave 5 typically forms 5 subwaves, all we needed was to connect points 2 and 4 to draw our entry trendline.
Trade Idea:
- Entry on break of the orange trendline
- Stops above recent highs after entry
- Aggressive option: Enter inside the sell zone with stops above invalidation
Targets:
- TP1: 165.00 (≈1300 pips)
- TP2: 161.50 (≈1700 pips)
- Optional: Leave a runner for the longer swing move
Scroll down for the full 4H breakdown.
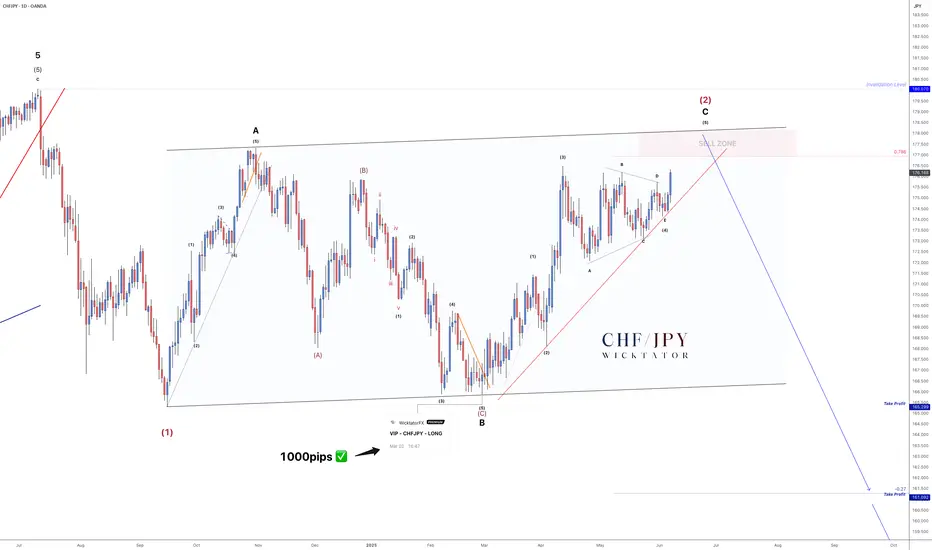
CHFJPY - 1700 Pip Reversal Incoming!The last time we looked at CHFJPY was back in October 2024, where we forecasted a large ABC correction. Fast forward to now - that correction is nearly complete!
We're currently in the 5th subwave of wave C, and everything points toward a massive drop setting up. We expect a move of at least 1500 pips.
On the Daily timeframe, structure is clear:
- Clean 5-3-5 ABC correction
- Price is approaching a key sell zone
- A clear entry trendline is in place — couldn’t ask for a cleaner setup
Trade Idea:
- Watch for rejection within the sell zone
- Aggressive entry: Inside sell zone with stops above invalidation
- Conservative entry: On break of trendline, stops above the break candle
Targets:
TP1: 165.00 (≈1300 pips)
TP2: 161.50 (≈1700 pips)
Optional: Leave a runner for a long-term swing
Let me know what you think in the comments.
See below for our last VIP setup for CHFJPY which played out perfectly. 1000pips secured!
Good luck and as always, trade safe!
USDJPY: Bottom formation successful. Strong buy.USDJPY is neutral on its 1D technical outlook (RSI = 46.191, MACD = -0.020, ADX = 12.744) as it is consolidating around the 1D MA50. This is the bottom formation process straight after rebounding on the S1 Zone. The wider pattern is a Descending Triangle and the bottom formation suggests that the new bullish wave is about to be initiated. Go long and target the 0.618 Fibonacci level (TP = 153.500).
## If you like our free content follow our profile to get more daily ideas. ##
## Comments and likes are greatly appreciated. ##

The US dollar retreats as the Japanese yen stages a resurgence.The USD/JPY has continued to decline, hitting a low of around 143.50 during the European session, marking a new weekly low. In terms of exchange rate dynamics, the key support level lies at 142.500, which has withstood multiple tests recently without being breached. A valid break below this level would open up further downward space, with the next support to be monitored at 141.78 (lower Bollinger Band). On the upside, resistance is seen near 145.500, a level that has repeatedly formed phased highs and suppressed price rebounds.
Humans need to breathe, and perfect trading is like breathing—maintaining flexibility without needing to trade every market swing. The secret to profitable trading lies in implementing simple rules: repeating simple tasks consistently and enforcing them strictly over the long term.

USD/JPY bounces off trend but risks tilted to downsideWith equity markets well off their earlier lows, the USD/JPY is also bouncing back, although it is not out of the woods yet with risks remaining tilted to the downside amid signs of weak inflation data and Trump's tariff threats.
Technically, the USD/JPY has been in consolidation mode, but a potential break of the trend line could trigger a sharp drop towards 142.00 and then 140.00.
For now, the trend line is providing support, but with the dollar slumping against other currencies, the USDJPY could also take a tumble should we see renewed weakness in stocks.
Resistance comes in at around 144.00.
By Fawad Razaqzada, market analyst with FOREX.com

USD/JPY) bearish Technical Analysis Read The captionSMC trading point update
Technical analysis of USD/JPY (U.S. Dollar vs. Japanese Yen) on the 4-hour timeframe. Here's a breakdown of the analysis:
---
Trend & Price Action
The chart shows a descending trendline connecting recent lower highs, indicating a downtrend.
Current price: 143.548
Price has recently rejected off the trendline and started to fall, suggesting continued bearish momentum.
A red arrow marks the rejection point, emphasizing a key resistance area.
---
Technical Indicators
EMA 200 (Exponential Moving Average): At 144.459 — the price is currently below the EMA, reinforcing the bearish outlook.
RSI (Relative Strength Index):
RSI (14) values: around 35.45, which is near the oversold threshold (30) but not quite there yet.
Indicates increasing bearish momentum but no reversal signal yet.
---
Support Levels Identified
1. Support Level (Target 1): ~142.280
First target point for bears. Likely to see some reaction or consolidation here.
2. Big Support Level (Target 2): ~140.382
A stronger, more significant support zone and a deeper bearish target if the first support breaks.
---
Bearish Target Scenario
The projected path (in black lines) suggests:
A further drop into the 142.280 zone.
If that breaks, a continuation toward the 140.382 level.
This suggests a swing trade setup favoring short positions if the price respects the current rejection zone.
Mr SMC Trading point
---
Conclusion
Bias: Bearish
Resistance Confirmed: Rejection from descending trendline and below EMA200.
Bearish Targets:
Short-term: 142.280
Medium-term: 140.382
Risk Management: Watch RSI for potential bullish divergence near the second support zone, which could indicate reversal or consolidation.
---
Please support boost 🚀 this analysis)

EURUSD BULLISH OR BARISH DETAILED ANALYSISEURUSD is showing strong bullish momentum after a clean bounce from the key support zone around 1.12. Price structure confirms higher lows and strong bullish candle formations on the daily chart, suggesting the bulls are in control. This recent move is backed by a textbook retest and rejection from the previous resistance-turned-support zone, giving confidence in a potential continuation toward the 1.19 level. With the current price trading near 1.15 and pushing higher, the market is positioned for a strong bullish wave in the coming sessions.
From a fundamental perspective, the Euro has gained fresh support after the ECB’s decision last week to proceed with a measured and data-dependent rate cut cycle. While the ECB delivered its first cut, the tone was cautious and far less dovish than anticipated, which kept EUR strength intact. On the USD side, traders are pricing in a more dovish outlook for the Federal Reserve, especially with recent CPI and PPI data pointing toward cooling inflation. This divergence in policy outlook continues to favor EURUSD upside in the medium term.
Technical indicators are also confirming the bullish bias. The pair is riding an ascending trendline, and momentum indicators like RSI remain in bullish territory without yet being overbought. A daily close above the 1.1550 area strengthens the case for a continuation move. The price is aiming for the next major resistance around 1.1770–1.19, where bulls are likely to take profit or scale out. Until then, dips are likely to be bought aggressively, as long as the 1.12 support remains intact.
This setup presents a high-probability opportunity in a trending market backed by both fundamentals and technical confluence. As long as the bullish structure holds, I remain long-biased on EURUSD with eyes on the 1.19 zone as the next key level. With increasing market interest, low volatility on the downside, and strong trend-following signals, this pair is set for a continued rally.

Fundamental Market Analysis for June 12, 2025 USDJPYThe Japanese Yen (JPY) is strengthening for the second day in a row against a weakened US Dollar (USD) and is moving further away from the two-week low reached the day before. The market's initial reaction to news of trade talks between the US and China faded rather quickly after US President Donald Trump threatened new tariffs. This, along with rising geopolitical tensions, curbs investors' appetite for risky assets and maintains the yen's status as a safe-haven currency.
In addition, the yen is further supported by expectations that the Bank of Japan (BoJ) may tighten monetary conditions amid signs of rising inflation in Japan. On the other hand, the US Dollar looks vulnerable near one-month lows as weaker US consumer inflation data released on Wednesday confirmed expectations that the Federal Reserve (Fed) will resume its rate-cutting cycle in September. This, in turn, led the USD/JPY pair to fall below 143.50 in the last hour.
Trade recommendation: SELL 143.30, SL 144.30, TP 141.30

USDJPY Will Go Up From Support! Long!
Please, check our technical outlook for USDJPY.
Time Frame: 1h
Current Trend: Bullish
Sentiment: Oversold (based on 7-period RSI)
Forecast: Bullish
The market is approaching a key horizontal level 143.827.
Considering the today's price action, probabilities will be high to see a movement to 144.499.
P.S
We determine oversold/overbought condition with RSI indicator.
When it drops below 30 - the market is considered to be oversold.
When it bounces above 70 - the market is considered to be overbought.
Disclosure: I am part of Trade Nation's Influencer program and receive a monthly fee for using their TradingView charts in my analysis.
Like and subscribe and comment my ideas if you enjoy them!

USD/JPY H1 | Bearish downtrend to extend deeper?USD/JPY is rising towards a pullback resistance and could potentially reverse off this level to drop lower.
Sell entry is at 144.10 which is a pullback resistance that aligns with the 23.6% Fibonacci retracement.
Stop loss is at 144.80 which is a level that sits above the 61.8% Fibonacci retracement and an overlap resistance.
Take profit is at 143.37 which is a pullback support.
High Risk Investment Warning
Trading Forex/CFDs on margin carries a high level of risk and may not be suitable for all investors. Leverage can work against you.
Stratos Markets Limited (tradu.com ):
CFDs are complex instruments and come with a high risk of losing money rapidly due to leverage. 63% of retail investor accounts lose money when trading CFDs with this provider. You should consider whether you understand how CFDs work and whether you can afford to take the high risk of losing your money.
Stratos Europe Ltd (tradu.com ):
CFDs are complex instruments and come with a high risk of losing money rapidly due to leverage. 63% of retail investor accounts lose money when trading CFDs with this provider. You should consider whether you understand how CFDs work and whether you can afford to take the high risk of losing your money.
Stratos Global LLC (tradu.com ):
Losses can exceed deposits.
Please be advised that the information presented on TradingView is provided to Tradu (‘Company’, ‘we’) by a third-party provider (‘TFA Global Pte Ltd’). Please be reminded that you are solely responsible for the trading decisions on your account. There is a very high degree of risk involved in trading. Any information and/or content is intended entirely for research, educational and informational purposes only and does not constitute investment or consultation advice or investment strategy. The information is not tailored to the investment needs of any specific person and therefore does not involve a consideration of any of the investment objectives, financial situation or needs of any viewer that may receive it. Kindly also note that past performance is not a reliable indicator of future results. Actual results may differ materially from those anticipated in forward-looking or past performance statements. We assume no liability as to the accuracy or completeness of any of the information and/or content provided herein and the Company cannot be held responsible for any omission, mistake nor for any loss or damage including without limitation to any loss of profit which may arise from reliance on any information supplied by TFA Global Pte Ltd.
The speaker(s) is neither an employee, agent nor representative of Tradu and is therefore acting independently. The opinions given are their own, constitute general market commentary, and do not constitute the opinion or advice of Tradu or any form of personal or investment advice. Tradu neither endorses nor guarantees offerings of third-party speakers, nor is Tradu responsible for the content, veracity or opinions of third-party speakers, presenters or participants.

Potential bearish drop?USD/JPY has reacted off the resistance level which is a pullback resistance and could drop from this level to our take profit.
Entry: 144.74
Why we like it:
There is a pullback resistance level.
Stop loss: 145.46
Why we like it:
There is a pullback resistance level.
Take profit: 143.94
Why we like it:
There is an overlap support level that lines up with the 50% Fibonacci retracement.
Enjoying your TradingView experience? Review us!
Please be advised that the information presented on TradingView is provided to Vantage (‘Vantage Global Limited’, ‘we’) by a third-party provider (‘Everest Fortune Group’). Please be reminded that you are solely responsible for the trading decisions on your account. There is a very high degree of risk involved in trading. Any information and/or content is intended entirely for research, educational and informational purposes only and does not constitute investment or consultation advice or investment strategy. The information is not tailored to the investment needs of any specific person and therefore does not involve a consideration of any of the investment objectives, financial situation or needs of any viewer that may receive it. Kindly also note that past performance is not a reliable indicator of future results. Actual results may differ materially from those anticipated in forward-looking or past performance statements. We assume no liability as to the accuracy or completeness of any of the information and/or content provided herein and the Company cannot be held responsible for any omission, mistake nor for any loss or damage including without limitation to any loss of profit which may arise from reliance on any information supplied by Everest Fortune Group.

USD/JPY – Short-term bullish structure within a larger downtrendThe USD/JPY pair has been in a well-established downtrend on the daily timeframe, showing consistent weakness over recent weeks.
Daily timeframe
The pair recently bounced from a significant and well-respected support zone around the $140.00 level. This area has historically provided a strong base for price, and once again, it appears to be holding as reliable support. Although the overall daily trend remains bearish, this bounce introduces the potential for a short-term retracement or consolidation phase.
Clear Rising Trendline on the 4H Chart
Zooming into the 4-hour timeframe, the price action shows a notable shift in momentum. A clear rising trendline has formed, acting as a dynamic support level and guiding the pair higher in the short term. As long as this trendline remains intact and unbroken, the bullish bias on the 4H remains valid. This upward move suggests a corrective phase within the broader daily downtrend, supported by increasing demand at higher lows.
Approaching Key Resistance — FVG and 0.786 Fibonacci Level
The pair is currently approaching a key resistance area near the $145.50 level. This zone aligns with the 4-hour Fair Value Gap (FVG) left by the previous strong downward move and coincides with the 0.786 Fibonacci retracement level, measured from the most recent swing high to swing low. A few days ago, price action briefly tested the lower boundary of this FVG but failed to fully fill the imbalance. Given the current momentum, another attempt to fill the entire FVG and test the 0.786 Fibonacci level is likely. This confluence of technical factors creates a strong resistance zone that could trigger significant price reactions, potentially resuming the broader downtrend.
Target Levels — Where to Look for Reversal or Profit-Taking
A sensible short-term target would be the previous lower high around the $144.00 level. This zone may serve as an initial resistance or take-profit area before price challenges the $145.50 resistance region. Additionally, if the pair breaks below the rising trendline on the 4H, this $144.00 zone could become a support level from which the pair might attempt another move higher.
Conclusion
To summarize, the USD/JPY pair remains in a broader daily downtrend but has shown signs of short-term strength after bouncing from the $140.00 support zone. On the 4-hour timeframe, bullish momentum is evident, supported by a rising trendline and upward movement toward a significant resistance area. Traders should closely watch the $145.50 zone, as it represents a confluence of the FVG and 0.786 Fibonacci retracement — both of which could act as a strong ceiling for price. Until the rising trendline breaks, the short-term outlook remains cautiously bullish, but the medium-term bias leans bearish if resistance holds and selling pressure resumes.
Disclosure: I am part of Trade Nation's Influencer program and receive a monthly fee for using their TradingView charts in my analysis.
Thanks for your support.
- Make sure to follow me so you don't miss out on the next analysis!
- Drop a like and leave a comment!

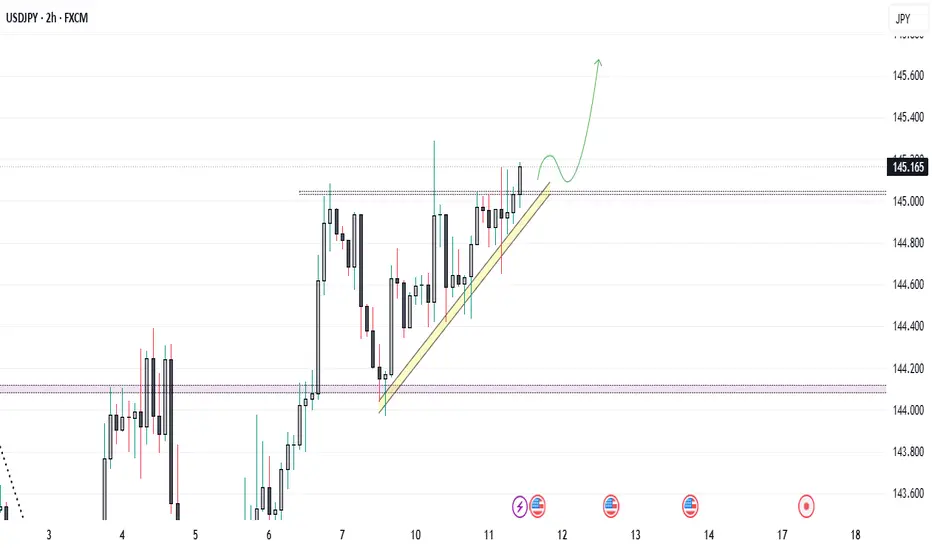
USD/JPY Gearing Up for Breakout ? Watch 145.20...USD/JPY Technical Setup – Bullish Continuation in Play?
USD/JPY is currently respecting a short-term ascending trendline, indicating sustained buying interest. The price consolidates just below a key resistance zone around 145.20, suggesting a potential breakout setup.
🔍 Key Technical Highlights:
* 📈 Trendline Support: Price has consistently respected this ascending trendline, forming higher lows—a strong bullish signal.
* 🔲 Resistance Zone: The 145.15–145.20 level has acted as a rejection zone previously. A breakout above this could invite momentum buying.
* 🕐 Consolidation Range: The market is coiling tightly just below resistance—watch for a volatility expansion.
* 🔮 Projection : If the price holds above the trendline and breaks 145.20 convincingly, we could see a bullish move towards 145.60+.
⚠️ Invalidation: A clean break below the trendline and 144.80 could shift the short-term bias back to neutral or bearish.