USDJPY Downside continuation below 145.85The USDJPY currency pair is displaying a bearish sentiment, consistent with the broader downward trend. Price action is currently in a sideways consolidation phase, suggesting indecision as the market pauses before a potential directional move.
Key Resistance Level: 145.85 — This level represents a prior intraday consolidation zone and serves as a key pivot for the next move.
Support Targets: If the pair rallies toward 145.85 and is rejected, expect renewed bearish momentum targeting:
143.00 (initial support)
142.25 (intermediate support)
141.40 (long-term support level)
On the other hand, a confirmed breakout and daily close above 145.85 would invalidate the bearish outlook and suggest growing bullish momentum. In that scenario, price could aim for:
146.85 (near-term resistance)
147.60 (extended upside target)
Conclusion:
USDJPY remains technically bearish within a consolidation pattern. A rejection from the 145.85 resistance zone would confirm a continuation toward lower support levels. However, a daily close above 145.85 would shift sentiment to bullish, potentially triggering a retest of higher resistance levels. Traders should closely monitor the price reaction around the 145.85 level to confirm direction.
This communication is for informational purposes only and should not be viewed as any form of recommendation as to a particular course of action or as investment advice. It is not intended as an offer or solicitation for the purchase or sale of any financial instrument or as an official confirmation of any transaction. Opinions, estimates and assumptions expressed herein are made as of the date of this communication and are subject to change without notice. This communication has been prepared based upon information, including market prices, data and other information, believed to be reliable; however, Trade Nation does not warrant its completeness or accuracy. All market prices and market data contained in or attached to this communication are indicative and subject to change without notice.
USDJPY

USDJPY: Short Trade with Entry/SL/TP
USDJPY
- Classic bearish setup
- Our team expects bearish continuation
SUGGESTED TRADE:
Swing Trade
Short USDJPY
Entry Point - 145.34
Stop Loss - 146.15
Take Profit - 144.07
Our Risk - 1%
Start protection of your profits from lower levels
Disclosure: I am part of Trade Nation's Influencer program and receive a monthly fee for using their TradingView charts in my analysis.
❤️ Please, support our work with like & comment! ❤️

Current USD/JPY Trend Analysis and Trading RecommendationsOn Wednesday, the USD/JPY attracted buyers for the second consecutive day, trading near 145.20 in the early European session, close to a two-week high. Japan's May CGPI rose 3.2% YoY, the slowest pace since September last year, potentially easing BOJ rate hike pressure and weakening the JPY. Additionally, optimism over a framework agreement in U.S.-China trade talks dented the JPY's safe-haven appeal. Technically, the price holds above the 200-period SMA on the 4-hour chart and breaches the 145.00 psychological level, with oscillators tilting bullish. A valid break above 145.30 (Tuesday's high) would confirm the bullish setup, targeting the 146.00 integer mark and 146.25-146.30 resistance zone.
USDJPY
buy@145.000-145.200
tp:145.600-146.000

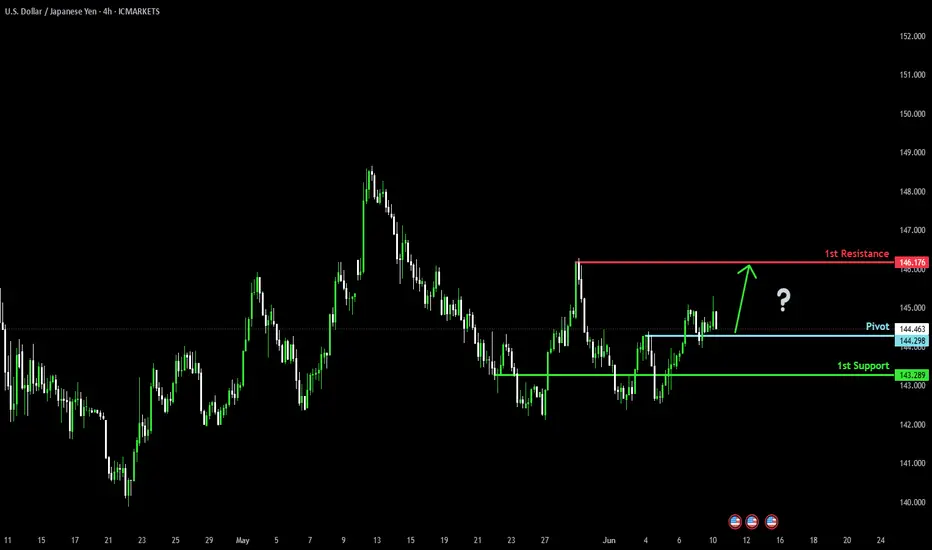
Bullish continuation?USD/JPY has reacted off the pivot which aligns with the 38.2% Fibonacci retracement and could rise to the 1st resistance which is a pullback resistance.
Pivot: 144.27
1st Support: 142.64
1st Resistance: 146.15
Risk Warning:
Trading Forex and CFDs carries a high level of risk to your capital and you should only trade with money you can afford to lose. Trading Forex and CFDs may not be suitable for all investors, so please ensure that you fully understand the risks involved and seek independent advice if necessary.
Disclaimer:
The above opinions given constitute general market commentary, and do not constitute the opinion or advice of IC Markets or any form of personal or investment advice.
Any opinions, news, research, analyses, prices, other information, or links to third-party sites contained on this website are provided on an "as-is" basis, are intended only to be informative, is not an advice nor a recommendation, nor research, or a record of our trading prices, or an offer of, or solicitation for a transaction in any financial instrument and thus should not be treated as such. The information provided does not involve any specific investment objectives, financial situation and needs of any specific person who may receive it. Please be aware, that past performance is not a reliable indicator of future performance and/or results. Past Performance or Forward-looking scenarios based upon the reasonable beliefs of the third-party provider are not a guarantee of future performance. Actual results may differ materially from those anticipated in forward-looking or past performance statements. IC Markets makes no representation or warranty and assumes no liability as to the accuracy or completeness of the information provided, nor any loss arising from any investment based on a recommendation, forecast or any information supplied by any third-party.

Bullish continuation?USD/JPY has bounced off the support level which is a pullback support and could rise from this level to our take profit.
Entry: 144.41
Why we like it:
There is a pullback support level.
Stop loss: 143.98
Why we like it:
There is an overlap support level that lines up with the 50% Fibonacci retracement.
Take profit: 146.07
Why we like it:
There is a pullback resistance level.
Enjoying your TradingView experience? Review us!
Please be advised that the information presented on TradingView is provided to Vantage (‘Vantage Global Limited’, ‘we’) by a third-party provider (‘Everest Fortune Group’). Please be reminded that you are solely responsible for the trading decisions on your account. There is a very high degree of risk involved in trading. Any information and/or content is intended entirely for research, educational and informational purposes only and does not constitute investment or consultation advice or investment strategy. The information is not tailored to the investment needs of any specific person and therefore does not involve a consideration of any of the investment objectives, financial situation or needs of any viewer that may receive it. Kindly also note that past performance is not a reliable indicator of future results. Actual results may differ materially from those anticipated in forward-looking or past performance statements. We assume no liability as to the accuracy or completeness of any of the information and/or content provided herein and the Company cannot be held responsible for any omission, mistake nor for any loss or damage including without limitation to any loss of profit which may arise from reliance on any information supplied by Everest Fortune Group.

Investors Await Tariff Negotiation News with Bated BreathThe USD/JPY has lacked a clear direction for the second consecutive day, with a doji pattern on the daily chart highlighting investor indecision. As Sino-US representatives are currently negotiating a trade agreement, the market is temporarily reluctant to bet on a directional move. So long as prices remain within the Kumo cloud, a sideways trend is expected in the short term, as Monday's strong rebound from intraday lows and today's failed upside attempt both support this scenario. A clear break of either boundary of the daily Kumo cloud would unleash a more definitive directional signal. Although optimism over Sino-US trade talks is supporting the US dollar, the current momentum is insufficient to drive a stronger rally.
Humans need to breathe, and perfect trading is like breathing—maintaining flexibility without needing to trade every market swing. The secret to profitable trading lies in implementing simple rules: repeating simple tasks consistently and enforcing them strictly over the long term.
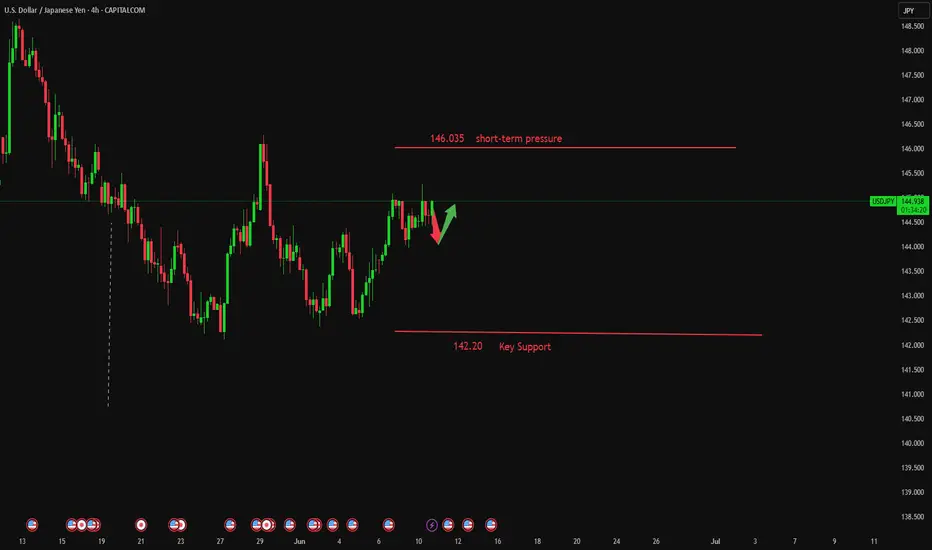
Storm Ahead? Key Level Breakout or Dangerous Reversal!USD/JPY: Storm Ahead? Key Level Breakout or Dangerous Reversal!
Overview:
The USD/JPY pair stands at a crucial crossroads, with technical signals indicating the potential for significant volatility in the near term. Will the Yen regain its footing, or will pressure from the USD continue to push the pair to new highs? This analysis delves into technical, fundamental, and macroeconomic factors to outline potential scenarios and identify key trading zones.
Detailed Technical Analysis:
Primary Trend: The USD/JPY chart clearly shows a short-term uptrend, supported by an ascending trendline (dashed line on the chart) and upward-sloping moving averages (MA). Trend analysis is considered the most important area of technical analysis, and is key to determining the general direction of a security. However, the price is approaching strong resistance zones, suggesting potential selling pressure. Technical analysis is a trading tool used to evaluate stocks and attempt to predict their future movements by analyzing statistical data obtained from trading activity.
Key Price Levels:
Crucial Resistance Zone (SELL Zone): Around 144.894 - 145.178. This is a significant Fibonacci Extension zone (1.13 and 1.236), where the price has reacted in the past and could attract strong selling pressure. If the price breaks and holds above this zone, the uptrend will be confirmed.
Crucial Support Zone (BUY Zone): Around 143.600 - 143.750. This support zone is formed by previous lows and the ascending trendline. If the price corrects to this zone and shows reversal signals, it could be a good buying opportunity. The next support zone is around 142.800. The goal of technical analysis is to determine the buy and sell points of a stock.
Technical Indicators: The MAs (blue, orange, red) maintain a relatively consistent distance and are sloping upwards, supporting the uptrend. However, the convergence of MAs near resistance zones could signal a weakening of upward momentum.
Price Patterns: Currently, the price is forming a pattern similar to a bull flag or an ascending triangle, suggesting a potential continuation of the uptrend if it breaks upwards. Conversely, if the price fails to overcome resistance and breaks the uptrend line, a bearish reversal pattern could form. Wave analysis is a technique based on the observation that markets move in specific patterns called waves.
Relevant Fundamental and Economic Factors:
Macroeconomic Analysis (Japan): The Bank of Japan (BOJ) continues to maintain ultra-loose monetary policy, with negative interest rates and yield curve control. This exerts continuous downward pressure on the Yen. Any signal of change from the BOJ regarding policy will have a significant impact on USD/JPY.
Macroeconomic Analysis (United States): The U.S. Federal Reserve (FED) is still in an aggressive monetary tightening cycle to combat inflation. Inflation reports (CPI, PPI), employment data (NFP), and statements from FED officials will be key drivers for the USD. If U.S. inflation remains high, the FED may continue to raise interest rates, pushing USD/JPY higher. Fundamental analysis focuses on evaluating economic, political, and social factors affecting the value of a currency pair.
Upcoming Economic Events: Closely monitor inflation reports from both the U.S. and Japan, GDP data, unemployment rates, and policy meetings of the BOJ and FED. These events will act as catalysts for sharp movements.
Conclusion and Trading Recommendations:
USD/JPY is in an uptrend but approaching crucial resistance zones.
BUY
Entry: When the price breaks and closes above 145.178, confirming the uptrend continuation. Or when the price corrects to the 143.600 - 143.750 zone and shows bullish reversal candles (e.g., bullish engulfing, hammer).
Take Profit: Higher Fibonacci levels (e.g., 1.382 at 145.491 or 1.5 at 145.918).
Stop Loss: Below the nearest support zone, e.g., below 143.500 if buying at support, or below 144.800 if buying after a resistance breakout.
SELL Scenario:
Entry: When the price approaches the 144.894 - 145.178 zone and strong bearish reversal signals appear (e.g., Gravestone Doji, bearish engulfing, double top pattern).
Take Profit: Lower support levels, e.g., 143.700, 142.800.
Stop Loss: Above the resistance zone, e.g., above 145.300.
Risk Disclaimer: Financial markets always involve high risks. Always manage your capital carefully and never trade with money you cannot afford to lose. This analysis is for informational purposes only and not investment advice.

USDJPY - MR.GRINGO ThinkingsHello everybody.
Today, we have some discussion about this pair but only with using Technical ways.
The pair right now is very long, maybe 80 days' time period in trouble situation. I mean, the bears have the market of it...
As we see, this 80 day was so strong bearish range, but it's great try for bulls now!
We may have a hope, the price will go up with this next side of the acceding triangular figures.
We may open long position on the price 143.603 or Just make entry for long now.
If you will follow this trading idea, there we will have "the main" resistance levels.
They are...
1. 145.735
2. 146.892
3. 148.048 yes. so I recommend this price levels, because the market will check it maybe later... For sure if you think buy.
Have a profit maker day! :) ^)

#USDJPY: +2000 PIPS Big Swing Move! Do not miss outThe cryptocurrency’s price is currently experiencing bearish pressure, and the current trading price is pivotal for determining its future trajectory. A smooth downtrend is anticipated, potentially propelling the price to 124 in the long term. The US dollar is likely to remain bearish, potentially reaching 95 in the US currency index. Three potential target sets are envisaged, and further updates will be provided based on price developments.
Best of luck and ensure safe trading practices.
Team Setupsfx_

USDJPY Is Going Up! Long!
Here is our detailed technical review for USDJPY.
Time Frame: 2h
Current Trend: Bullish
Sentiment: Oversold (based on 7-period RSI)
Forecast: Bullish
The market is approaching a significant support area 144.671.
The underlined horizontal cluster clearly indicates a highly probable bullish movement with target 145.501 level.
P.S
The term oversold refers to a condition where an asset has traded lower in price and has the potential for a price bounce.
Overbought refers to market scenarios where the instrument is traded considerably higher than its fair value. Overvaluation is caused by market sentiments when there is positive news.
Disclosure: I am part of Trade Nation's Influencer program and receive a monthly fee for using their TradingView charts in my analysis.
Like and subscribe and comment my ideas if you enjoy them!

USDJPY Analysis: MMC Resistance vs Major BOS (Technical View)🔍 Chart Summary:
The USDJPY pair is currently trading around 144.58, showing strong signs of structural buildup as it approaches a critical inflection point. This analysis leverages MMC (Market Mapping Concept) and price action structure to identify two possible directional outcomes — each grounded in key technical levels.
🧠 Key Technical Highlights:
📌 1. Expanding Wedge Pattern:
Price previously formed an expanding structure, signaling volatility and accumulation.
Expansion typically precedes major directional breakouts — either trend continuation or reversal.
📌 2. Downtrend Break Test:
A long-standing descending trendline has now been tested multiple times.
A confirmed breakout would be significant, indicating a major shift in market momentum.
📌 3. Resistance Zones:
Minor Resistance Zone around 158.00–160.00 marks a key supply area.
Watch for price action behavior if this level is tested — possible rejection or breakout continuation.
📌 4. Major Support Zone:
Support near 139.00–140.00, where price previously bounced, represents a solid floor and demand zone.
📌 5. BOS (Break of Structure):
Two BOS levels are marked:
Minor BOS (Around 146.00): Immediate reaction level to watch.
Major BOS (Around 149.00–150.00): If broken, could lead to sharp bullish continuation.
🔮 MMC Forecast Scenarios:
✅ Condition 1: Bullish Breakout Scenario
Price breaks above the descending trendline and clears the Minor BOS.
Target zone: 158.00–160.00 resistance.
Structure confirms bullish dominance if Major BOS is cleanly broken and retested.
⚠️ Condition 2: Bearish Rejection Scenario
Price rejects from current trendline or Minor BOS and reverses.
Potential drop toward Major Support around 140.00.
Watch for reversal confirmation with bearish engulfing candles or re-entry into expanding zone.
🧭 MMC Outlook Summary:
The chart is setting up for a key decision point. The market will either validate a bullish breakout structure or revert back into bearish continuation. These scenarios align with the MMC mapping method, providing clear conditions for traders to follow without bias.

Potential bullish rise?USD/JPY has bounced off the pivot and could rise to the 1st resistance, which acts as a pullback resistance.
Pivot: 144.29
1st Support: 143.28
1st Resistance: 146.17
Risk Warning:
Trading Forex and CFDs carries a high level of risk to your capital and you should only trade with money you can afford to lose. Trading Forex and CFDs may not be suitable for all investors, so please ensure that you fully understand the risks involved and seek independent advice if necessary.
Disclaimer:
The above opinions given constitute general market commentary, and do not constitute the opinion or advice of IC Markets or any form of personal or investment advice.
Any opinions, news, research, analyses, prices, other information, or links to third-party sites contained on this website are provided on an "as-is" basis, are intended only to be informative, is not an advice nor a recommendation, nor research, or a record of our trading prices, or an offer of, or solicitation for a transaction in any financial instrument and thus should not be treated as such. The information provided does not involve any specific investment objectives, financial situation and needs of any specific person who may receive it. Please be aware, that past performance is not a reliable indicator of future performance and/or results. Past Performance or Forward-looking scenarios based upon the reasonable beliefs of the third-party provider are not a guarantee of future performance. Actual results may differ materially from those anticipated in forward-looking or past performance statements. IC Markets makes no representation or warranty and assumes no liability as to the accuracy or completeness of the information provided, nor any loss arising from any investment based on a recommendation, forecast or any information supplied by any third-party.
Usdjpy|| — the next move could be explosiveUSD/JPY
Timeframe: 2H
Strategy: Elliott Wave + Triangle Pattern + Fair Value Gap (FvG)
Formation: Contracting Triangle – Wave (a) to (e)
Risk-Reward: High Conviction Setup
Status: On the verge of breakout
🔍 Technical Breakdown:
The chart shows a classic contracting triangle pattern with completed internal waves (a)-(b)-(c)-(d)-(e).
Price is reacting near wave (e), signaling a potential bullish breakout.
A clean Fair Value Gap (FvG) zone lies just below current price — possible last dip before the breakout surge.
Target zone = 148.874, derived from the triangle's height projected from breakout point.
Strong confluence with liquidity hunt below before expansion move.
🎯 Target: 148.874
🛑 Stop Loss: Below 142.738 (SI Level / structural low)
🟢 Entry Trigger: Breakout above trendline + retest confirmation or Smart Money entry at FvG
This setup aligns with Elliott Wave triangle theory, often seen before sharp impulse waves. Smart Money is likely filling orders in the FvG zone before the upward expansion.

USD/JPY holds key support ahead of US dataThe USD/JPY direction has turned somewhat bullish in recent days as improving risk appetite and optimism over US-China trade talks lifted the dollar and pressurized the safe-haven yen.
The pair held firm above key support at 142.50, with sentiment-driven flows favoring the greenback. This week’s focus shifts to key US data releases—CPI on Wednesday and UoM Consumer Sentiment on Friday—which could influence Fed policy expectations and the USD’s trajectory.
A stronger dollar, supported by macro data and fading trade tensions, may push USD/JPY higher, especially as global equities rally and investor confidence improves.
Short-term resistance is seen around the 145.00 handle. The next upside targets are at 146.00, and then 148.00.
All bullish bets would be off, however, should support at 142.50 give way eventually. At the time of writing price was testing interim support around 144.00.
By Fawad Razaqzada, market analyst with FOREX.com

Will the USD/JPY exchange rate fall toward 142?During the European session, USD/JPY continued its downward trend, falling 0.52% on the day to 144.108, technically pressured below the 50-day moving average of 144.412. Meanwhile, news that the Japanese government is considering repurchasing ultra-long-term government bonds has triggered a repricing of the Japanese government bond yield curve, significantly increasing market volatility. The 144 level has become a pivotal battleground for bulls and bears. Two scenarios need to be watched out for: if the Bank of Japan (BOJ) delays policy adjustments and the Federal Reserve maintains a hawkish stance, USD/JPY may rebound to test 146; conversely, if the bond repurchases coincide with the BOJ extending its easing policy, the yen could stage a periodic rally to the 142 range.
Humans need to breathe, and perfect trading is like breathing—maintaining flexibility without needing to trade every market swing. The secret to profitable trading lies in implementing simple rules: repeating simple tasks consistently and enforcing them strictly over the long term.

Skeptic | USD/JPY Analysis: Sharp Uptrend Triggers Ready!Hey, traders, it’s Skeptic! 😎 CMCMARKETS:USDJPY is gearing up for a sharp uptrend move, and if you sleep on it, you might miss it, jump in late, and get stopped out. So, let’s set our scenarios and triggers now to make quick, sharp decisions instead of lagging.
Daily Timeframe: The Big Picture
We were in a major bearish trend but now seem stuck in a triangle. The heavy bearish momentum and support zone at 142.232–142.604 —our key level—has held strong with reactions every time we hit it. But, the bearish moves are getting weaker , with shallower slopes and smaller, choppier candles, signaling fading momentum and a higher chance of a reversal. Still, we need a trigger to go long—without it, jumping in is risky. As a skeptical trader , I need solid reasoning for every move. That’s our vibe! :)))
Now, let’s hit the 4-Hour Timeframe for our triggers.
We’ve got a descending trendline , and breaking it upward could spark an uptrend. But here’s the deal: this isn’t a continuation pattern—a break means a trend reversal, so we need extra confirmation beyond just the break.
Our main long trigger is a break above resistance at 145.071 .
Stop loss? Place it below the trendline, previous support, or last low—depends on your strategy.I’m a breakout trader myself
( check my article for deets! ).
For confirmation, watch RSI hitting overbought—it backs the uptrend momentum and can push you to your R/R faster. 😊 I’ll drop an RSI tutorial soon , so stay tuned! If we lose the support zone ( 142.232–142.604 ), expect the bearish trend to continue, so focus on shorts then.
Final word: No FOMO . Wait for your triggers and confirmations. Our motto? No FOMO. No hype. Just reason :)
💬 Let’s Talk!
If this analysis helped you, smash that boost—it means a lot! 😊 Got a pair or setup you want me to hit next? Drop it in the comments. Thanks for chilling with me—keep trading smart! ✌️

Technical Analysis on JPY Price Action (as of June 9, 2025)📈 Technical Analysis on JPY Price Action (as of June 9, 2025)
---
🗂️ Overview:
This chart illustrates the price movement of the Japanese Yen (JPY) with clearly defined support and resistance zones. The setup suggests a bullish bias in the short term, with potential for a breakout toward previous highs.
---
🔍 Key Levels Identified:
🟥 Main Support Zone (141.80 – 142.80):
This is a strong demand zone.
Price bounced aggressively from this level in late May.
If broken, could trigger a major downside move 📉.
🟧 Support Zone (143.80 – 144.70):
Price is currently testing this zone.
Holding this area will be crucial for bullish continuation.
🟨 Resistance Zone (145.80 – 146.60):
This is the next target for bulls 🐂.
Historically acted as a supply zone, causing pullbacks.
🟫 ATH Resistance Zone (~147.80 – 148.50):
The All-Time High (ATH) resistance zone.
Strong rejection from here in the past; likely to act as a hard ceiling again 🚫.
---
🔄 Price Action Forecast:
🕊️ If the current support holds, expect a bullish move toward the 146.00–146.50 resistance.
📈 A breakout above this resistance could initiate a move to the ATH zone (147.80+).
🚨 A breakdown below 143.80 could lead to retesting the main support near 142.00.
---
📊 Technical Sentiment:
Bias: Bullish ✅
Trend: Recovering uptrend after forming a higher low.
Confirmation Needed: Break and retest of the 145.80–146.60 resistance for continuation.
---
✅ Trading Tip:
Wait for either:
🔁 A retest and bounce from 144.00 for long entries 🎯.
❌ A rejection at resistance for potential short opportunities if price fails to break 146.60.
---
📌 Conclusion:
The market shows bullish intent from support, but traders should watch the reaction near the resistance zone to confirm trend continuation. 📍Patience and confirmation are key.

USDJPY and GBPJPY Analysis todayHello traders, this is a complete multiple timeframe analysis of this pair. We see could find significant trading opportunities as per analysis upon price action confirmation we may take this trade. Smash the like button if you find value in this analysis and drop a comment if you have any questions or let me know which pair to cover in my next analysis.

Fundamental Market Analysis for June 9, 2025 USDJPYThe Japanese Yen (JPY) is rising at the start of the new week, reacting to upward revisions to Japan's first quarter GDP data. This comes amid signs of rising inflation in Japan and confirmation of bets that the Bank of Japan (BoJ) will continue to raise interest rates, which in turn provides a slight boost to the JPY. In addition, a modest decline in the US Dollar (USD) is putting some downward pressure on the USD/JPY pair during the Asian session.
For now, the Yen appears to have broken a two-day losing streak against its US counterpart, although traders may refrain from aggressive directional bets ahead of key US-China trade talks in London. In addition, stronger-than-expected US jobs data released on Friday dampened hopes that the Federal Reserve (Fed) will cut interest rates soon this year, which could serve as a tailwind for the dollar and limit USD/JPY pair losses.
Trade recommendation: SELL 143.85, SL 144.85, TP 141.85

USDJPY H1 I Bullish Bounce OffBased on the H1 chart analysis, we can see that the price is falling toward our buy entry at 143.70, which is a pullback support that aligns closely with the 61.8% Fib retracement.
Our take profit will be at 144.74, which is a pullback resistance level.
The stop loss will be placed at 142.81, an overlap support.
High Risk Investment Warning
Trading Forex/CFDs on margin carries a high level of risk and may not be suitable for all investors. Leverage can work against you.
Stratos Markets Limited (tradu.com/uk ):
CFDs are complex instruments and come with a high risk of losing money rapidly due to leverage. 63% of retail investor accounts lose money when trading CFDs with this provider. You should consider whether you understand how CFDs work and whether you can afford to take the high risk of losing your money.
Stratos Europe Ltd (tradu.com/eu ):
CFDs are complex instruments and come with a high risk of losing money rapidly due to leverage. 63% of retail investor accounts lose money when trading CFDs with this provider. You should consider whether you understand how CFDs work and whether you can afford to take the high risk of losing your money.
Stratos Global LLC (tradu.com/en ):
Losses can exceed deposits.
Please be advised that the information presented on TradingView is provided to Tradu (‘Company’, ‘we’) by a third-party provider (‘TFA Global Pte Ltd’). Please be reminded that you are solely responsible for the trading decisions on your account. There is a very high degree of risk involved in trading. Any information and/or content is intended entirely for research, educational and informational purposes only and does not constitute investment or consultation advice or investment strategy. The information is not tailored to the investment needs of any specific person and therefore does not involve a consideration of any of the investment objectives, financial situation or needs of any viewer that may receive it. Kindly also note that past performance is not a reliable indicator of future results. Actual results may differ materially from those anticipated in forward-looking or past performance statements. We assume no liability as to the accuracy or completeness of any of the information and/or content provided herein and the Company cannot be held responsible for any omission, mistake nor for any loss or damage including without limitation to any loss of profit which may arise from reliance on any information supplied by TFA Global Pte Ltd.
The speaker(s) is neither an employee, agent nor representative of Tradu and is therefore acting independently. The opinions given are their own, constitute general market commentary, and do not constitute the opinion or advice of Tradu or any form of personal or investment advice. Tradu neither endorses nor guarantees offerings of third-party speakers, nor is Tradu responsible for the content, veracity or opinions of third-party speakers, presenters or participants.

Bullish bounce?USD/JPY is falling towards the pivot which acts as a pullback support and could rise to the 1st resistance which has been identified as a pullback resistance.
Pivot: 142.40
1st Support: 139.58
1st Resistance: 148.45
Risk Warning:
Trading Forex and CFDs carries a high level of risk to your capital and you should only trade with money you can afford to lose. Trading Forex and CFDs may not be suitable for all investors, so please ensure that you fully understand the risks involved and seek independent advice if necessary.
Disclaimer:
The above opinions given constitute general market commentary, and do not constitute the opinion or advice of IC Markets or any form of personal or investment advice.
Any opinions, news, research, analyses, prices, other information, or links to third-party sites contained on this website are provided on an "as-is" basis, are intended only to be informative, is not an advice nor a recommendation, nor research, or a record of our trading prices, or an offer of, or solicitation for a transaction in any financial instrument and thus should not be treated as such. The information provided does not involve any specific investment objectives, financial situation and needs of any specific person who may receive it. Please be aware, that past performance is not a reliable indicator of future performance and/or results. Past Performance or Forward-looking scenarios based upon the reasonable beliefs of the third-party provider are not a guarantee of future performance. Actual results may differ materially from those anticipated in forward-looking or past performance statements. IC Markets makes no representation or warranty and assumes no liability as to the accuracy or completeness of the information provided, nor any loss arising from any investment based on a recommendation, forecast or any information supplied by any third-party.

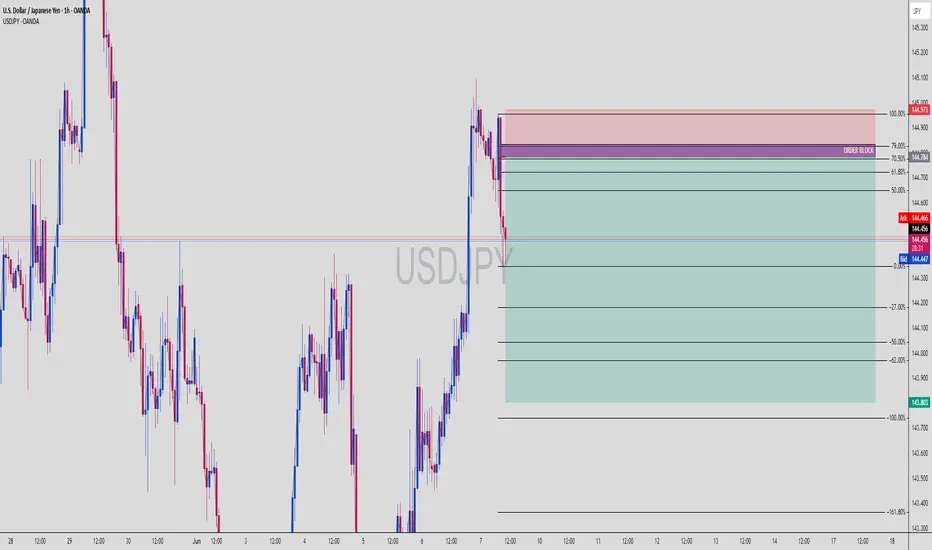
USDJPY Short Setup: OB Rejection + Fib Premium Sell-Off IncomingUSDJPY (1H Chart) | Institutional Short Setup with OB + Fib Confluence
The market is showing clear Smart Money Distribution behavior — with a rejection from a high-confluence zone combining Order Block, Premium Fib Levels, and bearish momentum shift.
🔍 Smart Money Setup Breakdown:
🔻 Bearish Order Block Zone (OB)
Price wicked into OB zone and got instantly rejected
OB located precisely at the 70.5% – 79% premium range
Mark of institutional sell-side interest
📐 Fibonacci Retracement + Premium Zone
Retracement from swing high (144.973) to swing low (144.436)
Premium zone between 61.8% to 79% aligns with OB (144.700–144.973)
Entry taken from this zone for high-probability sell setup
📉 Bearish Confirmation
Aggressive bearish reaction post-OB tap
Market structure flipping bearish
Momentum candle breaks previous bullish leg
🔻 Target Zones (Measured Fib Extensions)
-27%: 144.200
-62%: 144.000
-100%: 143.803
-161.8%: 143.300 (extended liquidity draw)
🧠 Chart Ninja Entry Plan:
🔹 Entry Zone 144.784 – 144.973 (OB + Premium Fib + FVG rejection)
🔻 SL Above 145.000 (above OB wick)
📉 TP 1 144.200 (first fib extension)
📉 TP 2 143.803 (full -100% extension)
⚖️ RRR Approx. 1:4+ — stealthy sniper precision
💬 Pro Tip from the Ninja Dojo:
The market doesn’t move because of indicators — it moves because of liquidity.
Find the OB. Wait for the imbalance. Strike where Smart Money hides. 🥷📊
This isn’t retail — this is calculated execution.
🎯 Save this chart before price melts to 143.8
💬 Drop your entry zone & SL idea in comments
Japan : Q1 2025 GDP Revision: Milder ContractionFinal data for Q1 2025 shows that Japan's economy contracted by 0.2% year-on-year (YoY), better than the initial estimate of -0.7%
(Sources: english.kyodonews.net, reuters.com, fxstreet.com).
Growth in household consumption and an increase in inventory levels were the main drivers, although the export sector remained a drag due to U.S. tariff pressures.
On a quarterly basis (QoQ), the economy recorded flat growth (0.0%), exceeding expectations of a -0.2% contraction
(Sources: reuters.com, fxstreet.com).
In summary: The revision shows that Japan’s economy is not as weak as initially feared, though it still reflects underlying sluggish conditions.
