Is the 144 level becoming a key battleground for positioning?The USD/JPY exchange rate has staged a mild rebound for the second consecutive day, though it remained capped below the 144.00 level during the European session. Despite short-term signs of stabilization, the pair remains broadly pressured by a dual combination of fundamental expectations and technical resistance. Persistently constrained by selling pressure above 144.00 and failing to achieve a volume-supported breakout, the exchange rate is expected to continue trading within a range-bound consolidation between 142.00 and 144.80. Focus remains on the multi-empty battles in the 143.40 and 142.30 zones.
Humans need to breathe, and perfect trading is like breathing—maintaining flexibility without needing to trade every market swing. The secret to profitable trading lies in implementing simple rules: repeating simple tasks consistently and enforcing them strictly over the long term.
USDJPY

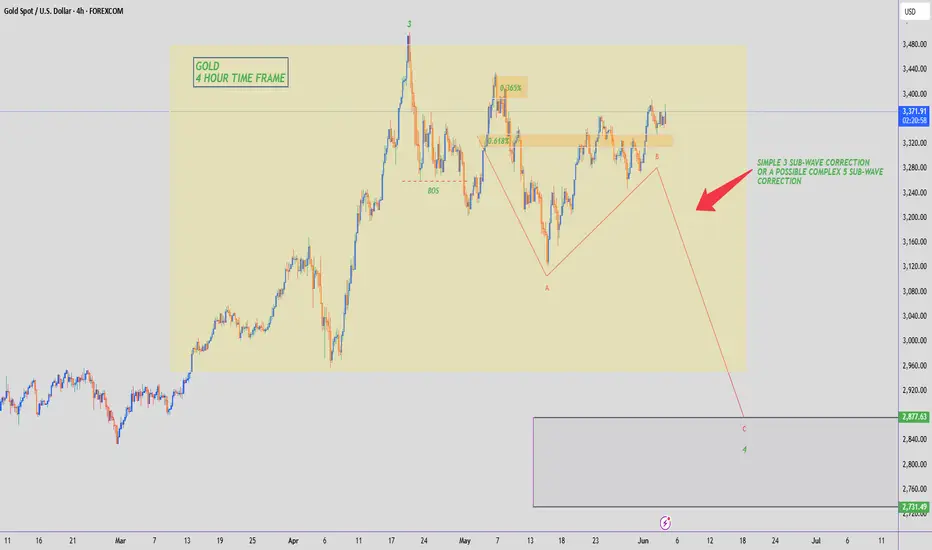
GOLD - WAVE 4 CORRECTION TO $2,800 (UPDATE)The 'resistance turned support' which I mentioned yesterday is holding up well. After the retest of the support zone, we're currently seeing bullish momentum keep Gold prices up.
As soon as Gold surpasses $3,400 & closes WITHIN the previous 0.365% zone, I will be sure that the 3 Sub-Wave (A,B,C) correction for sellers is over & buyers are now heading towards a new ATH. Until then I am still wary & being careful of sellers.
USDJPY Tests Channel Support After ADP Shock — Rebound Ahead?In the last hour's candle after the ADP Non-Farm Employment Change Index was released, USDJPY ( FX:USDJPY ) started to fall, but considering the position of this pair, I think we can have a good Risk-To-Reward even if the Stop Loss (SL) is touched.
USDJPY is trading near the lower line of the ascending channel and the Support zone(143.870 JPY-143.430 JPY) .
From an Elliott Wave perspective , USDJPY appears to be completing a corrective pattern .
I expect USDJPY to rise at least to the Potential Reversal Zone(PRZ) .
Note: Stop Loss = 143.220 JPY
Please respect each other's ideas and express them politely if you agree or disagree.
U.S. Dollar/Japanese Yen Analyze (USDJPY), 1-hour time frame.
Be sure to follow the updated ideas.
Do not forget to put a Stop loss for your positions (For every position you want to open).
Please follow your strategy and updates; this is just my Idea, and I will gladly see your ideas in this post.
Please do not forget the ✅' like '✅ button 🙏😊 & Share it with your friends; thanks, and Trade safe.

AUDCHF BULLISH OR BEARISH DETAILED ANALYSISAUDCHF is currently breaking out of a textbook falling wedge pattern on the 4H chart, signaling a potential shift in momentum from bearish to bullish. Price action has been consolidating within this structure for several weeks, creating lower highs and lower lows, but with clear bullish divergence beginning to show up in recent sessions. The breakout around the 0.53300 zone marks a significant technical confirmation that bulls are taking control, with eyes now on the 0.54400 target.
From a fundamental standpoint, the Australian dollar is gaining strength backed by hawkish sentiment from the RBA. Despite global uncertainties, the RBA’s firm stance on managing inflation is keeping the Aussie resilient. On the flip side, the Swiss franc has been showing signs of relative weakness due to softer inflation readings and safe-haven outflows as global risk sentiment improves. This macro backdrop is creating favorable conditions for AUDCHF to rally.
Technically, this breakout aligns with strong market structure and volume support, making this a high-conviction bullish setup. The breakout candle is closing above resistance with momentum, and as long as price holds above the 0.53250–0.53000 zone, bulls are likely to maintain control. With the falling wedge breakout and favorable risk-reward setup, the upside move toward 0.54400 looks increasingly probable.
This is a clean price action play with fundamental alignment. The breakout not only confirms the end of the previous downtrend, but also opens up space for a bullish wave to unfold. Momentum traders and swing traders will want to watch this closely as AUDCHF transitions from accumulation to a potential bullish expansion phase.

USDJPY Will Go Higher From Support! Buy!
Take a look at our analysis for USDJPY.
Time Frame: 2h
Current Trend: Bullish
Sentiment: Oversold (based on 7-period RSI)
Forecast: Bullish
The market is on a crucial zone of demand 143.192.
The oversold market condition in a combination with key structure gives us a relatively strong bullish signal with goal 144.216 level.
P.S
We determine oversold/overbought condition with RSI indicator.
When it drops below 30 - the market is considered to be oversold.
When it bounces above 70 - the market is considered to be overbought.
Disclosure: I am part of Trade Nation's Influencer program and receive a monthly fee for using their TradingView charts in my analysis.
Like and subscribe and comment my ideas if you enjoy them!

USDJPY M15 Support & Resistance Levels🚀 Here are some key zones I've identified on the 15m timeframe.
These zones are based on real-time data analysis performed by a custom software I personally developed.
The tool is designed to scan the market continuously and highlight potential areas of interest based on price action behavior and volume dynamics.
Your feedback is welcome!

Fundamental Market Analysis for June 4, 2025 USDJPYEvents to pay attention today:
17:00 EET. USD - ISM Services Business Activity Index
15:15 EET. USD - ADP Employment Change
USDJPY:
The Japanese yen (JPY) is attracting some intraday buyers after falling against the US dollar during the Asian session, and, at least for now, it seems that its pullback from the weekly high reached yesterday has paused. An upward revision of Japan's services business activity index, as well as expectations that wage growth will lead to faster inflation, leave open the possibility of another interest rate hike by the Bank of Japan (BoJ) in 2025. In addition, ongoing geopolitical risks and trade uncertainty are key factors supporting the JPY.
Meanwhile, cautious statements by BoJ Governor Kazuo Ueda on Tuesday sparked speculation that the next interest rate hike will not happen anytime soon. However, this still differs significantly from expectations that the Federal Reserve (Fed) will cut rates by at least 25 basis points (bps) by the end of this year. This, along with concerns about the US budget, is causing a new wave of selling of the US dollar (USD) after Tuesday's decent rebound from a six-week low and is putting some pressure on the USD/JPY pair during the Asian session.
Trading recommendation: SELL 144.20, SL 144.40, TP 143.20

USDJPY H4 I Bullish Bounce Off Based on the H4 chart analysis, the price is trading near our buy entry level at 143.99, a pullback support
Our take profit is set at 145.06, a pullback resistance.
The stop loss is placed at 142.49, a swing low support.
High Risk Investment Warning
Trading Forex/CFDs on margin carries a high level of risk and may not be suitable for all investors. Leverage can work against you.
Stratos Markets Limited (tradu.com ):
CFDs are complex instruments and come with a high risk of losing money rapidly due to leverage. 63% of retail investor accounts lose money when trading CFDs with this provider. You should consider whether you understand how CFDs work and whether you can afford to take the high risk of losing your money.
Stratos Europe Ltd (tradu.com ):
CFDs are complex instruments and come with a high risk of losing money rapidly due to leverage. 63% of retail investor accounts lose money when trading CFDs with this provider. You should consider whether you understand how CFDs work and whether you can afford to take the high risk of losing your money.
Stratos Global LLC (tradu.com ):
Losses can exceed deposits.
Please be advised that the information presented on TradingView is provided to Tradu (‘Company’, ‘we’) by a third-party provider (‘TFA Global Pte Ltd’). Please be reminded that you are solely responsible for the trading decisions on your account. There is a very high degree of risk involved in trading. Any information and/or content is intended entirely for research, educational and informational purposes only and does not constitute investment or consultation advice or investment strategy. The information is not tailored to the investment needs of any specific person and therefore does not involve a consideration of any of the investment objectives, financial situation or needs of any viewer that may receive it. Kindly also note that past performance is not a reliable indicator of future results. Actual results may differ materially from those anticipated in forward-looking or past performance statements. We assume no liability as to the accuracy or completeness of any of the information and/or content provided herein and the Company cannot be held responsible for any omission, mistake nor for any loss or damage including without limitation to any loss of profit which may arise from reliance on any information supplied by TFA Global Pte Ltd.
The speaker(s) is neither an employee, agent nor representative of Tradu and is therefore acting independently. The opinions given are their own, constitute general market commentary, and do not constitute the opinion or advice of Tradu or any form of personal or investment advice. Tradu neither endorses nor guarantees offerings of third-party speakers, nor is Tradu responsible for the content, veracity or opinions of third-party speakers, presenters or participants.

usdjpy 1 hour BUYPEPPERSTONE:USDJPY As we can see on 1 hour chart price came to another level. And after some consolidation price rejected from level. I'm looking for sell from this level and probably price push down.

USDJPY Potential DownsidesHey Traders, in today's trading session we are monitoring USDJPY for a selling opportunity around 143.200 zone, USDJPY is trading in a downtrend and currently is in a correction phase in which it is approaching the trend at 143.200 support and resistance area.
Trade safe, Joe.

XAU/USD Weekly Forecast : First LONG, then SHORT! (READ CAPTION)By examining the gold chart on the 4-hour timeframe, we can see that after dropping to $3270, the price faced strong buying pressure and opened today’s session with a 100-pip gap at $3298, continuing its rally up to $3370. This bullish move could potentially extend toward $3400, but keep in mind that gold is likely to retrace soon to fill this price gap — so this scenario should definitely be considered!

UsdJpy could break 142 and fall 500 pipsSince early May, I’ve been highlighting the 142 support zone on USDJPY as a potential reversal area — with a suggested upside target at 146.
The market respected this level twice, reversing from 142 and rallying past 146 both times.
However, last week’s move into 146 was sharply rejected, forming a strong daily Pin Bar exactly at resistance — a classic sign of exhaustion.
Now, price is rolling back toward support, and after multiple tests of the 142 zone, we may be very close to a downside break.
🧩 Add to this the fact that DXY also looks ready to break lower, and the probability of a USDJPY fall increases even more.
📉 Trading Plan:
Sell rallies, with invalidation above 146, and a target at 137, aiming for a 1:2 risk-reward setup.
Disclosure: I am part of TradeNation's Influencer program and receive a monthly fee for using their TradingView charts in my analyses and educational articles.

Prices are testing the 142.55 support level.Bank of Japan (BOJ) Governor Kazuo Ueda stated on Tuesday that the central bank would raise interest rates if the economy re-accelerates, adding that wage growth must regain momentum. Currently, Trump's tariff policies have dimmed the economic outlook, making it potentially not the optimal time for a rate hike. However, policymakers stand ready to raise rates if the economy rebounds after a brief pullback. The remarks bolstered the Japanese yen, with prices now testing the 142.55 support level. A decisive break below this level would form a lower low, confirming the continuation of the downtrend and shifting bearish targets toward the 140.01 support level.
Humans need to breathe, and perfect trading is like breathing—maintaining flexibility without needing to trade every market swing. The secret to profitable trading lies in implementing simple rules: repeating simple tasks consistently and enforcing them strictly over the long term.
Trading Strategy:
sell@144.50-145.00
TP:143.00-142.50

USD/JPY M15 Support & Resistance Levels🚀 Here are some key zones I've identified on the 15m timeframe.
These zones are based on real-time data analysis performed by a custom software I personally developed.
The tool is designed to scan the market continuously and highlight potential areas of interest based on price action behavior and volume dynamics.
Your feedback is welcome!

USDJPY Analysis todayHello traders, this is a complete multiple timeframe analysis of this pair. We see could find significant trading opportunities as per analysis upon price action confirmation we may take this trade. Smash the like button if you find value in this analysis and drop a comment if you have any questions or let me know which pair to cover in my next analysis.

Bearish reversal off 50% Fibonacci resistance?USD/JPY is rising towards the pivot, which aligns with the 50% Fibonacci retracement and could reverse to the 1st support, a pullback level.
Pivot: 144.37
1st Support: 141.94
1st Resistance: 146.17
Risk Warning:
Trading Forex and CFDs carries a high level of risk to your capital and you should only trade with money you can afford to lose. Trading Forex and CFDs may not be suitable for all investors, so please ensure that you fully understand the risks involved and seek independent advice if necessary.
Disclaimer:
The above opinions given constitute general market commentary, and do not constitute the opinion or advice of IC Markets or any form of personal or investment advice.
Any opinions, news, research, analyses, prices, other information, or links to third-party sites contained on this website are provided on an "as-is" basis, are intended only to be informative, is not an advice nor a recommendation, nor research, or a record of our trading prices, or an offer of, or solicitation for a transaction in any financial instrument and thus should not be treated as such. The information provided does not involve any specific investment objectives, financial situation and needs of any specific person who may receive it. Please be aware, that past performance is not a reliable indicator of future performance and/or results. Past Performance or Forward-looking scenarios based upon the reasonable beliefs of the third-party provider are not a guarantee of future performance. Actual results may differ materially from those anticipated in forward-looking or past performance statements. IC Markets makes no representation or warranty and assumes no liability as to the accuracy or completeness of the information provided, nor any loss arising from any investment based on a recommendation, forecast or any information supplied by any third-party.

Yen Rises Amid Trump Tariff Threat and China DisputeThe Japanese yen rose to around 143.5 per dollar on Monday, marking its third straight session of gains as rising global trade tensions lifted demand for safe-haven currencies. The move followed President Trump’s threat on Friday to double tariffs on steel and aluminum imports to 50% starting June 4. Japanese steelmakers like JFE Holdings and Kobe Steel fell, while Nippon Steel was less affected after Trump praised its planned merger with U.S. Steel. Meanwhile, U.S.-China tensions grew as China denied Trump’s claim of breaching a recent Geneva trade agreement. On the domestic front, Japan’s Q1 capital spending beat expectations, with investment rising across both manufacturing and services, reflecting solid internal momentum.
The key resistance is at $143.50 meanwhile the major support is located at $143.00.

USDJPY Bearish Signal | Technical + Custom AlgoSmart Trend Signal | Technical Analysis + Custom Algorithm
This signal is the result of a combination of classic technical trend analysis and a proprietary software I personally developed.

usdjpy 1H-buyPEPPERSTONE:USDJPY 1hour chart currently I'm in buy position. reason behind it 4 hour chart price currently sitting on key support level and I can see some upside price rejection ( previous demand zone) In 1 hour chart I can see price garbed some liquidity & price pushed up to create some kind of market structure shift.

USDJPY M15 I Bullish Bounce Based on the M15 chart analysis, the price is falling toward our buy entry level at 142.69, a pullback support that aligns with the 61.8% Fibonacci retracement.
Our take profit is set at 143.31, a pullback resistance.
The stop loss is placed at 142.53, a pullback support.
High Risk Investment Warning
Trading Forex/CFDs on margin carries a high level of risk and may not be suitable for all investors. Leverage can work against you.
Stratos Markets Limited (tradu.com ):
CFDs are complex instruments and come with a high risk of losing money rapidly due to leverage. 63% of retail investor accounts lose money when trading CFDs with this provider. You should consider whether you understand how CFDs work and whether you can afford to take the high risk of losing your money.
Stratos Europe Ltd (tradu.com ):
CFDs are complex instruments and come with a high risk of losing money rapidly due to leverage. 63% of retail investor accounts lose money when trading CFDs with this provider. You should consider whether you understand how CFDs work and whether you can afford to take the high risk of losing your money.
Stratos Global LLC (tradu.com ):
Losses can exceed deposits.
Please be advised that the information presented on TradingView is provided to Tradu (‘Company’, ‘we’) by a third-party provider (‘TFA Global Pte Ltd’). Please be reminded that you are solely responsible for the trading decisions on your account. There is a very high degree of risk involved in trading. Any information and/or content is intended entirely for research, educational and informational purposes only and does not constitute investment or consultation advice or investment strategy. The information is not tailored to the investment needs of any specific person and therefore does not involve a consideration of any of the investment objectives, financial situation or needs of any viewer that may receive it. Kindly also note that past performance is not a reliable indicator of future results. Actual results may differ materially from those anticipated in forward-looking or past performance statements. We assume no liability as to the accuracy or completeness of any of the information and/or content provided herein and the Company cannot be held responsible for any omission, mistake nor for any loss or damage including without limitation to any loss of profit which may arise from reliance on any information supplied by TFA Global Pte Ltd.
The speaker(s) is neither an employee, agent nor representative of Tradu and is therefore acting independently. The opinions given are their own, constitute general market commentary, and do not constitute the opinion or advice of Tradu or any form of personal or investment advice. Tradu neither endorses nor guarantees offerings of third-party speakers, nor is Tradu responsible for the content, veracity or opinions of third-party speakers, presenters or participants.

Bullish bounce off pullback support?USD/JPY has bounced off the support level which is a pullback support that lines up with the 61.8% Fibonacci projection and could rise from this level to our take profit.
Entry: 142.27
Why we like it:
There is a pullback support level that lines up with the 61.8% Fibonacci projection.
Stop loss: 141.62
Why we like it:
There is a pullback support level.
Take profit: 144.05
Why we like it:
There is a pullback resistance that lines up with the 38.25 fibonacci retracement.
Enjoying your TradingView experience? Review us!
Please be advised that the information presented on TradingView is provided to Vantage (‘Vantage Global Limited’, ‘we’) by a third-party provider (‘Everest Fortune Group’). Please be reminded that you are solely responsible for the trading decisions on your account. There is a very high degree of risk involved in trading. Any information and/or content is intended entirely for research, educational and informational purposes only and does not constitute investment or consultation advice or investment strategy. The information is not tailored to the investment needs of any specific person and therefore does not involve a consideration of any of the investment objectives, financial situation or needs of any viewer that may receive it. Kindly also note that past performance is not a reliable indicator of future results. Actual results may differ materially from those anticipated in forward-looking or past performance statements. We assume no liability as to the accuracy or completeness of any of the information and/or content provided herein and the Company cannot be held responsible for any omission, mistake nor for any loss or damage including without limitation to any loss of profit which may arise from reliance on any information supplied by Everest Fortune Group.

Risk, Rates, and Reversals: What’s Next for USD/JPY?CMCMARKETS:USDJPY FX:USDJPY USD/JPY rebounded slightly to 143.10 but remains under pressure after slipping from the 144.50 on BoJ-Fed divergence and rising geopolitical tensions. While the BoJ appears cautious about accelerating its balance sheet tapering beyond FY2026, it still signals further rate hikes amid persistent domestic inflation, offering the yen structural support.
Technically, price is reacting off the lower trendline TL2, aligned with the 142.30–142.40 significant support zone. This area has held multiple times in the past and may offer a bullish pullback toward the 143.80 or even 146.15 resistance zones. However, failure to break above these levels could expose USD/JPY to renewed downside toward the 140.89 demand base.
Short-term recovery depends on Friday’s NFP and risk sentiment around trade tensions. A break below 142.30 would invalidate the bullish rebound and open downside to support near 140.89.
Resistance : 143.87 , 146.14
Support : 142.36 , 140.89

Short I opened a short position yesterday at the price of 147.50.
Currently the price is 146.18. The price has dropped quite a bit but I think it still has a good short entry opportunity with a reasonable risk reward.
Reasons for short trade:
The price has reached the major support level around 149 on the 22nd April. Since then, the price has moved up to the fair value gap area between 149.2 and 148.2 (blue rectangular box), and also the order block.
That area is also the Fib 0786 area. I look at Fib 0.786 as the last line of defence and it is usually a hard line to break.
The price hit the area and started to move to the downside. Momentum indicators are still in the bull territory but the lines have crossed and clearly moving to the downside.
My macro bias for USD is bearish and the current price set up support my bias. The risk reward is good enough for me to enter.
My trade set up:
Entry: 147.51Stop: 148.95Target: 142.478 (Fib 0.236)
Risk:Reward= 1:3.5
Currently the price is 146.17. It just broked below Fib 0.618. Entry now can give you 1:1.5 risk reward.
