USDJPY - Predictive Analysis & Forecasting USDJPY
Scales
- S: pending 149.964 activation
- M: nears cycle completion from 140.648 to 148.52-149.53 target range
- L: 142.67 activation triggered 149.21 pivot
Forecast & Targets
- ST: limited upside to 149.96 max
- MT: bearish to 143.09 min, 138.29 max
#USDJPY #Forex #CROW2.0
4xForecaster
------
Originally published in BlueSky
USDJPY

USDJPY – Supportive news, price may break resistance soonUSDJPY is supported by positive U.S. economic data, as the PCE index remains elevated—reinforcing expectations that the Fed will keep interest rates higher for longer. This has boosted bond yields and the USD, driving USDJPY upward.
On the H3 technical chart, USDJPY has rebounded from the support zone around 143.680. Both the EMA 34 and EMA 89 lie below the price, reinforcing the recovery momentum. The pair is now expected to approach the 146.000 resistance area—where it intersects with the long-term descending trendline that has rejected price at least twice before.
If buying pressure holds and 146.000 is decisively broken, a short-term bullish trend will likely be confirmed. However, another rejection could lead to a retest of the previous support zone. Overall, the current trend slightly favors the buyers.

Fundamental Market Analysis for May 30, 2025 USDJPYThe Japanese yen (JPY) attracted strong follow-through buying for the second consecutive day on Friday and continued to recover from a two-week low reached the previous day against the US dollar. Global risk sentiment deteriorated after a federal appeals court on Thursday suspended a recent ruling blocking US President Donald Trump's radical tariffs. This is evident from the general weakening of sentiment in the stock markets and is contributing to a recovery in demand for traditional safe-haven assets, including the JPY.
Meanwhile, optimistic macroeconomic data from Japan released today, including strong consumer inflation figures in Tokyo, confirm the need for further interest rate hikes by the Bank of Japan (JPY) and provide additional support for the JPY. On the other hand, the US dollar (USD) is consolidating after a sharp reversal yesterday amid concerns about the deterioration of the US financial situation and bets that the Federal Reserve (Fed) will stick to its easing policy. This further contributes to the continued decline of the USD/JPY pair.
Trading recommendation: SELL 143.800, SL 144.200, TP 142.900

Could the price bounce from here?USD/JPY is falling towards the pivot and could bounce to the 1st resistance, which acts as a pullback resistance.
Pivot: 143.25
1st Support: 141.80
1st Resistance: 145.97
Risk Warning:
Trading Forex and CFDs carries a high level of risk to your capital and you should only trade with money you can afford to lose. Trading Forex and CFDs may not be suitable for all investors, so please ensure that you fully understand the risks involved and seek independent advice if necessary.
Disclaimer:
The above opinions given constitute general market commentary, and do not constitute the opinion or advice of IC Markets or any form of personal or investment advice.
Any opinions, news, research, analyses, prices, other information, or links to third-party sites contained on this website are provided on an "as-is" basis, are intended only to be informative, is not an advice nor a recommendation, nor research, or a record of our trading prices, or an offer of, or solicitation for a transaction in any financial instrument and thus should not be treated as such. The information provided does not involve any specific investment objectives, financial situation and needs of any specific person who may receive it. Please be aware, that past performance is not a reliable indicator of future performance and/or results. Past Performance or Forward-looking scenarios based upon the reasonable beliefs of the third-party provider are not a guarantee of future performance. Actual results may differ materially from those anticipated in forward-looking or past performance statements. IC Markets makes no representation or warranty and assumes no liability as to the accuracy or completeness of the information provided, nor any loss arising from any investment based on a recommendation, forecast or any information supplied by any third-party.

USDJPY H1 I Bullish Reversal Based on the H1 chart analysis, the price is falling our buy entry level at 143.27, a pullback support.
Our take profit is set at 144.85, a pullback resistance that aligns with the 50% Fibonacci retracement.
The stop loss is placed at 142.12, a swing low support.
High Risk Investment Warning
Trading Forex/CFDs on margin carries a high level of risk and may not be suitable for all investors. Leverage can work against you.
Stratos Markets Limited (tradu.com ):
CFDs are complex instruments and come with a high risk of losing money rapidly due to leverage. 63% of retail investor accounts lose money when trading CFDs with this provider. You should consider whether you understand how CFDs work and whether you can afford to take the high risk of losing your money.
Stratos Europe Ltd (tradu.com ):
CFDs are complex instruments and come with a high risk of losing money rapidly due to leverage. 63% of retail investor accounts lose money when trading CFDs with this provider. You should consider whether you understand how CFDs work and whether you can afford to take the high risk of losing your money.
Stratos Global LLC (tradu.com ):
Losses can exceed deposits.
Please be advised that the information presented on TradingView is provided to Tradu (‘Company’, ‘we’) by a third-party provider (‘TFA Global Pte Ltd’). Please be reminded that you are solely responsible for the trading decisions on your account. There is a very high degree of risk involved in trading. Any information and/or content is intended entirely for research, educational and informational purposes only and does not constitute investment or consultation advice or investment strategy. The information is not tailored to the investment needs of any specific person and therefore does not involve a consideration of any of the investment objectives, financial situation or needs of any viewer that may receive it. Kindly also note that past performance is not a reliable indicator of future results. Actual results may differ materially from those anticipated in forward-looking or past performance statements. We assume no liability as to the accuracy or completeness of any of the information and/or content provided herein and the Company cannot be held responsible for any omission, mistake nor for any loss or damage including without limitation to any loss of profit which may arise from reliance on any information supplied by TFA Global Pte Ltd.
The speaker(s) is neither an employee, agent nor representative of Tradu and is therefore acting independently. The opinions given are their own, constitute general market commentary, and do not constitute the opinion or advice of Tradu or any form of personal or investment advice. Tradu neither endorses nor guarantees offerings of third-party speakers, nor is Tradu responsible for the content, veracity or opinions of third-party speakers, presenters or participants.

USDJPY Bullish Pullback Setup – Targeting 145.800
USDJPY has broken out of the previous downtrend structure and is now showing a potential bullish continuation pattern.
- The recent impulse move from the demand zone (highlighted in blue) confirms buying interest around 143.600.
- The current pullback could offer a buy opportunity, especially if the price retests the 143.600 support zone or forms a higher low.
- As long as the price holds above this key support, we expect the pair to continue upward toward the next major resistance at 145.800.
USDJPY is forming a clean bullish correction after an impulsive move up. If support at 143.600 holds, the next bullish leg could extend to 145.800. Watch for bullish confirmation near the pullback zone.

USDJPY Faces An Intraday Corrective RecoveryUSDJPY Faces An Intraday Corrective Recovery after a bearish impulse, which can later send the price lower from technical and Elliott wave pespective.
USDJPY is sharply bouncing after reaching May lows within the wedge pattern for wave »v« of an impulse, so it can be now trading in a higher degree abc correction, which can recover the price back to 145 – 146 resistance area before bears return.
Basic bearish Elliott wave pattern shows that a five-wave impulsive decline indicates for more weakness after a corrective three-wave pause.

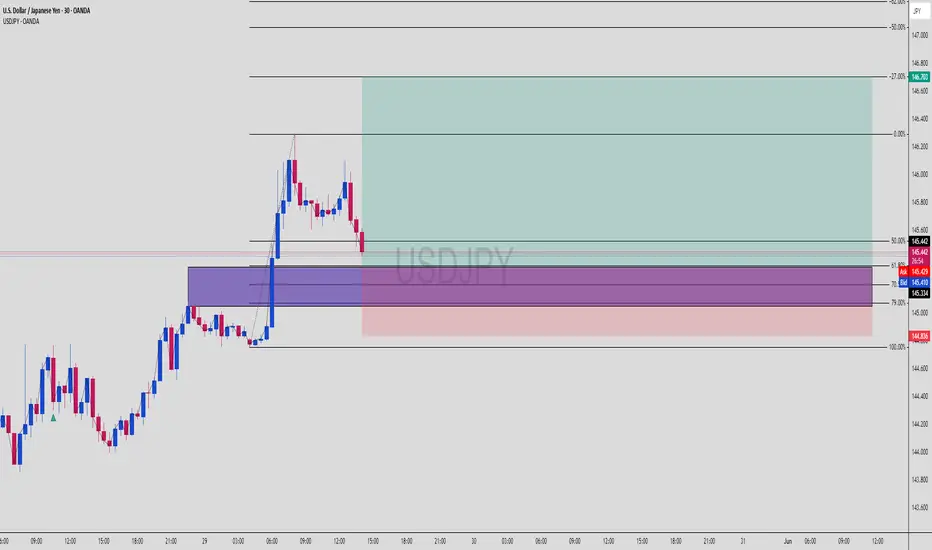
USDJPY SMC Play | Order Block + Fibo 61.8 = Precision EntryUSDJPY | Confluence Entry in Motion 🚀
A beautifully aligned setup using Smart Money Concepts, with a clear entry mapped out at the OB + Fib 61.8% retracement zone. Price just tapped into the purple zone — now it’s all eyes on bullish momentum confirmation.
📊 1. Market Overview
USDJPY has been trending bullish, with a strong impulsive move followed by a retracement — price is now sitting at a key decision zone.
The zone is a refined bullish Order Block (purple) aligning perfectly with:
✅ 61.8% Fibonacci retracement
✅ 70.5% golden zone
✅ Strong imbalance below
We’re seeing a beautiful reaction candle off this area as price hunts liquidity.
🧠 2. Why This Trade Makes Sense (SMC Breakdown)
Here’s the logic:
Price broke structure to the upside
Pullback into OB + discounted pricing
Clean liquidity sweep just beneath the short-term low
Room for continuation toward higher timeframe POI (top green zone)
This is a textbook SMC + Fibonacci sniper setup.
🎯 3. Entry Zone (Purple Box)
📍 OB Zone: 145.200 – 145.334
🧮 Fib Levels:
— 50%: 145.595
— 61.8%: 145.334
— 70.5%: ~145.200
— 100% (SL): 144.836
Your entry's beautifully layered with confluences = 🔥 Risk/Reward.
🚀 4. Target Zones
🟢 TP1: 146.000
🟢 TP2: 146.703
(TOP of the Fibonacci extension, completing the full bullish leg)
⚖️ 5. Risk-Reward Setup
✅ SL: 144.836
✅ Entry: around 145.334
✅ TP: 146.703
👉 RRR: Over 1:4 — institutional grade 🔥
🛡️ 6. Trade Management Tips
✅ Wait for bullish engulfing or LTF break of structure for confirmation
🕰️ Drop to M15 for precise sniper confirmation entry
🔄 If it taps again with more imbalance left = re-entry possible
📌 Save this if you love high confluence entries
🔥 Drop “SMC Sniper” in the comments if you're watching this pair
👀 Follow for daily setups just like this — clean, confident, and calculated
USD/JPY 1H Analysis – Channel Breakout and Buy SignalOverview:**
The USD/JPY chart shows a **bullish breakout from a descending channel**, supported by technical indicators like the Ichimoku Cloud and a strong demand zone. This setup suggests a potential bullish reversal and upward momentum.
*Key Technical Points:**
* **Descending Channel Breakout:**
Price action has broken out of a falling channel, indicating a shift in market sentiment from bearish to bullish.
* **Strong Support Zone:**
Around 143.28 – 143.73, the price found significant support, which aligns with a previous demand zone. This area held firm, helping trigger the breakout.
* **Ichimoku Cloud:**
Price is emerging above the Ichimoku Cloud, signaling a potential start of an uptrend. If the price maintains above the cloud, bullish momentum may strengthen.
* **Resistance Levels:**
* **First Resistance:** Near 146.00 – a critical area to watch for short-term profit-taking.
* **Second Resistance:** Around 148.00 – a more extended target if bullish continuation holds.
---
### **Trading Idea:**
**BUY USD/JPY** on successful retest of the breakout or sustained move above the Ichimoku Cloud.
* **Entry:** 144.30–144.40 zone
* **Target 1:** 146.00
* **Target 2:** 148.00
* **Stop Loss:** Below 143.20 (under the support zone)
---
Conclusion:**
The chart presents a classic **bullish channel breakout** supported by the Ichimoku indicator and price action at a strong support zone. As long as the price holds above the breakout level and Ichimoku Cloud, the upside targets at 146 and 148 remain valid.
Let me know if you want this formatted as a trade plan or journal entry.
To ensure you do not miss the upcoming analysis, be sure to follow me!
Please leave a remark and a like!

USDJPY Will Go Lower From Resistance! Sell!
Take a look at our analysis for USDJPY.
Time Frame: 12h
Current Trend: Bearish
Sentiment: Overbought (based on 7-period RSI)
Forecast: Bearish
The market is on a crucial zone of supply 145.162.
The above-mentioned technicals clearly indicate the dominance of sellers on the market. I recommend shorting the instrument, aiming at 142.359 level.
P.S
Please, note that an oversold/overbought condition can last for a long time, and therefore being oversold/overbought doesn't mean a price rally will come soon, or at all.
Disclosure: I am part of Trade Nation's Influencer program and receive a monthly fee for using their TradingView charts in my analysis.
Like and subscribe and comment my ideas if you enjoy them!

Yen Stabilizes as Risk Sentiment ImprovesThe Japanese Yen edged up from a two-week low on Thursday but lacked strong momentum, as risk appetite improved after a U.S. court blocked Trump’s “Liberation Day” tariffs, reducing demand for safe havens. Concerns over Japan’s rising debt continue to pressure the Yen. Meanwhile, USD/JPY rose for a fourth day, supported by hawkish FOMC minutes, though markets still expect a Fed rate cut. Expectations of a more hawkish Bank of Japan helped limit the Yen’s losses.
The key resistance is at $147.10 meanwhile the major support is located at $145.00.

USDJPY – Rejected at 146.00, downside risk growsUSDJPY reacted strongly at the 146.00 resistance area – a level where price was previously rejected. After a sharp rally, the pair has turned lower and is now heading toward the 144.00 support zone, which aligns with the EMA 34–89 on the H3 chart.
The chart shows a small double top pattern forming around the recent highs. If USDJPY continues to struggle below 146.00 and breaks through the 144.00 support, a short-term downtrend may be confirmed, with the next target around 142.50.
On the news side: The Japanese Yen is gaining some ground again after the BOJ signaled readiness to adjust its easing policy if inflation consistently exceeds its target. Meanwhile, the USD is under pressure as expectations grow that the Fed may keep interest rates steady in the upcoming meeting, due to cooler consumer data.
Suggested strategy: Consider selling if bearish signals appear around the 145.80–146.00 area, with a short-term target at 144.00.

USDCAD BULLISH OR BEARISH DETAILED ANALYSIS ??USDCAD continues to follow the predicted bearish path, currently trading around 1.38300, and still moving gradually toward our target zone of 1.34300. After a strong bearish impulse from the 1.40391 supply zone, price has consistently formed lower highs, confirming selling pressure and market intent. The recent bounce was shallow, and price is respecting previous resistance levels perfectly, validating the bearish continuation setup.
Fundamentally, the Canadian dollar is gaining strength off rising oil prices and improving economic data from Canada, while the US dollar remains under pressure as the market begins pricing in a potential Fed rate cut in the second half of 2025. With softer US economic indicators including lower consumer confidence and slowing GDP growth, the momentum clearly favors CAD in this pair. The divergence in monetary policy outlooks between the Bank of Canada and the Federal Reserve adds further downside bias to USDCAD.
Technically, the structure remains bearish, with a clean breakdown below the 1.3900 psychological level and clear rejection at the 1.40300 resistance zone. Market liquidity appears to be shifting below the current price, and with the pair printing consistent lower highs and lower lows, there's significant space toward our target zone near 1.34128. A rejection from the minor pullback zone between 1.38800–1.39000 could provide another entry opportunity for trend continuation traders.
USDCAD remains a high-probability short setup in line with both technical structure and current fundamentals. As long as price stays below the 1.40300 resistance, I expect the bearish trend to continue with increased momentum as we approach summer liquidity shifts. This trade is already deep in profit and aligns with key institutional selling zones, making 1.34300 a realistic and conservative target in the coming weeks.

USDJPY H4 | Bullish Bounce Off Based on the H4 chart analysis, the price is falling our buy entry level at 144.87, a pullback support that aligns with the 38.2% Fibonacci retracement.
Our take profit is set at 146.55, a pullback resistance.
The stop loss is placed at 143.86, a pullback support that aligns close to the 61.8% Fibonacci retracement.
High Risk Investment Warning
Trading Forex/CFDs on margin carries a high level of risk and may not be suitable for all investors. Leverage can work against you.
Stratos Markets Limited (tradu.com ):
CFDs are complex instruments and come with a high risk of losing money rapidly due to leverage. 63% of retail investor accounts lose money when trading CFDs with this provider. You should consider whether you understand how CFDs work and whether you can afford to take the high risk of losing your money.
Stratos Europe Ltd (tradu.com ):
CFDs are complex instruments and come with a high risk of losing money rapidly due to leverage. 63% of retail investor accounts lose money when trading CFDs with this provider. You should consider whether you understand how CFDs work and whether you can afford to take the high risk of losing your money.
Stratos Global LLC (tradu.com ):
Losses can exceed deposits.
Please be advised that the information presented on TradingView is provided to Tradu (‘Company’, ‘we’) by a third-party provider (‘TFA Global Pte Ltd’). Please be reminded that you are solely responsible for the trading decisions on your account. There is a very high degree of risk involved in trading. Any information and/or content is intended entirely for research, educational and informational purposes only and does not constitute investment or consultation advice or investment strategy. The information is not tailored to the investment needs of any specific person and therefore does not involve a consideration of any of the investment objectives, financial situation or needs of any viewer that may receive it. Kindly also note that past performance is not a reliable indicator of future results. Actual results may differ materially from those anticipated in forward-looking or past performance statements. We assume no liability as to the accuracy or completeness of any of the information and/or content provided herein and the Company cannot be held responsible for any omission, mistake nor for any loss or damage including without limitation to any loss of profit which may arise from reliance on any information supplied by TFA Global Pte Ltd.
The speaker(s) is neither an employee, agent nor representative of Tradu and is therefore acting independently. The opinions given are their own, constitute general market commentary, and do not constitute the opinion or advice of Tradu or any form of personal or investment advice. Tradu neither endorses nor guarantees offerings of third-party speakers, nor is Tradu responsible for the content, veracity or opinions of third-party speakers, presenters or participants.

USDJPY - Will the dollar weakness stop?!The USDJPY currency pair is above the EMA200 and EMA50 on the 4-hour timeframe and is moving in its ascending channel. In case of correction due to the release of today's economic data, we can see a downward trend and then see the demand zone and buy in that range with an appropriate risk-reward ratio. A credible break of the indicated resistance range will pave the way for the currency pair to rise.
Japanese Prime Minister Shigeru Ishiba emphasized that investment is more crucial to economic growth than tariffs, reaffirming Japan’s continued commitment to negotiating the removal of U.S. trade tariffs. He also pointed to encouraging signs in the Japanese economy following wage increases and offered an optimistic outlook on the country’s recovery.
Meanwhile, Bank of Japan Governor Kazuo Ueda, speaking on Wednesday, warned that significant volatility in ultra-long-term bond yields could affect short-term borrowing costs, which in turn might exert a stronger impact on the broader economy. His remarks highlight the BOJ’s growing focus on recent fluctuations in long-dated bond yields, which could influence the board’s decision next month regarding the pace of its bond purchase reduction.
Ueda explained that in Japan, short- and medium-term interest rates tend to have more direct influence on the economy than ultra-long yields, due to the maturity structure of household and corporate debt. However, he acknowledged in a parliamentary session that sharp moves in ultra-long yields can also affect long- and even short-term bond yields indirectly.
Turning to Friday’s inflation report, expectations suggest that overall inflation remained subdued in April, as falling gasoline prices provided some relief to household budgets. However, core inflation—excluding food and energy—remains stubbornly high.
The PCE inflation index is anticipated to have risen 2.2% in April from a year earlier, slightly down from 2.3% in March, marking the lowest level since last September. Federal Reserve officials are still awaiting more data on how newly imposed tariffs are feeding into the broader economy, making it unlikely that the recent moderation in inflation will prompt a rate cut in the near term.
Although the Fed’s preferred inflation measure may have reached its lowest point since September, a second consecutive month of encouraging price data is unlikely to be sufficient to justify easing interest rates.
According to a survey conducted by Dow Jones Newswires and The Wall Street Journal, economists expect Friday’s report—covering inflation, income, and spending—from the Bureau of Economic Analysis to show that consumer prices rose 2.2% year-over-year through April. This would mark the lowest reading since September and a potential turning point in the Fed’s battle against post-pandemic inflation.
Goldman Sachs economists noted that falling gasoline prices have more than offset the inflationary impact of new tariffs introduced by the Trump administration. However, they cautioned that this dynamic may not last, as retailers are likely to start passing along the added import tax costs to consumers in the coming months.
Several Federal Reserve officials, concerned that tariffs could reignite inflation, have stated that they will wait to assess the full impact of these trade policies on the economy before making changes to the federal funds rate—which directly affects borrowing costs on everything from mortgages and auto loans to credit cards.

USDJPY Returns to Key Support – Another Bounce Ahead?At the end of April and beginning of May, I pointed out the importance of the 142 support zone and argued that USDJPY could reverse to the upside, targeting the 146 resistance.
The pair did exactly that — not only hitting the 146 target, but also spiking as high as 148, reaching the next major resistance.
🔁 Now We're Back towards 142
Since mid-May, USDJPY has pulled back again and is now retesting the 142 area — the same zone that previously triggered a strong bounce.
📌 Outlook and Trading Plan
I still consider the 142 level a solid support, and this recent drop could offer a new buying opportunity.
Any dips under 142 that quickly reverse can be used to build long positions, with a target once more around 146.
That offers a clear trade setup with a good risk-to-reward ratio.
Disclosure: I am part of Trade Nation's Influencer program and receive a monthly fee for using their TradingView charts in my analyses and educational articles.

Skeptic | USD/JPY Analysis: Bearish Momentum Fuels Short Setups!Hey everyone, Skeptic here! I know some of you might’ve missed our last USD/CHF short signal that hit a sweet 3:1 R/R—no worries! 😊 The market’s always here, so missing a trade isn’t the end of the world. I’m not here to push FOMO; my goal is to take you on a long-term trading journey, and I’m stoked to have you along for the ride! :))) Let’s get back to USD/JPY and break down the latest action. 📊
Daily Timeframe: The Big Picture
First, let’s zoom out and talk about the DXY (US Dollar Index), which recently broke the 99.005 support and turned bearish. This puts USD-based pairs like USD/JPY in the spotlight for short opportunities this week. Here’s what’s happening with USD/JPY:
Trend Context: The major trend is bearish. Last week, sellers showed no mercy to buyers, and with DXY’s bearish move, we’re likely to see more of the same this week.
Key Level: We’re currently reacting to a major daily support at 142.305. Expect a range or reaction here, so we must wait for confirmation before shorting.
Recent Correction: The prior correction reached the 0.50% Fibonacci retracement and seems to have resumed the major bearish trend.
With this in mind, let’s zoom into the 4-Hour Timeframe to hunt for long and short setups.
4-Hour Timeframe: Long & Short Setups
The 4-hour chart is giving us some clear signals to work with. Here’s the plan:
Short Setup:
Key Level: The 142.338 level is critical, as it formed a ceiling at 148.569 in the past and acted as support before.
Trigger: If we form a lower high and then break below 142.305, open a short position.
Confirmation: Use RSI to back up the breakout, ensuring momentum aligns.
Why It Works: A lower high signals increasing weakness in this support, making a break more likely.
Long Setup:
My Take: I personally don’t have a long trigger right now. Both the major and minor trends are downtrends, so going long doesn’t make sense in these conditions.
If You Insist: If you’re set on a long, wait for a break above 144.125. But keep it tight—low risk, small stop loss, and take profits quickly once you hit a decent R/R.
💬 Let’s Talk!
If this analysis sparked some ideas, give it a quick boost—it really helps! 😊 Got a pair or setup you want me to dive into next? Drop it in the comments, and I’ll tackle it. Thanks for joining me—see you in the next one. Keep trading smart! ✌️

Bullish Reversal on Risk-On Shift and Channel BreakoutCMCMARKETS:USDJPY USD/JPY surged as risk appetite returned after a U.S. federal court blocked President Trump's "Liberation Day" tariffs, undermining demand for safe-haven assets like the yen. Meanwhile, weak demand in Japan’s 40-year bond auction raised concerns over fiscal stability, adding further downside pressure to JPY. Technically, the pair broke above a downward channel and formed a bullish engulfing pattern near the 144.90 demand zone. If price consolidates above 145.00, a test of the 148.15 resistance zone is possible. Traders now eye upcoming U.S. GDP and PCE inflation data for direction on Fed policy.
Resistance : 148.14 , 148.67
Support : 144.90 , 144.42

As Goes USD/JPY, so goes the USD USD/JPY continues to drive impact in broader USD themes and given the fact that there's still considerable carry remaining in the pair, the consequences of a deeper sell-off could bring impact to several macro markets. USD/JPY is about 40% above the early 2021 lows when the carry trade began to build on the back of stronger US inflation, and even as US rate cuts started last year and BoJ rate hikes began, the carry trade only started to unwind - until the bounce from 140.00 in Q3 of last year.
That same 140.00 level was back in action in April, right around the time that the USD bounced from a big spot of support on its own chart. And the four weeks that followed showed similar bounces in both markets. The pain for bulls last week was, similarly, felt in both markets.
But this week has shown a different tone as a higher-low has held in USD/JPY around 142.50 and for DXY, around the 98.98 Fibonacci level. As looked at in the USD post, there's now the possibility of a monthly doji and if that completes, there's turn potential for the US Dollar.
This would need to be supported by continued recovery in USD/JPY and for that, we're likely going to be looking for continued softening in longer-dated Japanese yields. Or else - as the divergence between Japanese and US rates continues to narrow, so too could the motivation for hedges and carry trades to close, putting downward pressure on the pair and the US Dollar.
In that scenario, I think USD/CAD and GBP/USD could remain as attractive venues for USD-weakness to play out. But in the opposite, with USD-strength showing, I'm still favoring EUR/USD for USD-strength to continue playing out. And also for the Yen, USD/JPY has been 'trappy' on both sides and I'd instead look to work with Yen-weakness against the British Pound (GBP/JPY) and Yen-strength against the Euro. - js

USDJPY | Smart Money Long Setup – Deep Fib + OB Reaction💴 USDJPY | Institutional Long Play with Perfect OB + Fib Confluence
Price gave us an aggressive push off the demand zone, showing clear Smart Money accumulation behavior. This setup is high probability based on Smart Money Concepts (SMC).
🔍 1. Technical Breakdown
Strong impulse move upward
Clean pullback into the Order Block
Confluence with 70.5%–79% Fibonacci retracement zone
Price respected the OB zone and printed higher highs
That reaction was institutional — no cap 🧢.
🧱 2. Bullish Confluences
🔥 Order Block (OB): Purple demand zone = unmitigated
📐 Fib Sweet Spot: 70.5%–79% = institutional re-entry levels
✅ Strong Wick Rejection: Shows absorption of sell-side liquidity
📈 Market Structure Shift: Break of structure to the upside
🎯 3. Trade Plan
Entry: 142.89 (within OB + 70.5%)
Stop Loss: 142.00
Take Profit: 145.49 zone
This setup targets the -27% fib extension — a classic institutional TP level.
⚖️ 4. RRR (Risk-Reward Ratio)
💰 Entry: 142.89
🔒 SL: 142.00
📍 TP: 145.49
✅ RRR ≈ 1:2.9
Solid intraday-to-swing play with clean structure.
🧠 5. Key Confirmation Points
Break and close above 144.36 = confirmed bullish intent
Price respecting 143.44 OB = bulls still in control
SL below OB = protected by demand block
💬 Comment “SMC Long Sniper 💹” if you caught this move!
🔄 Share this if you love OB + fib sniper entries
📌 Save this setup for your next demand zone playbook

GOLD - WAVE 4 CORRECTION TO $2,800 (UPDATE)Gold sellers have pushed Wave C back into last week's range low. Last week's candle closed bullish, so I'd like to see sellers close below the range low of $3,281 for a stronger confirmation of selling continuation.

Bullish momentum to extend?USD/JPY has bounced off the support level which is a pullback support and could rise from this level to our take profit.
Entry: 144.07
Why we like it:
There is a pullback support level.
Stop loss: 143.21
Why we like it:
There is a pullback supoprt level.
Take profit: 145.88
Why we like it:
There is a pullback resistance level that is slightly below the 61.8% Fibonacci retracement.
Enjoying your TradingView experience? Review us!
Please be advised that the information presented on TradingView is provided to Vantage (‘Vantage Global Limited’, ‘we’) by a third-party provider (‘Everest Fortune Group’). Please be reminded that you are solely responsible for the trading decisions on your account. There is a very high degree of risk involved in trading. Any information and/or content is intended entirely for research, educational and informational purposes only and does not constitute investment or consultation advice or investment strategy. The information is not tailored to the investment needs of any specific person and therefore does not involve a consideration of any of the investment objectives, financial situation or needs of any viewer that may receive it. Kindly also note that past performance is not a reliable indicator of future results. Actual results may differ materially from those anticipated in forward-looking or past performance statements. We assume no liability as to the accuracy or completeness of any of the information and/or content provided herein and the Company cannot be held responsible for any omission, mistake nor for any loss or damage including without limitation to any loss of profit which may arise from reliance on any information supplied by Everest Fortune Group.

USDJPY: Neutral View! One of The Hardest Forex Pair To TradeUSDJPY has not yet shown a clear move, ranging between 141 and 144. We are currently neutral as the price could go in either direction. Trade cautiously and manage risk according to your trade plan.
Thanks for your support! 😊
If you’d like to help us out, here are a few things you can do:
- Like our ideas
- Comment on our ideas
- Share our ideas
Team Setupsfx_
❤️
