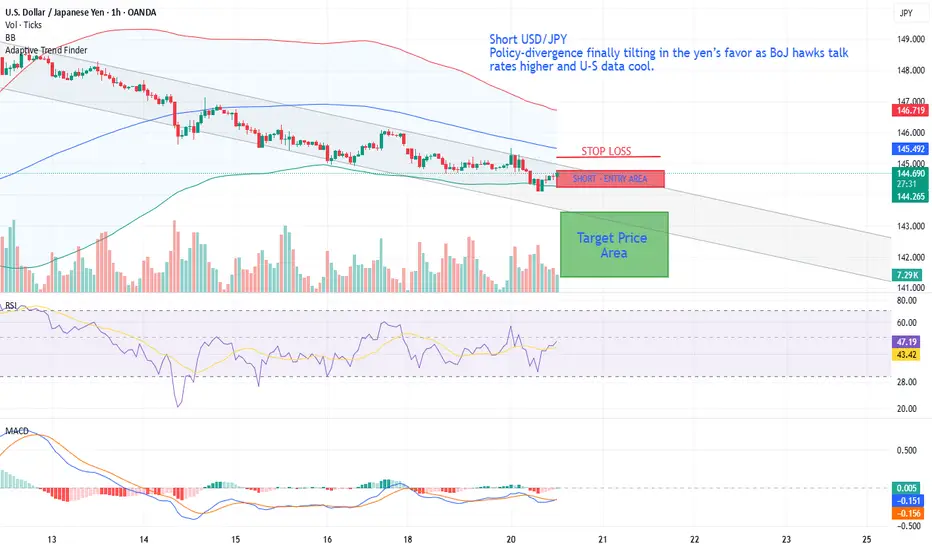
Short USD/JPYShort USD/JPY – policy-divergence finally tilting in the yen’s favor as BoJ hawks talk rates higher and U-S data cool.
• BoJ hawks signaling further 2025 hikes while Fed easing bets build → policy-divergence flips JPY-positive.
• Break & close below 38.2 % retracement and 200-SMA (H4) turns momentum south; hourly / daily RSI roll-over.
• Geopolitics easing removes safe-haven bid for USD, but not for JPY (BoJ still seen hiking).
• Bearish trigger deepens if 144.30 confluence (200-SMA H4 + 50 % Fib) gives way → air-pocket into 141s.
USDJPY
USDJPY:Is it a beginning of major bullish trend? Read CaptionThe price of USDJPY has shown a mixed volume, making it difficult to determine the trend. However, if we analyse the data, we can see that USD is gaining strength in the coming time. This could be due to the strong news coming in this week, which may divert the USDJPY towards the 150 price region. There are four potential targets that price could hit and surpass. Please use this analysis solely for educational purposes, as it does not provide any guarantees.
Good luck and trade safely.
Thanks for your support! 😊
If you’d like to help us out, here are a few things you can do:
- Like our ideas
- Comment on our ideas
- Share our ideas
Team Setupsfx_
❤️

EURAUD BULLISH OR BEARISH DETAILED ANALYSISEURAUD is currently presenting a textbook bullish setup with a well-defined falling wedge formation on the daily chart. After a strong impulsive rally in April, price has been consolidating within this wedge, forming consistent lower highs and lower lows—typical of a corrective pattern. Now, with price testing the upper trendline of the wedge, we are positioned for a potential breakout, supported by increasing bullish momentum and clean structure. With the current price around 1.75, the next leg higher toward the 1.85 resistance zone is well on the radar.
From a fundamental perspective, the euro is gaining strength on the back of improving Eurozone macro data, with recent PMI figures showing resilience and inflation staying moderately sticky—making the ECB cautious about aggressive rate cuts. Meanwhile, the Australian dollar continues to face headwinds amid declining commodity prices and weakening consumer sentiment. The Reserve Bank of Australia remains relatively dovish, especially as wage growth plateaus and inflation expectations cool. This EURAUD divergence sets the stage for a broader move in favor of the euro.
Technically, the breakout from this wedge structure would signify the continuation of the prior bullish trend, and given the size of the previous impulsive move, a breakout target of 1.85 is both conservative and well-aligned with market structure. The bullish divergence forming on oscillators such as RSI and MACD also confirms the slowing momentum in the downward move. A clean break and close above 1.7550 would be the trigger point for long positions, with invalidation below 1.7220.
This is a high-probability breakout setup with strong confluence across technical and fundamental indicators. With euro strength coming into play and AUD fundamentals remaining weak, I’m favoring the long side here. A move toward 1.85 is well-supported, and a break above the wedge could trigger significant upside in the coming sessions. This is a setup worth watching closely.

USDJPY Expected Growth! BUY!
My dear friends,
USDJPY looks like it will make a good move, and here are the details:
The market is trading on 144.56 pivot level.
Bias - Bearish
Technical Indicators: Supper Trend generates a clear short signal while Pivot Point HL is currently determining the overall Bearish trend of the market.
Goal - 145.11
About Used Indicators:
Pivot points are a great way to identify areas of support and resistance, but they work best when combined with other kinds of technical analysis
Disclosure: I am part of Trade Nation's Influencer program and receive a monthly fee for using their TradingView charts in my analysis.
———————————
WISH YOU ALL LUCK

Yen Steadies on US Credit DowngradeThe Japanese yen held firm near 144 per dollar, marking its fourth straight session of gains, bolstered by a weaker US dollar in the wake of Moody’s downgrade of the US credit rating. The move, prompted by fiscal concerns and rising deficits, dented dollar confidence globally.
Despite this, Japan’s own economic data weighed on sentiment, with GDP shrinking by 0.2% in Q1, its first contraction in a year and worse than anticipated. Investors are also closely watching the upcoming Japanese trade data with concerns about the impact of potential new US tariffs. A third round of US-Japan trade talks is set to begin in Washington by the end of the week, led by Japan’s chief negotiator Ryosei Akazawa.
USD/JPY faces immediate resistance at 148.60, with higher levels at 149.80 and 151.20. Key support is seen at 139.70, followed by 137.00 and 135.00.

Hanzo / USDJPY 15m Path ( Confirmed Breakout Zones )🔥 USD/JPY – 15 Min Scalping Analysis (Bearish Setup)
Bias: Waiting For Break Out
Time Frame: 15 Min
Entry Type: Confirmed Entry After Break Out
👌Bullish After Break Out : 144.550
👌Bearish After Break Out : 144.050
☄️ Hanzo Protocol: Dual-Direction Entry Intel
➕ Zone Activated: Strategic Reaction from Refined Liquidity Layer
Marked volatility from a high-precision supply/demand zone. System detects potential for both long and short operations.
🩸 Momentum Signature Detected:
Displacement candle confirms directional intent — AI pattern scan active.
— If upward: Bullish momentum burst.
— If downward: Aggressive bearish rejection.
💯 Market Zone: Transition Phase
Asset in premium-to-discount (or vice versa) range — valid for both reversal and continuation trades. Execute with precision.
USDJPY H4 | Bullish Bounce Based on the H4 chart analysis, the price is falling toward our buy entry level at 143.84, a pullback support that aligns with the 61.8 Fibonacci retracement.
Our take profit is set at 1146.73, a pullback resistance.
The stop loss is placed at 142.35, an overlap support.
High Risk Investment Warning
Trading Forex/CFDs on margin carries a high level of risk and may not be suitable for all investors. Leverage can work against you.
Stratos Markets Limited (tradu.com):
CFDs are complex instruments and come with a high risk of losing money rapidly due to leverage. 63% of retail investor accounts lose money when trading CFDs with this provider. You should consider whether you understand how CFDs work and whether you can afford to take the high risk of losing your money.
Stratos Europe Ltd (tradu.com):
CFDs are complex instruments and come with a high risk of losing money rapidly due to leverage. 63% of retail investor accounts lose money when trading CFDs with this provider. You should consider whether you understand how CFDs work and whether you can afford to take the high risk of losing your money.
Stratos Global LLC (tradu.com):
Losses can exceed deposits.
Please be advised that the information presented on TradingView is provided to Tradu (‘Company’, ‘we’) by a third-party provider (‘TFA Global Pte Ltd’). Please be reminded that you are solely responsible for the trading decisions on your account. There is a very high degree of risk involved in trading. Any information and/or content is intended entirely for research, educational and informational purposes only and does not constitute investment or consultation advice or investment strategy. The information is not tailored to the investment needs of any specific person and therefore does not involve a consideration of any of the investment objectives, financial situation or needs of any viewer that may receive it. Kindly also note that past performance is not a reliable indicator of future results. Actual results may differ materially from those anticipated in forward-looking or past performance statements. We assume no liability as to the accuracy or completeness of any of the information and/or content provided herein and the Company cannot be held responsible for any omission, mistake nor for any loss or damage including without limitation to any loss of profit which may arise from reliance on any information supplied by TFA Global Pte Ltd.
The speaker(s) is neither an employee, agent nor representative of Tradu and is therefore acting independently. The opinions given are their own, constitute general market commentary, and do not constitute the opinion or advice of Tradu or any form of personal or investment advice. Tradu neither endorses nor guarantees offerings of third-party speakers, nor is Tradu responsible for the content, veracity or opinions of third-party speakers, presenters or participants.

USD/ JPY) bullish trend analysis Read The ChaptianSMC trading point update
Technical analysis of 4-hour for USD/JPY (U.S. Dollar vs Japanese Yen). Here's the breakdown of the idea
---
1. Bullish Structure
The market is moving within a rising channel, indicating a bullish trend.
Higher highs and higher lows support the uptrend.
---
2. Key Zones
Support Zone (Demand Area): Around the 144.500–145.000 level, price has reacted positively here multiple times — it's marked as a strong support level.
Resistance Zone: Around 148.000 — this level is marked as an obstacle before reaching the final target point.
---
3. Indicators & Confluence
EMA 200: Price is currently testing just above/below the EMA 200 — a key dynamic support/resistance level.
RSI: Showing a bullish divergence or a potential recovery from oversold zone (both RSI lines are turning upward).
MACD-style Oscillator (Custom): Showing signs of a bullish crossover, confirming upward momentum.
---
4. Projection & Target
The expected move is a bounce from support, followed by:
A retest of resistance around 148.
A continuation to the target zone at 150.864 — marked as the final target point.
The potential move is approximately +592 pips (4.19%).
Mr SMC Trading point
---
Conclusion
This is a bullish continuation setup, expecting price to maintain above the support zone and ride the trendline and channel toward 150.864. The confluence of RSI, structure, and EMA adds strength to the idea.
Pales support boost 🚀 analysis follow)

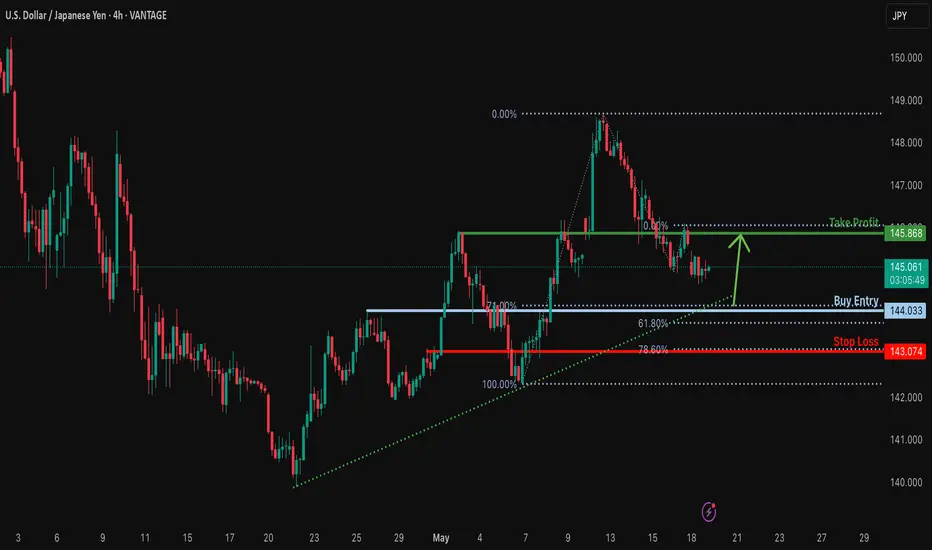
Could the price bounce from here?USD/JPY is falling towards the support level which is a pullback support that lines up with the 71% Fibonacci retracement and also lslightly above the 61.8% Fibonacci projection and could bounce from this level to our take profit.
Entry: 144.03
Why we like it:
There is a pullback support level that lines up with the 71% Fibonacci retracement.
Stop loss: 143.07
Why we like it:
There is a pullback support level that lines up with the 78.6% Fibonacci projection.
Take profit: 145.86
Why we like it:
There is an overlap resistance level.
Enjoying your TradingView experience? Review us!
Please be advised that the information presented on TradingView is provided to Vantage (‘Vantage Global Limited’, ‘we’) by a third-party provider (‘Everest Fortune Group’). Please be reminded that you are solely responsible for the trading decisions on your account. There is a very high degree of risk involved in trading. Any information and/or content is intended entirely for research, educational and informational purposes only and does not constitute investment or consultation advice or investment strategy. The information is not tailored to the investment needs of any specific person and therefore does not involve a consideration of any of the investment objectives, financial situation or needs of any viewer that may receive it. Kindly also note that past performance is not a reliable indicator of future results. Actual results may differ materially from those anticipated in forward-looking or past performance statements. We assume no liability as to the accuracy or completeness of any of the information and/or content provided herein and the Company cannot be held responsible for any omission, mistake nor for any loss or damage including without limitation to any loss of profit which may arise from reliance on any information supplied by Everest Fortune Group.
Hanzo / USDJPY 15m Path ( Confirmed Breakout Zones )🔥 USD/JPY – 15 Min Scalping Analysis (Bearish Setup)
Bias: Waiting For Break Out
Time Frame: 15 Min
Entry Type: Confirmed Entry After Break Out
👌Bullish After Break Out : 145.150
👌Bearish After Break Out : 144.650
☄️ Hanzo Protocol: Dual-Direction Entry Intel
➕ Zone Activated: Strategic Reaction from Refined Liquidity Layer
Marked volatility from a high-precision supply/demand zone. System detects potential for both long and short operations.
🔤 Smart Money Confirmation Acquired:
Structure break aligned with order block integrity.➗ Both bullish and bearish models validated. Tactical options open.
🔥Multi-Timeframe Confluence:🩸
Higher timeframe levels intersect — prime territory for sniper scalps in either direction.
🩸 Momentum Signature Detected:
Displacement candle confirms directional intent — AI pattern scan active.
— If upward: Bullish momentum burst.
— If downward: Aggressive bearish rejection.
💯 Market Zone: Transition Phase
Asset in premium-to-discount (or vice versa) range — valid for both reversal and continuation trades. Execute with precision.

USDJPY Will Go Up! Buy!
Take a look at our analysis for USDJPY.
Time Frame: 2h
Current Trend: Bullish
Sentiment: Oversold (based on 7-period RSI)
Forecast: Bullish
The market is testing a major horizontal structure 144.899.
Taking into consideration the structure & trend analysis, I believe that the market will reach 146.054 level soon.
P.S
Please, note that an oversold/overbought condition can last for a long time, and therefore being oversold/overbought doesn't mean a price rally will come soon, or at all.
Disclosure: I am part of Trade Nation's Influencer program and receive a monthly fee for using their TradingView charts in my analysis.
Like and subscribe and comment my ideas if you enjoy them!

USDJPY Technicals Price reacting near a key horizontal support level just below 145.00, where a visible bounce is attempting to form. This level has been tested multiple times, establishing it as a reliable demand zone, and price is now trying to stabilize after a sharp drop from the 146.20s. The recent move downward followed a failed bullish breakout attempt near a local resistance (highlighted with a red circle), which then turned into a supply zone around 145.70–145.80. That area has since capped further upside, resulting in a sell-off.
At current levels, there's a combination of technical signals suggesting a potential reversal or at least a short-term bounce. First, price has reached a structurally important area where previous buying interest was observed. Additionally, the Relative Strength Index (RSI) on the 30-minute chart shows values around 38–40, indicating the market is entering oversold territory without being extremely extended, which often aligns with corrective moves or base formations.
Volume analysis also supports the reversal idea. The recent bearish candles approaching the 145.00 support zone show decreasing bearish volume, followed by a slight uptick in buying pressure (as shown by the magenta lightning bolt icon), hinting at potential absorption of selling pressure and the beginning of buyer interest. This could mark the end of the down leg and the start of a higher low structure.
The projected path drawn on the chart suggests a bullish recovery scenario where price reclaims the mid-145s, retests prior minor resistance levels, and attempts to push toward the 146.00 handle again. However, this move is only valid if price holds above the current support. A breakdown below 144.90 would invalidate this idea and may lead to deeper downside.
In summary, the setup favors a bullish reversal off support, aided by RSI recovering from oversold conditions, a slowdown in bearish momentum, and historical support alignment. That said, price action confirmation (like bullish engulfing or a strong reclaim candle) is necessary to initiate a long position with tighter risk below the support base.

Fundamental Market Analysis for May 19, 2025 USDJPYThe USD/JPY pair attracted new sellers on Monday and fell to a one-week low of around 144.800 during the Asian session. Furthermore, the current economic climate suggests that the path of least resistance for spot prices remains to the downside, which supports the prospects for a continuation of the recent corrective decline from the nearly six-week high reached last Monday.
It is widely anticipated that the Bank of Japan (BoJ) will raise interest rates again in 2025, a development that is expected to continue providing support to the Japanese Yen (JPY). Furthermore, the unexpected downgrade of the US government's credit rating is discouraging investors from taking risks and is instead favouring traditional safe-haven assets, including the Japanese Yen. On Friday, Moody's downgraded America's main sovereign credit rating by one notch, to 'Aa1', citing concerns over the country's rising debt.
Meanwhile, investors seem convinced that the Federal Reserve (Fed) will continue to cut rates amid signs of weakening inflation and the likelihood that the US economy will see several quarters of sluggish growth. At the start of the new week, the US Dollar remains depressed and exerts additional downward pressure on the USD/JPY pair. However, the lack of follow-through selling below the psychological 145.00 mark is forcing bears to exercise caution before positioning themselves for deeper losses.
On Monday, the US will not release any market-moving economic data, so the dollar will be influenced by speeches by influential FOMC members. Furthermore, an improvement in risk sentiment is likely to result in increased demand for the Japanese Yen, thereby providing some momentum to the USD/JPY pair. However, the diverging policy expectations of the BoJ and the FOMC confirm the negative outlook for the near term. Consequently, any recovery attempt could be perceived as a strategic opportunity for divestment, and is likely to be constrained.
Trade recommendation: SELL 144.700, SL 145.500, TP 143.800

Bullish bounce off pullback support?USD/JPY is falling towards the pivot and could bounce to the 78.6% Fibonacci resistance.
Pivot: 143.80
1st Support: 140.52
1st Resistance: 148.62
Risk Warning:
Trading Forex and CFDs carries a high level of risk to your capital and you should only trade with money you can afford to lose. Trading Forex and CFDs may not be suitable for all investors, so please ensure that you fully understand the risks involved and seek independent advice if necessary.
Disclaimer:
The above opinions given constitute general market commentary, and do not constitute the opinion or advice of IC Markets or any form of personal or investment advice.
Any opinions, news, research, analyses, prices, other information, or links to third-party sites contained on this website are provided on an "as-is" basis, are intended only to be informative, is not an advice nor a recommendation, nor research, or a record of our trading prices, or an offer of, or solicitation for a transaction in any financial instrument and thus should not be treated as such. The information provided does not involve any specific investment objectives, financial situation and needs of any specific person who may receive it. Please be aware, that past performance is not a reliable indicator of future performance and/or results. Past Performance or Forward-looking scenarios based upon the reasonable beliefs of the third-party provider are not a guarantee of future performance. Actual results may differ materially from those anticipated in forward-looking or past performance statements. IC Markets makes no representation or warranty and assumes no liability as to the accuracy or completeness of the information provided, nor any loss arising from any investment based on a recommendation, forecast or any information supplied by any third-party.

USD/JPY) support level back up Read The ChaptianSMC Trading point update
Technical analysis of USD/JPY on the 4-hour timeframe suggests a bullish setup with the following key insights:
Analysis Overview:
1. Current Price: 147.492
2. Support Zone: Around 145.263 to 146.000
Marked as "Support Level / FVG" (Fair Value Gap), this is the potential demand zone where the price may retrace before bouncing.
3. Trendline: An ascending trendline is supporting the bullish structure.
4. EMA 200: Price is trading above the 200 EMA (145.263), which is generally a bullish signal.
5. RSI Indicator:
RSI is near overbought levels (currently at 63.46 and 70.56), suggesting strong bullish momentum but a potential pullback.
6. Target Zone: 151.360
Highlighted as the "Target Point" – this is the resistance area where price might face selling pressure.
Mr SMC Trading point
Trade Idea:
Entry: Buy on retracement into the support zone (around 145.5–146.0).
Stop Loss: Below the support zone or EMA (around 144.800 or as per risk tolerance).
Take Profit: Near the target zone around 151.360.
Risk-to-Reward: Favorable, approximately 1:2.5 to 1:3 depending on the entry.
Conclusion:
The idea is based on price respecting support, fair value gap (FVG), bullish structure, and a target based on recent price projections. If the price respects the support and bullish trendline, the bullish continuation towards 151.360 is a valid expectation.
Pales support boost 🚀 analysis follow)

Potential bearish drop?USD/JPY is reacting off the resistance level which is an overlap resistance that lines up with the 23.6% Fibonacci retracement and could drop from this level to our take profit.
Entry: 145.90
Why we like it:
There is an overlap resistance level that lines up with the 23.6% Fibonacci retracement.
Stop loss: 146.83
Why we like it:
There is a pullback resistance level that aligns with the 50% Fibonacci retracement.
Take profit: 144.35
Why we like it:
There is a pullback support level that is slightly above the 71% Fibonacci retracement.
Enjoying your TradingView experience? Review us!
Please be advised that the information presented on TradingView is provided to Vantage (‘Vantage Global Limited’, ‘we’) by a third-party provider (‘Everest Fortune Group’). Please be reminded that you are solely responsible for the trading decisions on your account. There is a very high degree of risk involved in trading. Any information and/or content is intended entirely for research, educational and informational purposes only and does not constitute investment or consultation advice or investment strategy. The information is not tailored to the investment needs of any specific person and therefore does not involve a consideration of any of the investment objectives, financial situation or needs of any viewer that may receive it. Kindly also note that past performance is not a reliable indicator of future results. Actual results may differ materially from those anticipated in forward-looking or past performance statements. We assume no liability as to the accuracy or completeness of any of the information and/or content provided herein and the Company cannot be held responsible for any omission, mistake nor for any loss or damage including without limitation to any loss of profit which may arise from reliance on any information supplied by Everest Fortune Group.

BUY USDJPY
USDJPY Buy Bias Analysis – May 2025
I'm bullish on USDJPY following the strong reversal from the weekly demand zone at 139.901 touched on April 21, 2025. The pair has shown consistent bullish sentiment since April 22, confirming institutional interest and price strength.
Seasonality supports this move, with historical patterns favoring USD strength during this period.
From COT (Commitment of Traders) perspective , commercial institutions are heavily long USDJPY, further reinforcing the bullish outlook. Their positioning often reflects informed, long-term sentiment.
Moreover, recent flows into the japanese Yen as a safe haven appear to be unwinding. With the USD regaining momentum, a massive sell-off in the Yen is likely, providing strong upside pressure on USDJPY.
In conclusion, with technical support, seasonal tailwinds, and institutional backing, I maintain a strong buy bias on USDJPY .
FOLLOW ME FOR WEEKLY BIAS

USDJPY - Trendline Support to Determine Next Big MoveThe USD/JPY pair has been trading within a well-defined upward trajectory, currently testing key levels around 145.68. The diagonal trendline visible on the chart serves as a critical support level that has consistently propelled the pair higher since mid-April. Should the price respect this trendline in the coming sessions, we could see a temporary pullback before potentially rallying toward the resistance zone around 148.50, highlighted by the upper purple rectangle. However, traders should closely monitor any breaks below this trendline as it would signal a significant shift in momentum and possibly indicate a deeper correction. The pair appears to be consolidating after the recent pullback from May highs, with the trendline interaction likely determining the next directional move.
Disclosure: I am part of Trade Nation's Influencer program and receive a monthly fee for using their TradingView charts in my analysis.

USDJPY Bullish Breakout Setup – Retest at Key Demand ZoneUSDJPY is respecting a clean bullish structure after rebounding from the 140.100 base. Price made a higher high near 148.650, followed by a pullback into the previous demand zone around 145.000.
Technical Breakdown:
Market Structure: Higher highs and higher lows indicate a strong uptrend.
Demand Zone: Clean reaction from the 145.000 zone, which previously acted as resistance-turned-support.
Target Zones:
First TP: 147.900 (previous swing high)
Final TP: 150.600 (key resistance level)
Invalidation Level : Close below 144.800 could invalidate this bullish scenario.
If price sustains above 145.000, the bullish trend is likely to continue.
As always, manage risk carefully.
Like & Follow for more clean, high-timeframe breakdowns!

USD_JPY RISKY SHORT|
✅USD_JPY made a bearish
Breakout of the key horizontal
Level of 146.133 which is a
Resistance now and the pair
Is now making a pullback
But as we are bearish biased
We will be expecting a move
Down after the pair retests
The new resistance
SHORT🔥
✅Like and subscribe to never miss a new idea!✅
Disclosure: I am part of Trade Nation's Influencer program and receive a monthly fee for using their TradingView charts in my analysis.

USDJPY and GBPJPY Analysis todayHello traders, this is a complete multiple timeframe analysis of this pair. We see could find significant trading opportunities as per analysis upon price action confirmation we may take this trade. Smash the like button if you find value in this analysis and drop a comment if you have any questions or let me know which pair to cover in my next analysis.

Yen Strengthens Despite Japan’s Q1 ContractionThe Japanese yen strengthened toward 145 per dollar, extending its rally for a fourth straight day, despite Japan’s economy shrinking by 0.2% in the first quarter, worse than forecasts. While the Bank of Japan acknowledged the risks posed by U.S. trade policies, it remains confident that rising wages and prices will support eventual policy normalization. Investors are closely watching U.S.-Japan trade negotiations, with Japan insisting that any deal must include the auto sector and that the 25% U.S. tariff on Japanese cars be removed.
Resistance is noted at 148.60, with further barriers at 149.80 and 151.20. Major support levels lie at 139.70, 137.00, and 135.00.

USDJPY Repriced for a Better Short OpportunityIn my initial trade shared during the Asian session, USDJPY swept the sell-side liquidity and formed a clear Fair Value Gap (FVG). Price action has now provided a refined entry point for a continuation short setup.
The recent liquidity sweep, followed by displacement, suggests that the market may aim for the recent low — with the potential to push even further if bearish momentum continues. My short position is now aligned with this structure, and I’ll be watching closely for signs of continuation or rejection near key support levels.
