USDJPY Will Fall! Short!
Please, check our technical outlook for USDJPY.
Time Frame: 1D
Current Trend: Bearish
Sentiment: Overbought (based on 7-period RSI)
Forecast: Bearish
The market is approaching a key horizontal level 145.311.
Considering the today's price action, probabilities will be high to see a movement to 140.353.
P.S
We determine oversold/overbought condition with RSI indicator.
When it drops below 30 - the market is considered to be oversold.
When it bounces above 70 - the market is considered to be overbought.
Disclosure: I am part of Trade Nation's Influencer program and receive a monthly fee for using their TradingView charts in my analysis.
Like and subscribe and comment my ideas if you enjoy them!
USDJPY

Yen Falls Past 145 as Dollar StrengthensThe Japanese yen weakened past 145 per dollar, hovering near a one-month low as the U.S. dollar strengthened with improving global trade sentiment and diminishing expectations of near-term U.S. rate cuts. The greenback gained momentum after President Trump announced a preliminary trade deal with the UK, the first since broad U.S. tariffs were introduced last month. He also signaled that tariffs on China could be eased, depending on the outcome of high-level trade talks set for this weekend in Switzerland.
Adding pressure on the yen, Fed Chair Powell dismissed the idea of a preemptive rate cut, citing persistent inflation risks and labor market concerns. In Japan, personal spending rose more than expected in March, suggesting resilience in consumption, though a third straight monthly drop in real wages highlighted broader economic challenges.
Resistance stands at 145.90, with further levels at 146.75 and 149.80. Support is found at 139.70, then 137.00 and 135.00.

USD/JPY Faces FVG ResistanceThe USD/JPY 1-hour chart shows a clear bearish setup forming after a recent rejection from the Fair Value Gap (FVG) zone around 145.923, indicating potential distribution and the start of a corrective move. The price is trading below the upper boundary of the ascending channel and has started to show bearish intent after multiple rejections from the FVG resistance zone.
The structure appears to be forming a corrective ABC wave or the beginning of a deeper Wave 4 correction within a larger Elliott Wave count. Fibonacci retracement levels from the recent low at 142.405 to the high at 145.923 have been plotted to identify potential support zones.
Target 1: 144.726
Target 2: 144.283
Stop loss: 145.850

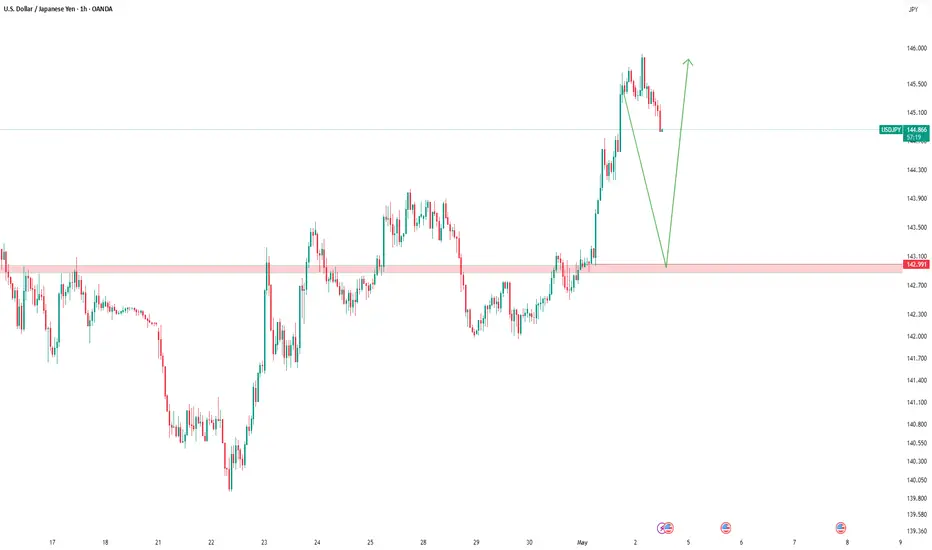
USDJPY with Price ActionPrice has broken above the key pivot zone around 145.00, which previously acted as resistance and may now flip into support. We’re currently seeing a minor pullback near the 145.60–146.00 zone after a strong bullish impulse. This red-circled area highlights hesitation, but as long as the price holds above the pivot, I’m maintaining a bullish bias.
The market structure remains clean with higher highs and higher lows. The volume spiked during the move up and has decreased on the pullback—exactly what I want to see in a healthy retracement. I'm watching for a bullish reaction at or slightly above 145.00 to confirm continuation.
If we get a strong bounce from the pivot zone, I’m targeting 147.00 as the first level and 148.50 as the extended target. However, if price breaks and closes below 145.00 with momentum, I’ll reassess—downside support could be around 143.50–144.00.
Next steps: Waiting for a confirmation entry signal (bullish engulfing or strong rejection wick) near the pivot. Key risk to this setup is upcoming USD news and any BoJ commentary that could trigger volatility.
Staying patient—will update if the pivot holds or fails.

Fundamental Market Analysis for May 9, 2025 USDJPYUSDJPY:
The Japanese yen (JPY) rises against its US counterpart during the Asian session on Thursday and reverses part of the previous day's correction from a one-week high. Minutes from the Bank of Japan's (BoJ) March meeting showed that the central bank remains open to further tightening if the economic and price outlook persists. This, along with a rebound in safe-haven demand, is lending support to the Japanese Yen, which, along with the emergence of fresh US Dollar (USD) selling, is keeping the USD/JPY pair below the 144.00 round figure.
Optimism over the start of trade talks between the US and China, which will take place this week in Switzerland, is fading rather quickly amid uncertainty over how a new deal between the world's two largest economies might be structured. In addition, US President Donald Trump has denied that he will reduce tariffs against China, dampening hopes of a speedy resolution to the trade war between the world's two largest economies. In addition, persistent geopolitical risks kept investors on edge and proved to be the key factor that influenced the yen's growth amid the general weakening of the dollar.
Trading recommendation: SELL 145.80, SL 146.00, TP 144.90

USD_JPY WILL GO DOWN|SHORT|
✅USD_JPY will be retesting a
Resistance level soon around 147.500
From where I am expecting a bearish reaction
With the price going down but we need
To wait for a reversal pattern to form
Before entering the trade, so that we
Get a higher success probability of the trade
SHORT🔥
✅Like and subscribe to never miss a new idea!✅
Disclosure: I am part of Trade Nation's Influencer program and receive a monthly fee for using their TradingView charts in my analysis.


USD/JPY H4 | Approaching a swing-high resistanceThe hawkish stance of the Federal Reserve and the market's optimistic sentiment regarding a potential Sino-US trade agreement have driven the overall strength of the US dollar. The Federal Reserve's suspension of interest rate cuts and the absence of hints of near-term rate cuts have enhanced the attractiveness of the US dollar, providing support for the upward movement of the USD/JPY exchange rate. On the four-hour chart, the Marlin oscillator has reversed downward from the zero line, which coincides with the reversal on the daily chart, forming a strong reversal pattern. The price is testing the support of the MACD line and the key level of 143.45. If the daily candlestick closes below the 143.45 level, it will open the path for a decline towards 141.70 and even the lower boundary of the price channel near 139.50. If the closing price is higher than yesterday's high of 144.00, it is likely to rise towards 144.75, with a long-term target of 145.91. Considering the actual closing price of 145.0930, the upward scenario has been activated. In addition, the MACD indicator shows that the bullish momentum has been somewhat restored, but it is still in the initial stage of the rebound. The RSI indicator remains above 45 and has not entered the strong area, indicating that the current exchange rate is in the stage of consolidation and accumulation of momentum. Although there has been a certain upward movement in the short term, the overall strength of the bulls and bears has not reached an obviously strong state.
you are currently struggling with losses, or are unsure which of the numerous trading strategies to follow, at this moment, you can choose to observe the operations within our channel.

USDJPY .. LONGOANDA:USDJPY
Price is nearing a critical level around .
No setup, no trade. For me, a solid plan always comes before any prediction.
****If the zone is broken and confirmed with a retest, I’ll adjust my plan accordingly for a possible reverse trade.
Weekly Forecasts UPDATES! ALL Markets Analyzed! Stocks & FOREXIn this Weekly Forecast UPDATE, we will analyze the S&P 500, NASDAQ, DOW JONES, Gold and Metals futures, and the FOREX Majors for Thursday, May 8th.
The targets set in last weekend's forecasts are still in play! Trade accordingly.
Enjoy!
May profits be upon you.
Leave any questions or comments in the comment section.
I appreciate any feedback from my viewers!
Like and/or subscribe if you want more accurate analysis.
Thank you so much!
Disclaimer:
I do not provide personal investment advice and I am not a qualified licensed investment advisor.
All information found here, including any ideas, opinions, views, predictions, forecasts, commentaries, suggestions, expressed or implied herein, are for informational, entertainment or educational purposes only and should not be construed as personal investment advice. While the information provided is believed to be accurate, it may include errors or inaccuracies.
I will not and cannot be held liable for any actions you take as a result of anything you read here.
Conduct your own due diligence, or consult a licensed financial advisor or broker before making any and all investment decisions. Any investments, trades, speculations, or decisions made on the basis of any information found on this channel, expressed or implied herein, are committed at your own risk, financial or otherwise.

USD/JPY H4 | Approaching a swing-high resistanceUSD/JPY is rising towards a swing-high resistance and could potentially reverse off this level to drop lower.
Sell entry is at 145.87 which is a swing-high resistance.
Stop loss is at 148.38 which is a level that sits above the 161.8% Fibonacci extension and a multi-swing-high resistance.
Take profit is at 142.41 which is a swing-low support that aligns close to a 61.8% Fibonacci retracement.
High Risk Investment Warning
Trading Forex/CFDs on margin carries a high level of risk and may not be suitable for all investors. Leverage can work against you.
Stratos Markets Limited (tradu.com):
CFDs are complex instruments and come with a high risk of losing money rapidly due to leverage. 63% of retail investor accounts lose money when trading CFDs with this provider. You should consider whether you understand how CFDs work and whether you can afford to take the high risk of losing your money.
Stratos Europe Ltd (tradu.com):
CFDs are complex instruments and come with a high risk of losing money rapidly due to leverage. 63% of retail investor accounts lose money when trading CFDs with this provider. You should consider whether you understand how CFDs work and whether you can afford to take the high risk of losing your money.
Stratos Global LLC (tradu.com):
Losses can exceed deposits.
Please be advised that the information presented on TradingView is provided to Tradu (‘Company’, ‘we’) by a third-party provider (‘TFA Global Pte Ltd’). Please be reminded that you are solely responsible for the trading decisions on your account. There is a very high degree of risk involved in trading. Any information and/or content is intended entirely for research, educational and informational purposes only and does not constitute investment or consultation advice or investment strategy. The information is not tailored to the investment needs of any specific person and therefore does not involve a consideration of any of the investment objectives, financial situation or needs of any viewer that may receive it. Kindly also note that past performance is not a reliable indicator of future results. Actual results may differ materially from those anticipated in forward-looking or past performance statements. We assume no liability as to the accuracy or completeness of any of the information and/or content provided herein and the Company cannot be held responsible for any omission, mistake nor for any loss or damage including without limitation to any loss of profit which may arise from reliance on any information supplied by TFA Global Pte Ltd.
The speaker(s) is neither an employee, agent nor representative of Tradu and is therefore acting independently. The opinions given are their own, constitute general market commentary, and do not constitute the opinion or advice of Tradu or any form of personal or investment advice. Tradu neither endorses nor guarantees offerings of third-party speakers, nor is Tradu responsible for the content, veracity or opinions of third-party speakers, presenters or participants.

USDJPY and GBPJPY Analysis todayHello traders, this is a complete multiple timeframe analysis of this pair. We see could find significant trading opportunities as per analysis upon price action confirmation we may take this trade. Smash the like button if you find value in this analysis and drop a comment if you have any questions or let me know which pair to cover in my next analysis.

Yen Firms with BoJ CautionThe Japanese yen strengthened to around 143.6 per dollar on Thursday, recovering as rising global trade uncertainty stimulated demand for gold. The move followed President Trump’s announcement of a deal with a “big” country, reportedly the UK, and his refusal to cut tariffs on China ahead of U.S.-China talks in Switzerland. U.S.-Japan negotiations continue, with Tokyo aiming to finalize a bilateral deal by June. Meanwhile, BoJ minutes showed policymakers remain open to rate hikes if inflation targets are met, though they flagged external risks from U.S. trade policy.
Resistance stands at 145.90, with further levels at 146.75 and 149.80. Support is found at 139.70, then 137.00 and 135.00.

USD/JPY: Ready for a Rally or a False Recovery?USD/JPY is at a crucial stage, with the price hovering around 143.900. After a bearish move, the market is attempting to recover, aiming for the resistance zone between 149.000 and 151.000.
COT Insight:
COT data shows a slight increase in long positions among speculative traders (+397), while commercials are increasing their short coverage (+539), indicating caution.
Seasonality:
Historically, May has been a slightly bullish month for USD/JPY (+0.42% over the last 10 years), but the trend has been negative in the last 5 years (-0.57%), indicating uncertainty.
Retail Sentiment:
65% of retail traders are long, which could indicate potential bearish pressure in case of opposite moves, given the risk of position liquidation.
Conclusion:
Carefully monitor the price reaction around 144.000. A breakout towards 149.000 could signal a significant move, but the long retail pressure might represent an obstacle.

USDJPYHello Traders! 👋
What are your thoughts on USDJPY?
On the USD/JPY chart, we observe a breakdown of the ascending channel, which could signal a potential trend reversal and growing bearish momentum.
Currently, the price is pulling back to the broken level.
Given the overall bearish structure, we expect the downtrend to resume after the pullback completes, potentially targeting lower support levels in the sessions ahead.
Don’t forget to like and share your thoughts in the comments! ❤️

usdjpy what next?After a corrective move within a rising channel, USDJPY has broken structure and is now forming a potential bearish flag pattern. The pair recently broke below the main ascending channel and is currently retesting it from below—signaling a possible continuation to the downside.
📌 Key Observations:
Major ascending channel violated
Retest forming a minor bear flag
Price struggling to reclaim previous support turned resistance
Potential drop toward the 141.000 – 139.000 zone
The bearish momentum may resume if price rejects current levels and breaks the minor flag to the downside. Confirmation on lower timeframes (e.g., H1 or M15) would strengthen the setup.
#USDJPY #ForexAnalysis #BearishFlag #TechnicalAnalysis #PriceAction #SmartMoney

USDCHF H4 I Bearish DropBased on the H4 chart, the price is approaching our sell entry level at 144.30, a pullback resistance that aligns close to the 50% Fibo retracement.
Our take profit is set at 142.61, an overlap support.
The stop loss is set at 145.49, a pullback resistance.
High Risk Investment Warning
Trading Forex/CFDs on margin carries a high level of risk and may not be suitable for all investors. Leverage can work against you.
Stratos Markets Limited (tradu.com):
CFDs are complex instruments and come with a high risk of losing money rapidly due to leverage. 63% of retail investor accounts lose money when trading CFDs with this provider. You should consider whether you understand how CFDs work and whether you can afford to take the high risk of losing your money.
Stratos Europe Ltd (tradu.com):
CFDs are complex instruments and come with a high risk of losing money rapidly due to leverage. 63% of retail investor accounts lose money when trading CFDs with this provider. You should consider whether you understand how CFDs work and whether you can afford to take the high risk of losing your money.
Stratos Global LLC (tradu.com):
Losses can exceed deposits.
Please be advised that the information presented on TradingView is provided to Tradu (‘Company’, ‘we’) by a third-party provider (‘TFA Global Pte Ltd’). Please be reminded that you are solely responsible for the trading decisions on your account. There is a very high degree of risk involved in trading. Any information and/or content is intended entirely for research, educational and informational purposes only and does not constitute investment or consultation advice or investment strategy. The information is not tailored to the investment needs of any specific person and therefore does not involve a consideration of any of the investment objectives, financial situation or needs of any viewer that may receive it. Kindly also note that past performance is not a reliable indicator of future results. Actual results may differ materially from those anticipated in forward-looking or past performance statements. We assume no liability as to the accuracy or completeness of any of the information and/or content provided herein and the Company cannot be held responsible for any omission, mistake nor for any loss or damage including without limitation to any loss of profit which may arise from reliance on any information supplied by TFA Global Pte Ltd.
The speaker(s) is neither an employee, agent nor representative of Tradu and is therefore acting independently. The opinions given are their own, constitute general market commentary, and do not constitute the opinion or advice of Tradu or any form of personal or investment advice. Tradu neither endorses nor guarantees offerings of third-party speakers, nor is Tradu responsible for the content, veracity or opinions of third-party speakers, presenters or participants.

USDJPYUSDJPY is overall bullish on the higher timeframe we had an impulse leg to the upside previously we are currently at a possible low to buy from i am currently long to the upside to 160

Bearish reversal off pullback resistance?USD/JPY is rising towards the resistance level which is a pullback resistance that aligns with the 38.2% and the 50% Fibonacci retracement and could reverse from this level to our take profit.
Entry: 143.72
Why we like it:
There is a pullback resistance level that line sup with the 38.2% and the 50% Fibonacci retracement.
Stop loss: 144.40
Why we like it:
There is a pullback resistance level that is slightly below the 61.8% Fibonacci retracement.
Take profit: 142.86
Why we like it:
There is an overlap support level.
Enjoying your TradingView experience? Review us!
Please be advised that the information presented on TradingView is provided to Vantage (‘Vantage Global Limited’, ‘we’) by a third-party provider (‘Everest Fortune Group’). Please be reminded that you are solely responsible for the trading decisions on your account. There is a very high degree of risk involved in trading. Any information and/or content is intended entirely for research, educational and informational purposes only and does not constitute investment or consultation advice or investment strategy. The information is not tailored to the investment needs of any specific person and therefore does not involve a consideration of any of the investment objectives, financial situation or needs of any viewer that may receive it. Kindly also note that past performance is not a reliable indicator of future results. Actual results may differ materially from those anticipated in forward-looking or past performance statements. We assume no liability as to the accuracy or completeness of any of the information and/or content provided herein and the Company cannot be held responsible for any omission, mistake nor for any loss or damage including without limitation to any loss of profit which may arise from reliance on any information supplied by Everest Fortune Group.

Yen rally ends, markets eyes Fed rate decision and BoJ minutesCurrently, the market sentiment is rather complex. On the one hand, some traders are betting on the restart of negotiations by the US side, believing that policy uncertainty will be alleviated with the convening of the meeting. On the other hand, from the perspective of the capital market, the market's concern about the medium - to - long - term depreciation trend of the US dollar is increasing. In particular, the " $2.5 trillion capital withdrawal" view proposed by the Eurizon SLJ report, if realized, will substantially suppress the US dollar.
In the short term, if the USD/JPY exchange rate fails to hold above the 145.5 level, the rebound may come to an end, and the price may test the two key support levels of 143.00 and 141.650. Especially if the Fed's policy language continues to be dovish, the exchange rate may decline further.
you are currently struggling with losses, or are unsure which of the numerous trading strategies to follow, at this moment, you can choose to observe the operations within our channel.

UJ is completing the correction for a big coming up moveFor now within the correction we are in to impulses to trade buy currently running an after target will sell too
Levels in the chart

Yen rally ends, markets eyes Fed rate decision and BoJ minutesThe Japanese yen is in negative territory on Wednesday, after a three-day rally which saw it gain 2% against the US dollar. In the European session, USD/JPY is trading at 143.29, up 0.61% on the day.
The Bank of Japan releases the minutes of its March meeting on Thursday. At the meeting, the BoJ held the key policy rate at 0.5% in a unanimous vote. Members cautioned that there was uncertainty over tariffs, which the US was expected to announce in April.
Since then, the financial markets have see-sawed in response to President Trump's erratic tariff policy. Japan's export-reliant economy could be hit hard, but Tokyo is already negotiating with the US and hopes to carve out an agreement to cancel or at least mitigate the impact of the tariffs.
The Bank of Japan is walking a tightrope, as it wants to continue to normalize policy and raise rates, but is worried about the uncertainty over the tariffs and the real possibility of a global trade war. Bank policymakers are taking a wait-and-see stance, hoping that US trade policy will become more clear.
The Federal Reserve is virtually certain to maintain rates at today's FOMC meeting. There's little doubt about the decision but investors will be all ears as to the amount of pushback from Fed Chair Jerome Powell, after President Trump has repeatedly pushed him to lower rates.
The markets have priced in a 30% chance of a cut in June, compared to a 63% likelihood just one week ago, according to CME's Fedwatch Tool. We can expect the pricing of a June cut to continue to swing, as the tariff saga continues.

GOLD - WAVE 4 CORRECTION TO $2,800 (UPDATE)Gold climbed higher, but very swiftly rejected our 0.365% zone, melting back down 740 PIPS. Should see a continuation to the downside.
But as I said yesterday, if we see a breach of $3,465 then we'll create an alternate analysis which'll show Gold leading towards a new ATH, creating a 'redistribution phase' at higher prices.
