USD/JPY - ShortWeekly (Bias Validation)
- Price between EMAs → ❌ Ranging
- Major Swing Point High: 158.880 Low: 146.543
D1 (Daily): Trend Bias
- Price below 200EMA & 50EMA on D1 → ✅ Bearish Bias
- Major Swing Point High: 154.804 Low: 146.543
- ✅ Break of Structure (BoS) + Volume Imbalance
- Price below Weekly VWAP → ✅ Bearish Bias
H4 (4-Hour): Trend Bias
- Price below 200EMA & 50EMA on D1 → ✅ Bearish Bias
- Major Swing Point High: 151.214 Low: 149.684
- ✅ Break of Structure (BoS) + Volume Imbalance
- Price below Weekly VWAP → ✅ Bearish Bias
- High-Probability Entry Zones (H4 OTE)
- H4 OB (OTE)
H1 (1-Hour): Trend Bias
- Swing Point High: 150.953 Low: 149.684
- ✅ Break of Structure (BoS) + Volume Imbalance
- H4 OB → (OTE)
- H1 OB → (OTE)
🔲 Validate with VWAP:
✔ ✅ H1 VWAP must align with H4 OTE before entry
✔ ✅ If price rejects H1 VWAP + OB midpoint, strong trade setup
🔲 Entry Options:
✔ Option 1 (Limit Order Entry):
* Place a limit order at the OB midpoint inside OTE
* Set stop-loss below OB (for longs) / above OB (for shorts)
✔ Option 2 (EMA Confirmation Entry):
* ✅ Enter when 9EMA crosses 21EMA near OTE
* ✅ Must have Volume Imbalance Confirmation
🔲 Final Confirmation:
✔ ✅ High Volume on Structure Break → Confirms strong move
✔ ✅ Low Volume on Pullback → Smart money accumulation
USDJPY

USD/JPY (Short)Daily:
Price < 200EMA
Swing Period 10
Swing High: 158.880
Swing Low: 146.543
Volume Imbalance: 5 Candles
Daily Order Block: 155.223 / 153.916
H4:
Price < 200EMA
Swing Period: 7
Swing High: 152.315
Swing Low: 146.597
Volume Imbalance: 3 Candles
H4 Order Block: 152.762 / 151.242
H1:
Swing Period: 5
Swing High: 152.315
Swing Low: 146.597
Volume Imbalance: 3 Candles
H1 Order Block: 151.762 / 151.628
Model 1:
Entry Price: 151.692
Stop Loss: 152.447
TP1: 150.115 @ 1:2 / 50%
TP2: 149.363 @ 1:3 / 25%
SL: Breakeven
TP3: 146.552 @ 1:5 / 25%
Model 2:
Entry Price: 151.108 - 150.141
Entry Trigger: 9EMA X 21EMA
SL: Above recent swing high
TP1: 1:2
SL: Trailing 9EMA

"Goooo...!!! Get to the safe-haven choppa!"And there we go... Market participants are in panic mode as tariff show kicks off. Everyone is trying to find a safe-haven like CHF and JPY. However, gold and silver are not the ones, where you need to be now.
Let's dig in!
TVC:GOLD
MARKETSCOM:USDCHF
MARKETSCOM:USDJPY
MARKETSCOM:JAPAN225
Let us know what you think in the comments below.
Thank you.
77.3% of retail investor accounts lose money when trading CFDs with this provider. You should consider whether you understand how CFDs work and whether you can afford to take the high risk of losing your money. Past performance is not necessarily indicative of future results. The value of investments may fall as well as rise and the investor may not get back the amount initially invested. This content is not intended for nor applicable to residents of the UK. Cryptocurrency CFDs and spread bets are restricted in the UK for all retail clients.

USDJPY Is Going Up! Buy!
Please, check our technical outlook for USDJPY.
Time Frame: 1D
Current Trend: Bullish
Sentiment: Oversold (based on 7-period RSI)
Forecast: Bullish
The market is approaching a key horizontal level 146.824.
Considering the today's price action, probabilities will be high to see a movement to 149.538.
P.S
Please, note that an oversold/overbought condition can last for a long time, and therefore being oversold/overbought doesn't mean a price rally will come soon, or at all.
Disclosure: I am part of Trade Nation's Influencer program and receive a monthly fee for using their TradingView charts in my analysis.
Like and subscribe and comment my ideas if you enjoy them!


USDJPYHello Traders! 👋
What are your thoughts on USDJPY?
USDJPY is moving within a descending channel and has currently reached the top of the channel, just below a resistance zone.
We anticipate some consolidation in this area, followed by a potential drop toward the bottom of the channel.
For a safer sell entry, it’s better to wait for a break below the specified support level.
After the breakout, a pullback to the broken support could offer a good sell opportunity.
💡Will USD/JPY respect the channel and head lower, or break out to the upside? Share your view below! 👇
Don’t forget to like and share your thoughts in the comments! ❤️

USD/JPY Stands Firm, But Volatility ExpectedVolatility has receded with less than 20-hours to go until Trump's tariffs are officially implemented, with traders now clearly in watch-and-wait mode. So while headline risks around tariffs remain in place, moves could remain limited unless traders are treated to any last-minute negotiations.
Typically, risk has benefitted when it has been expected that tariffs have been watered down. If that turns out to be the case by Trump's speech at 4pm ET Wednesday, indices could rise alongside the US dollar and the yen weaken.
Bit of course, the opposite is true. And that could weigh on USD/JPY. Rightly or wrongly, I'm feeling optimistic and now seeing a bounce on USD/JPY.
Two bullish pinbars found support and close above the 20-day SMA and monthly pivot point. The bias remains bullish while prices remain above Monday's low, and a break above 150 brings the 200-day SMA, February VPOPC and 152 handle into focus.
Matt Simpson, Market Analyst at City Index and Forex.com

USDJPYUSDJPY price is still in a downtrend. If the price cannot break through 150.97, it is expected that the price will drop. Consider selling the red zone.
🔥Trading futures, forex, CFDs and stocks carries a risk of loss.
Please consider carefully whether such trading is suitable for you.
>>GooD Luck 😊
❤️ Like and subscribe to never miss a new idea!

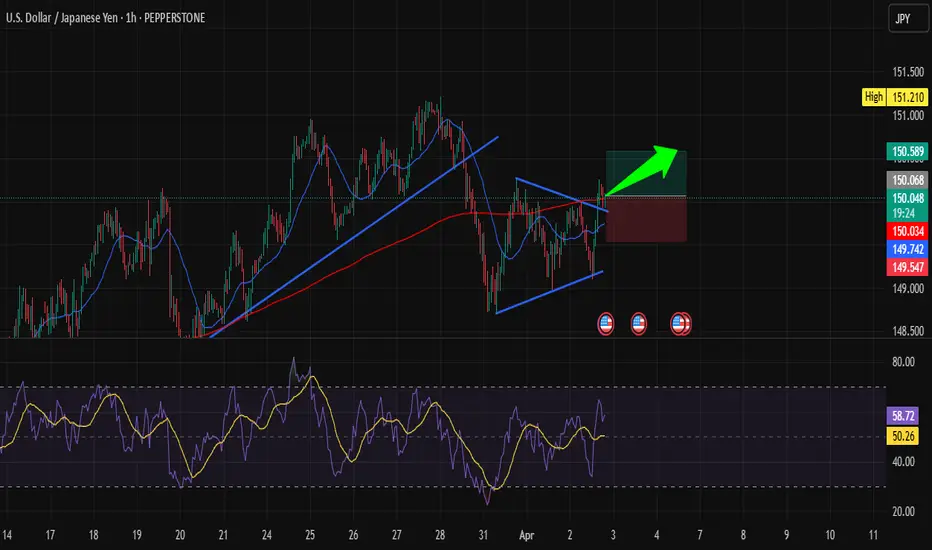
USD/JPY Ready to Take Off: Golden Opportunity on 1H!Hi traders! Analyzing USD/JPY on the 1H timeframe, spotting a potential entry:
🔹 Entry: 150.08
🔹 TP: 150.589
🔹 SL: 149.547
USD/JPY is breaking out of a bullish pennant pattern, suggesting a potential upward move. The RSI is holding above 50, indicating bullish momentum building up. If the price sustains above 150.08, we could see a push toward 150.589. Keep your eyes on price action and manage your risk!
⚠️ DISCLAIMER: This is not financial advice. Trade responsibly.
USDJPY: Long Signal with Entry/SL/TP
USDJPY
- Classic bullish setup
- Our team expects bullish continuation
SUGGESTED TRADE:
Swing Trade
Long USDJPY
Entry Point - 149.48
Stop Loss - 148.96
Take Profit - 150.43
Our Risk - 1%
Start protection of your profits from lower levels
Disclosure: I am part of Trade Nation's Influencer program and receive a monthly fee for using their TradingView charts in my analysis.
❤️ Please, support our work with like & comment! ❤️

USDJPY INTRADAY capped bearish below 151.20 awaits tariff dataThe USDJPY currency pair remains in a bearish trend, with the recent price action showing signs of an oversold bounce. While a temporary rebound is in play, the broader sentiment remains weak unless a decisive breakout occurs.
Key Levels to Watch:
Resistance Levels: 151.21 (critical level), 152.20, 153.04
Support Levels: 149.17, 148.26, 147.22
Bearish Scenario:
A rejection from the 151.21 resistance level could reaffirm the downside bias, leading to a continuation of the bearish move toward 149.17, with extended declines targeting 148.26 and 147.22 over the longer timeframe.
Bullish Scenario:
A breakout above 151.21 with a daily close above this level would challenge the bearish sentiment, opening the door for further gains toward 152.20, followed by 153.04.
Conclusion:
The market sentiment remains bearish, with 151.21 acting as a critical resistance zone. A rejection from this level could reinforce the downtrend, while a confirmed breakout would shift the outlook to bullish, favouring further upside. Traders should closely monitor price action at this key level for confirmation.
This communication is for informational purposes only and should not be viewed as any form of recommendation as to a particular course of action or as investment advice. It is not intended as an offer or solicitation for the purchase or sale of any financial instrument or as an official confirmation of any transaction. Opinions, estimates and assumptions expressed herein are made as of the date of this communication and are subject to change without notice. This communication has been prepared based upon information, including market prices, data and other information, believed to be reliable; however, Trade Nation does not warrant its completeness or accuracy. All market prices and market data contained in or attached to this communication are indicative and subject to change without notice.

USDJPY Short OpportunityPoint and Figure charting is the OG technical analysis method—no fancy candlesticks or bar charts needed. Unlike other charts, Point and Figure ignores time and focuses purely on price action, offering clarity amid market noise.
If candlestick charts look too chaotic for your taste, Point and Figure usually clears things up. Its simplicity is its best feature: fewer patterns and straightforward trade execution rules, compared to the 150+ patterns of Japanese Candlesticks.
On the USDJPY 40-pip/3-box reversal P&F chart, a bear flag pattern is currently being tested and acting as solid resistance. This creates an aggressive but appealing short entry opportunity at 148.80. Below this entry, there are multiple potential profit targets, with T3 (141.60) marking the maximum realistic expectation.
Now, before you get too excited about a single-column collapse from 148.80 down to 141.60—hold your horses. The odds of USDJPY making such a dramatic drop in one swift move are slim to none. But given the current international trade tensions, stranger things have happened.
Think of the area between 148.80 and 141.60 as a zone where it's easier for USDJPY to drift downward rather than grind upward.

USD/JPY : Bulls are coming back?! Let's See! (READ THE CAPTION)Upon analyzing the USD/JPY daily chart, we observe that the price precisely hit our previously forecasted target of 148.65 before declining further to 146.5. Following that, USDJPY rallied back up to 151 and is currently trading around 150.680. Should the price manage to stabilize above 150.5, we can anticipate further gains in this pair. This analysis will be updated accordingly.
Please support me with your likes and comments to motivate me to share more analysis with you and share your opinion about the possible trend of this chart with me !
Best Regards , Arman Shaban

EUR/USD: Ready for another Fall? (READ THE CAPTION)By examining the EUR/USD chart on the 3-day timeframe, we can see that the price has moved exactly as expected since our last analysis. After reaching the supply zone between 1.083 and 1.093, the pair began a correction and is currently trading around 1.079. Keep in mind, only if the price stabilizes below the 1.080 level can we expect further downside from this pair.
Please support me with your likes and comments to motivate me to share more analysis with you and share your opinion about the possible trend of this chart with me !
Best Regards , Arman Shaban

USDJPY Analysis todayHello traders, this is a complete multiple timeframe analysis of this pair. We see could find significant trading opportunities as per analysis upon price action confirmation we may take this trade. Smash the like button if you find value in this analysis and drop a comment if you have any questions or let me know which pair to cover in my next analysis.

USDJPY Technical AnalysisFenzoFx—USDJPY tested 150.25, a trading range below this level and the 50-period simple moving average. A close above 150.25 can trigger the uptrend, targeting 151.2.
Conversely, a dip below 148.2 invalidates the bullish outlook, with 148.2 as the first target and 147.43 as the secondary target.
