#USDJPY: Price is currently accumulating ! Wait For DistributionAt present, the USDJPY currency pair appears to be in an accumulation phase, as evidenced by the absence of significant price movement throughout the current week. Several factors contribute to this trend.
Firstly, several significant economic events are scheduled for this week, particularly tomorrow and Friday. These developments hold substantial implications for the future trajectory of the USDJPY pair. Consequently, there exists a possibility that the price may experience a decline prior to initiating a bullish trend.
Secondly, there are two primary areas where the price could reverse its course. The extent to which the USD reacts to the economic data will serve as an indicator of the potential reversal zones.
It is imperative that you conduct your own analysis before making any financial decisions. This chart should be utilised solely for educational purposes and does not guarantee any specific outcome.
Regarding the stop loss, as this is a swing trade, it is advisable to employ a larger stop loss if the price reaches entry zones. The take profit level can be determined based on your entry type and analysis.
We wish you the best of luck in your trading endeavours and emphasise the importance of trading safely.
Kindly share this analysis with others through likes, comments, and social media platforms. If you have any questions or require further assistance, please do not hesitate to comment below. We are here to provide support.
Team Setupsfx_
❤️🚀
USDJPY
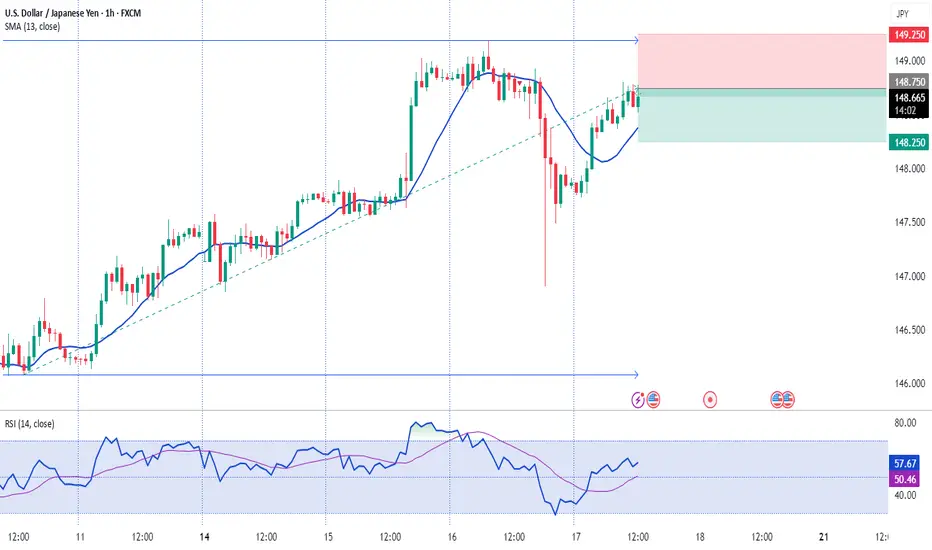
Japan's core CPI cools as expectedThe Japanese yen is showing little movement on Friday. In the North American session, USD/JPY is trading at 148.69, up 0.06% on the day. On the data calendar, Japan's inflation rate eased in June. It's a light day in the US, highlighted by UoM consumer sentiment and inflation expectations.
Inflation in Japan fell in June as expected and the yen is showing little movement today. Headline CPI dropped to 3.3% y/y from 3.5% in May, matching the consensus. This was the lowest level since Nov. 2024, as prices for electricity and gasoline rose more slowly in June. FoodThe inflation numbers come just before an election for Japan's Upper House of Parliament on Sunday. The ruling coalition is in danger of losing its majority, and if that happens, it will likely impact yields and the yen next week.
The Bank of Japan meets next on July 31 and is expected to continue its wait-and-see approach and hold interest rates. The BoJ hiked rates in January but hopes for a series of rate increases were dashed after US President Trump promised and delivered tariffs on many US trading partners, including Japan.
Trade talks between the US and Japan have bogged down and Trump has threatened to hit Japan with 25% tariffs if an agreement isn't reached by Aug. 1. In this uncertain environment, the BoJ isn't likely to raise interest rates. prices were up 7.2%, the most since March, as rice prices soared 100%. Monthly, CPI eased to 0.1%, down from 0.3% in May. Core inflation, which excludes fresh food but includes energy, fell to 3.3% from 3.7%, in line with the consensus and the lowest pace since March.
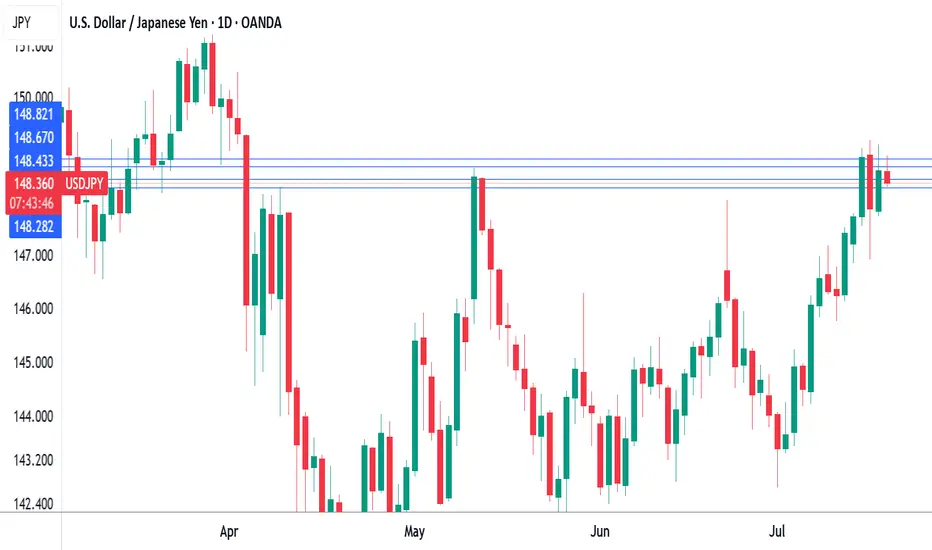
USD/JPY is testing resistance at 148.66. Above, there is resistance at 1.4882
148.44 and 148.28 are the next support levels
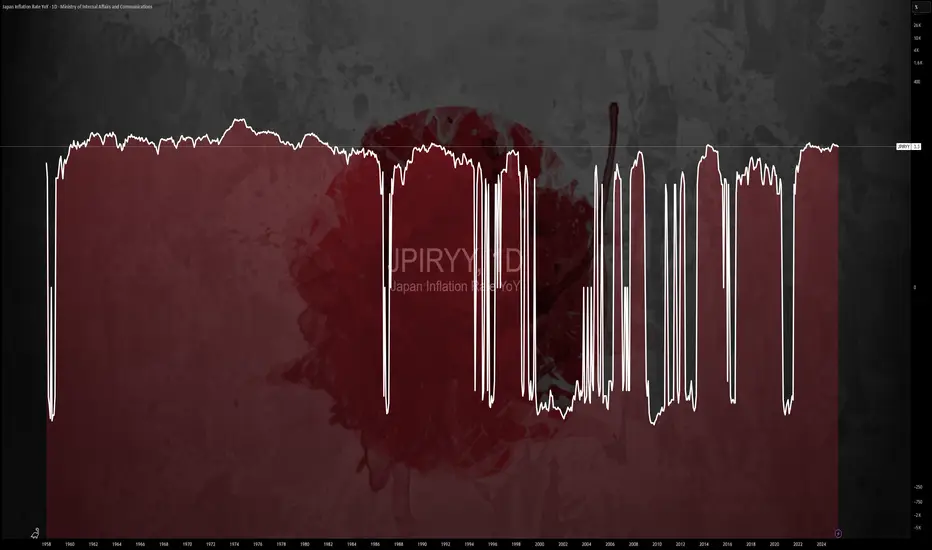
$JPIRYY -Japan Inflation Hits 7-Month Low (June/2025)ECONOMICS:JPIRYY 3.3%
June/2025
source: Ministry of Internal Affairs & Communications
-Japan’s annual inflation rate eased to 3.3% in June 2025 from 3.5% in May, marking the lowest reading since last November, as a sharp slowdown in electricity and gas prices offset persistent upward pressure from rice.
Core inflation also matched the headline rate at 3.3%, pointing to a three-month low and aligning with expectations.
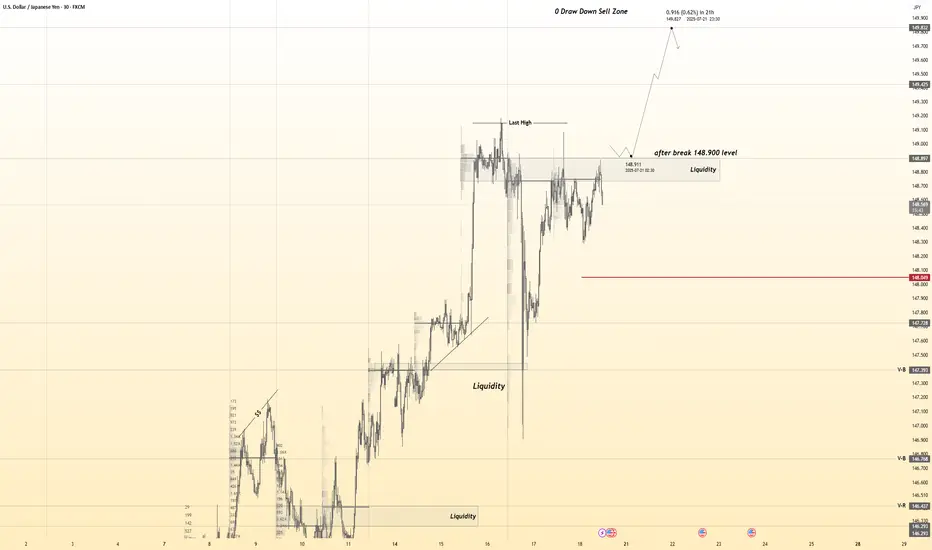
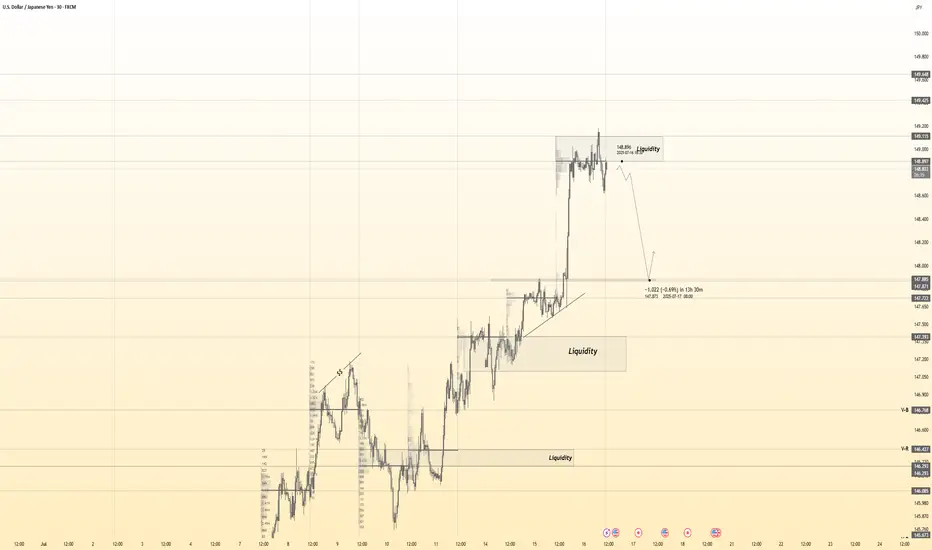
USDJPY 30Min Engaged ( Bullish After Breakout Entry Detected )————-
➕ Objective: Precision Volume Execution
Time Frame: 30-Minute Warfare
Entry Protocol: Only after volume-verified breakout
🩸 Bullish After Break : 148.900
➗ Hanzo Protocol: Volume-Tiered Entry Authority
➕ Zone Activated: Dynamic market pressure detected.
The level isn’t just price — it’s a memory of where they moved size.
Volume is rising beneath the surface — not noise, but preparation.
🔥 Tactical Note:
We wait for the energy signature — when volume betrays intention.
The trap gets set. The weak follow. We execute.
Yen Rebounds as Japan Inflation Stays ElevatedThe yen rose to around 148 per dollar on Friday, recovering from the previous day’s decline as markets assessed fresh inflation figures. Japan’s inflation eased slightly to 3.3% in June from 3.5% in May but remained above the Bank of Japan’s 2% target for the 39th straight month. This persistent overshoot has intensified speculation about possible policy tightening by the central bank.
Resistance is at 149.30, with major support at 147.50.
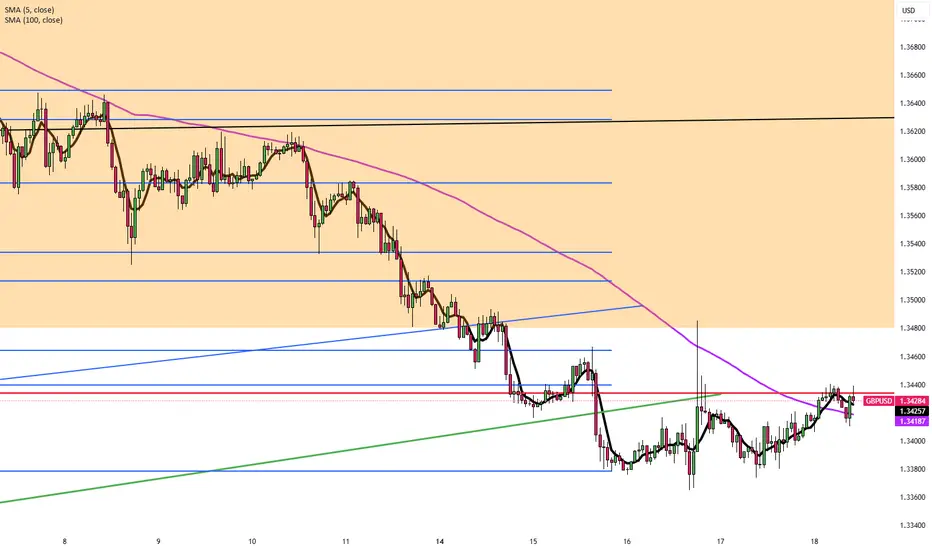
USD/JPY - Triangle Pattern (18.07.2025)The USD/JPY pair on the M30 timeframe presents a Potential Buying Opportunity due to a recent Formation of a Triangle Pattern. This suggests a shift in momentum towards the upside and a higher likelihood of further advances in the coming hours.
Possible Long Trade:
Entry: Consider Entering A Long Position around Trendline Of The Pattern.
Target Levels:
1st Resistance – 149.93
2nd Resistance – 150.65
🎁 Please hit the like button and
🎁 Leave a comment to support for My Post !
Your likes and comments are incredibly motivating and will encourage me to share more analysis with you.
Best Regards, KABHI_TA_TRADING
Thank you.
Disclosure: I am part of Trade Nation's Influencer program and receive a monthly fee for using their TradingView charts in my analysis.

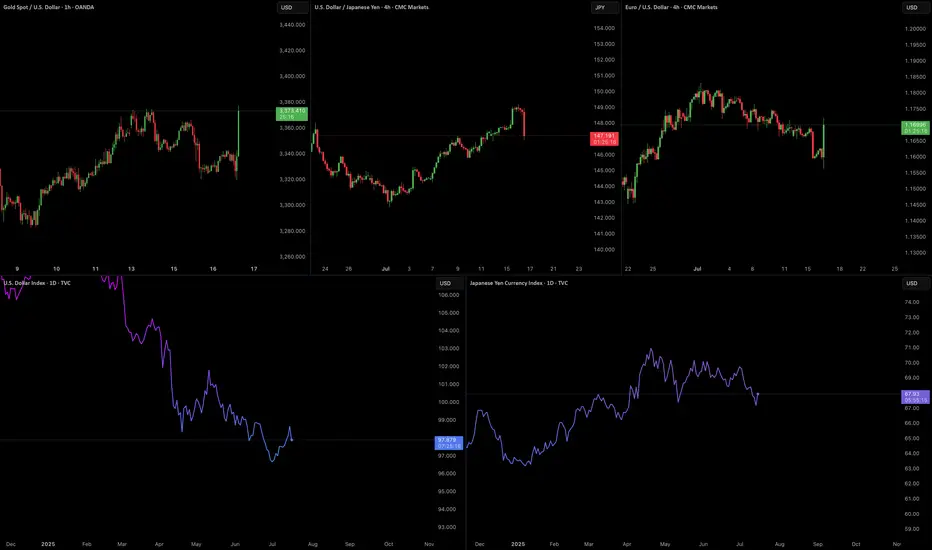
An arbitrage chance: NZ Dollar goes down & JP Yen goes upDue to economies trends and currency policies, USDJPY is going down in a long term (3 to 5 years) and NZDUSD is also going down in the next 3 years
Except for trend following trade for these 2 pairs, you can also set buy limit at the bottom of a value box for NZDJPY and sell limit at the top boarder of this box. Will take good P/L and good win rate positions for this crosspairs

Good setup to short USDJPYRecently the risk emotions caused by the White House and inflation worries it produced drives long term US Treasury yields rising, with 20-yr yield cross up to 5% once again.
Yet, you can see that the yield difference are still at a dropping trend. Moreover, the Fed is expected to cut 125 bps in the next 15 months according to the swap market.
Combined with the techincal levels, it's a good price to get into a short position of USDJPY. I don't know about you guys. I'm in

GOLD - Wave 2 Bullish Towards $3,406 (1H UPDATE)I see a possible buy opportunity towards $3,406 on Gold, as part of its bigger Wave 2 correction, before we can consider selling again.
Confluences👇
⭕️Wave 2 Correction Not Complete (2 Sub-Waves So Far).
⭕️Distribution Schematic Forming.
⭕️Early Sellers ($3,377) & Buyers ($3,310) Liquidated In Past 2 Days.
Now we've seen both buyers & sellers liquidated, we can expect to see a cleaner move back towards $3,400 where there is a lot of pending liquidity.

JAPAN as a HERO? UP! GOKU Last Fight! JAPAN is the last one to join the party! The final fight for the #BlowoffTop.
Why is this so important? If you look at correlations with BTC, global liquidity, China, the Fed’s interest rates, and more, Japan plays a key role. After China, Japan is the next to wake up and give the final push to this Bull Market.
The last time the Nikkei dropped more than 25% was during the COVID crash. What happened next? It rallied 26% in the first 52 days and extended its Bull Market to over 88% from the bottom.
With the current Carry Trade crisis (still unresolved), the TVC:NI225 has dropped more than 25% again, and guess what? It’s up 26% in the first 52 days... History doesn’t repeat, but it often rhymes.
It’s feeling like 2017 all over again... What do you think? 🚀📈

USDJPY SELL IDEAAfter yesterday's spiky move caused by d.trump
Market should correct some of those imbalance soon
Target at the ERL

SHORT ON USD/JPYNice CHOC (Change of Character) on USD/JPY
Followed by a retest to the supply area/zone with massive wick rejection.
I will be selling USD/JPY looking to catch over 200 pips to the next level of support/demand.

Yen Weakness Deepens as Dollar Strength ResurfacesThe Japanese Yen continues to struggle, extending its multi-session decline against the U.S. Dollar. This morning’s weakness followed disappointing Japanese trade data, with June’s surplus falling well short of expectations due to another sharp contraction in exports, particularly to China. This trend has renewed fears that Japan may be slipping into a technical recession, which has further undermined confidence in the Yen.
Beyond trade numbers, Japan’s macro landscape is becoming increasingly fragile. Real wages have declined, inflation is cooling, and the Bank of Japan’s path to normalizing policy now appears more uncertain. Adding to the pressure, political risk is also rising ahead of the upcoming Upper House election, leaving markets without a clear direction from fiscal leadership.
In contrast, the U.S. Dollar is enjoying a resurgence. Federal Reserve members, including Williams and Logan, hinted this week that rates could remain higher for longer, particularly as President Trump’s latest wave of tariffs adds to inflation concerns. The administration’s recent clarification that there are no plans to replace Fed Chair Jerome Powell has also calmed investor nerves, restoring faith in policy stability. The result: increased demand for the dollar at the Yen’s expense.
Technical Outlook:
• Current price: Just below 148.60 resistance
• Support: 147.90 and 147.50
• Breakout potential: A decisive move above 148.60 could open the door toward 149.60 and even test the psychological 150.00 mark—last seen in March.
• Indicators: Price is supported by the 100-hour EMA with positive oscillator alignment.
Momentum remains bullish unless support at 147.90 is breached.
Takeaway: Expect continued volatility as the Yen reacts to domestic data while USD remains supported by Fed hawkishness and trade tensions.

USD/JPY(20250717)Today's AnalysisMarket news:
The annual rate of PPI in the United States in June was 2.3%, lower than the expected 2.5%, the lowest since September 2024, and the previous value was revised up from 2.6% to 2.7%. Federal Reserve Beige Book: The economic outlook is neutral to slightly pessimistic. Manufacturing activity declined slightly, and corporate recruitment remained cautious.
Technical analysis:
Today's buying and selling boundaries:
147.97
Support and resistance levels:
150.23
149.38
148.84
147.11
146.56
145.72
Trading strategy:
If it breaks through 147.97, consider buying in, and the first target price is 148.84
If it breaks through 147.11, consider selling in, and the first target price is 146.56

USDJPY H1 I Bearish Reversal Based on the H1 chart, the price is approaching our sell entry level at 148.61, a pullback resistance that aligns with the 78.6% Fib retracement.
Our take profit is set at 147.57, an overlap support.
The stop loss is set at 149.18 a swing high resistance.
High Risk Investment Warning
Trading Forex/CFDs on margin carries a high level of risk and may not be suitable for all investors. Leverage can work against you.
Stratos Markets Limited (tradu.com ):
CFDs are complex instruments and come with a high risk of losing money rapidly due to leverage. 66% of retail investor accounts lose money when trading CFDs with this provider. You should consider whether you understand how CFDs work and whether you can afford to take the high risk of losing your money.
Stratos Europe Ltd (tradu.com ):
CFDs are complex instruments and come with a high risk of losing money rapidly due to leverage. 66% of retail investor accounts lose money when trading CFDs with this provider. You should consider whether you understand how CFDs work and whether you can afford to take the high risk of losing your money.
Stratos Global LLC (tradu.com ):
Losses can exceed deposits.
Please be advised that the information presented on TradingView is provided to Tradu (‘Company’, ‘we’) by a third-party provider (‘TFA Global Pte Ltd’). Please be reminded that you are solely responsible for the trading decisions on your account. There is a very high degree of risk involved in trading. Any information and/or content is intended entirely for research, educational and informational purposes only and does not constitute investment or consultation advice or investment strategy. The information is not tailored to the investment needs of any specific person and therefore does not involve a consideration of any of the investment objectives, financial situation or needs of any viewer that may receive it. Kindly also note that past performance is not a reliable indicator of future results. Actual results may differ materially from those anticipated in forward-looking or past performance statements. We assume no liability as to the accuracy or completeness of any of the information and/or content provided herein and the Company cannot be held responsible for any omission, mistake nor for any loss or damage including without limitation to any loss of profit which may arise from reliance on any information supplied by TFA Global Pte Ltd.
The speaker(s) is neither an employee, agent nor representative of Tradu and is therefore acting independently. The opinions given are their own, constitute general market commentary, and do not constitute the opinion or advice of Tradu or any form of personal or investment advice. Tradu neither endorses nor guarantees offerings of third-party speakers, nor is Tradu responsible for the content, veracity or opinions of third-party speakers, presenters or participants.

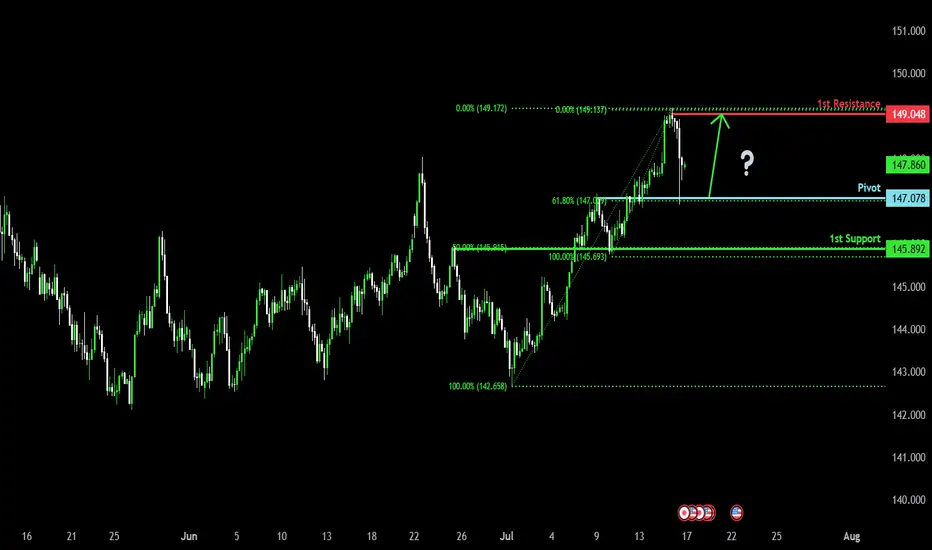
Bullish bounce off pullback support?USD/JPY is falling towards the pivot which aligns with the 61.8% Fibonacci retracement and could bounce to the 1st resistance.
Pivot: 147.07
1st Support: 145.89
1st Resistance: 149.04
Risk Warning:
Trading Forex and CFDs carries a high level of risk to your capital and you should only trade with money you can afford to lose. Trading Forex and CFDs may not be suitable for all investors, so please ensure that you fully understand the risks involved and seek independent advice if necessary.
Disclaimer:
The above opinions given constitute general market commentary, and do not constitute the opinion or advice of IC Markets or any form of personal or investment advice.
Any opinions, news, research, analyses, prices, other information, or links to third-party sites contained on this website are provided on an "as-is" basis, are intended only to be informative, is not an advice nor a recommendation, nor research, or a record of our trading prices, or an offer of, or solicitation for a transaction in any financial instrument and thus should not be treated as such. The information provided does not involve any specific investment objectives, financial situation and needs of any specific person who may receive it. Please be aware, that past performance is not a reliable indicator of future performance and/or results. Past Performance or Forward-looking scenarios based upon the reasonable beliefs of the third-party provider are not a guarantee of future performance. Actual results may differ materially from those anticipated in forward-looking or past performance statements. IC Markets makes no representation or warranty and assumes no liability as to the accuracy or completeness of the information provided, nor any loss arising from any investment based on a recommendation, forecast or any information supplied by any third-party.
GOLD Set for Big Move? | Key Zones + CPI Impact Explained !Gold Analysis – Key Levels + CPI Outlook!
In this video, I broke down the recent rejection from the $3366–$3369 resistance zone, the drop to $3346, and current price action around $3357.
We’ll also look ahead at what to expect with the upcoming CPI report — and how it could shape gold’s next big move.
📌 I’ve covered both bullish and bearish scenarios, shared key demand/supply zones, and outlined possible targets.
👉 For full context and trading strategy, make sure to watch the video till the end — and don’t forget to drop your opinion in the comments:
Do you think gold will break $3380 next, or are we headed for another pullback?
THE MAIN ANALYSIS :

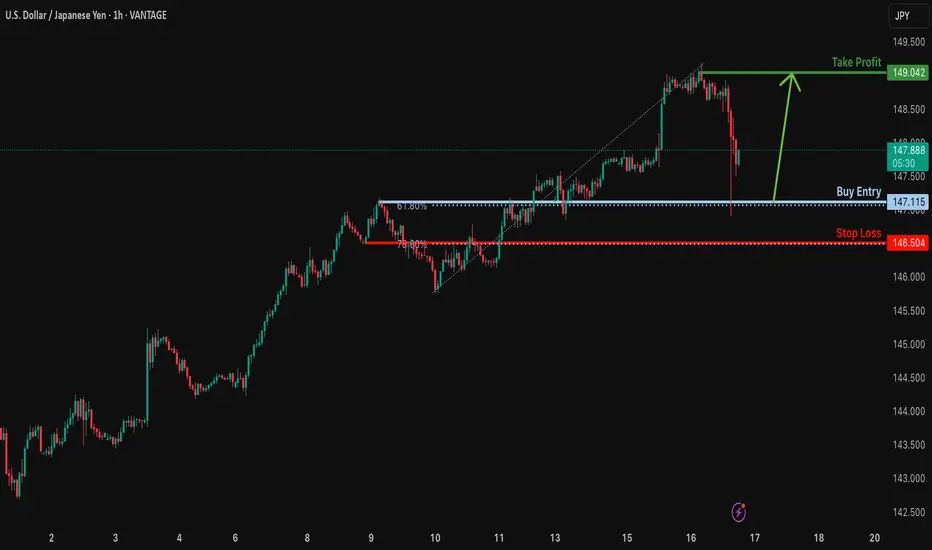
Bullish bounce off 61.8% Fibonacci support?USD/JPY is falling towards the support level which is an overlap support that aligns with the 61.8% Fibonacci retracement and could bounce from this level to our take profit.
Entry: 147.11
Why we like it:
There is an overlap support that lines up with the 61.8% Fibonacci retracement.
Stop loss: 146.50
Why we like it:
There is a pullback support that lines up with the 78.6% Fibonacci retracement.
Take profit: 149.04
Why we like it:
There is a pullback resistance.
Enjoying your TradingView experience? Review us!
Please be advised that the information presented on TradingView is provided to Vantage (‘Vantage Global Limited’, ‘we’) by a third-party provider (‘Everest Fortune Group’). Please be reminded that you are solely responsible for the trading decisions on your account. There is a very high degree of risk involved in trading. Any information and/or content is intended entirely for research, educational and informational purposes only and does not constitute investment or consultation advice or investment strategy. The information is not tailored to the investment needs of any specific person and therefore does not involve a consideration of any of the investment objectives, financial situation or needs of any viewer that may receive it. Kindly also note that past performance is not a reliable indicator of future results. Actual results may differ materially from those anticipated in forward-looking or past performance statements. We assume no liability as to the accuracy or completeness of any of the information and/or content provided herein and the Company cannot be held responsible for any omission, mistake nor for any loss or damage including without limitation to any loss of profit which may arise from reliance on any information supplied by Everest Fortune Group.
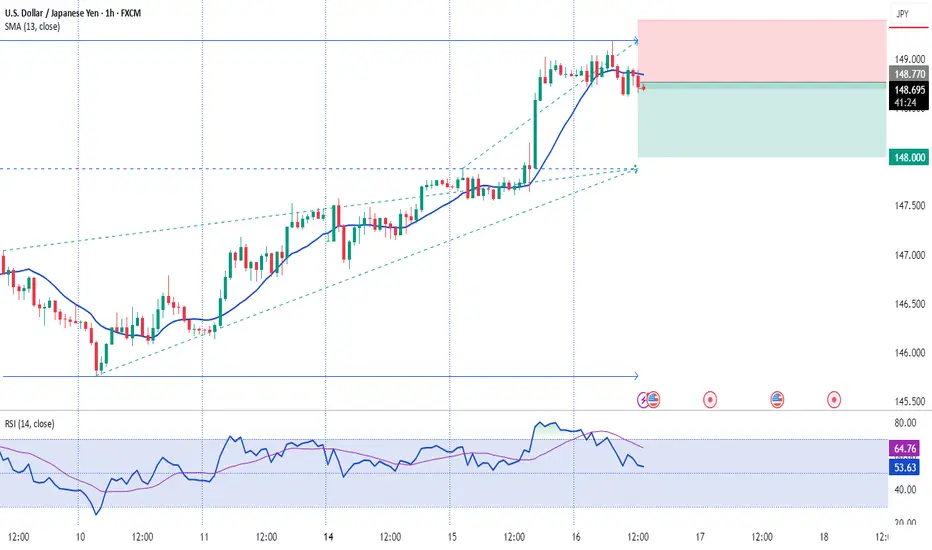
16.07.2025 #USDJPYSELL 148.770 | STOP 149.400 | TAKE 148.000 | ⏳ Close the trade in profit or move Stop Loss to breakeven after the price passes +25 pips.
Market Outlook - Trump Questions Powell’s Job - Gold RalliesNordKern active market outlook, reacting to the latest news.
Market Alert | Trump Questions Powell’s Job - Gold Rallies, Dollar Slips
Jul 16 2025 16:56:19 CET: CBS CITING SOURCES:
TRUMP ASKED REPUBLICAN LAWMAKERS IF HE SHOULD FIRE FED'S POWELL
Market Reaction:
OANDA:XAUUSD +$45/oz intraday, currently trading near session highs.
Safe-haven demand and inflation hedge as Fed credibility is questioned.
TVC:DXY Weakens notably against both the TVC:EXY and the TVC:JXY
Markets pricing in higher political risk premium, potential dovish tilt under Trump.
Volatility: Spiking across FX and commodities. VIX and MOVE indexes also showing upward pressure.
Context Matters:
While the Fed Chair cannot be dismissed without cause, even the suggestion of removal injects significant uncertainty into the macro backdrop. Historically, markets react negatively to perceived threats to Fed autonomy (see: Nixon-Burns, Trump-Powell 2018). This development comes just months before the U.S. election, adding a new layer of complexity for macro traders.
What to Watch:
- Fed Speakers: Any defense of Powell or pushback could stabilize markets. Or not.
- Trump Campaign Statements: Will he double down or walk it back?
- Upcoming Data: A dovish-leaning CPI/Jobs print could supercharge gold and further weigh on the dollar.
- Volatility: Traders should adjust position sizing and risk accordingly.
Increased geopolitical and monetary risk are back on the table. Traders should remain nimble, reduce leverage where appropriate, and stay alert to headline risk. Gold and FX are likely to remain reactive into the US session.
NordKern
USDJPY 30Min Engaged ( Bearish Entry Detected )Time Frame: 30-Minute Warfare
Entry Protocol: Only after volume-verified breakout
🩸Bearish move from : 148.900 Zone
➗ Hanzo Protocol: Volume-Tiered Entry Authority
➕ Zone Activated: Dynamic market pressure detected.
The level isn’t just price — it’s a memory of where they moved size.
Volume is rising beneath the surface — not noise, but preparation.
🔥 Tactical Note:
We wait for the energy signature — when volume betrays intention.
The trap gets set. The weak follow. We execute.
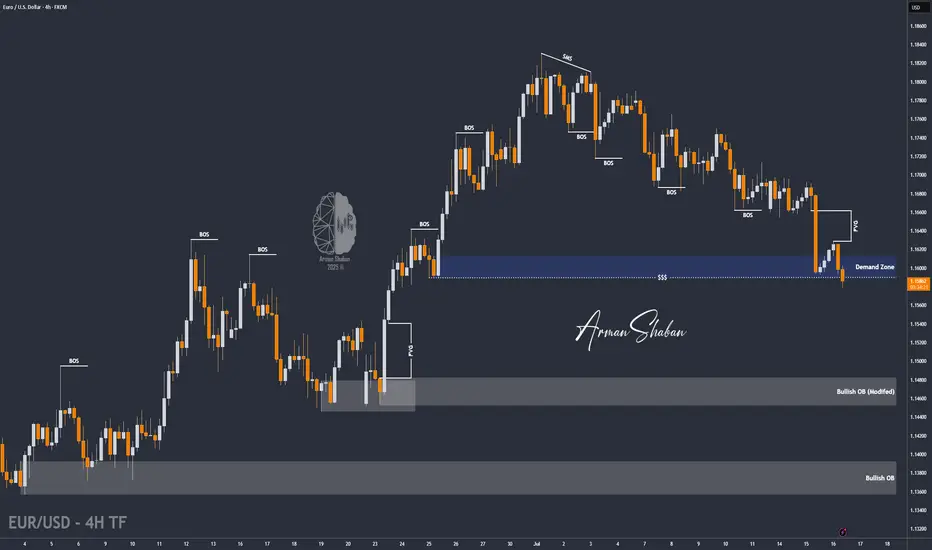
EUR/USD : Another Fall Ahead ? (READ THE CAPTION)By analyzing the EURUSD chart on the 4-hour timeframe, we can see that the price is currently breaking through the 1.16–1.158 zone. If it manages to hold below 1.159, we can expect further downside movement. The next targets for EURUSD are 1.15580, 1.154, and 1.148.
Please support me with your likes and comments to motivate me to share more analysis with you and share your opinion about the possible trend of this chart with me !
Best Regards , Arman Shaban