USDJPY and GBPJPY Top-down analysis Hello traders, this is a complete multiple timeframe analysis of this pair. We see could find significant trading opportunities as per analysis upon price action confirmation we may take this trade. Smash the like button if you find value in this analysis and drop a comment if you have any questions or let me know which pair to cover in my next analysis.
Usdjpyanalysis

USDJPY Trade For Short USDJPY Trading at resistance point for Descending Channel Pattern and breakout on downside from long up trend. USDJPY Trade For Short.

USDJPY Daily Analysis: Slight Bearish Bias Anticipated Amid Yen USDJPY Daily Analysis: Slight Bearish Bias Anticipated Amid Yen Strength and U.S. Dollar Weakness 26/11/2024
Introduction
USDJPY is expected to exhibit a slight bearish bias today as market dynamics favor the Japanese yen over the U.S. dollar. The yen's safe-haven status, coupled with declining U.S. Treasury yields and dovish Federal Reserve expectations, continues to apply downward pressure on the pair. This article explores the key fundamental and technical factors shaping the USDJPY outlook.
---
Key Drivers Influencing USDJPY
1. Japanese Yen’s Safe-Haven Appeal
The Japanese yen (JPY) remains supported by its safe-haven status, attracting investors amid persistent global economic uncertainties. Despite a modest improvement in risk sentiment, the yen continues to draw strength from its traditional role as a hedge against volatility, particularly as market participants look for stability.
2. Weaker U.S. Dollar
The U.S. dollar (USD) is under significant pressure due to dovish Federal Reserve policy expectations. Recent economic data, including subdued inflation and slowing retail sales, have reinforced market beliefs that the Fed will refrain from tightening monetary policy further, reducing the dollar’s appeal against the yen.
3. Falling U.S. Treasury Yields
U.S. Treasury yields are declining as markets price in stable interest rates and potential economic slowing in the U.S. Lower yields make the dollar less attractive to investors, further contributing to the bearish bias in USDJPY.
4. Improved Japanese Economic Data
Recent economic reports from Japan have painted a picture of gradual recovery, with improvements in industrial production and consumer sentiment. This strengthens the yen and adds additional downward pressure on USDJPY.
---
Technical Analysis
Moving Averages and RSI
USDJPY is trading below its 50-day moving average, signaling sustained bearish momentum. The Relative Strength Index (RSI) remains neutral but is trending lower, leaving room for further downside.
MACD and Key Levels
The MACD indicator continues to show a bearish crossover, indicating strong downward momentum. Immediate support lies at 146.50, while resistance is seen at 148.50. A break below the support level could lead to further declines toward the 145.00 level.
---
Conclusion
With the Japanese yen’s safe-haven appeal, weakening U.S. dollar, and falling Treasury yields, USDJPY is expected to maintain a slight bearish bias today. Traders should monitor global economic developments and any potential surprises in U.S. or Japanese economic data that could impact market sentiment.
---
SEO Tags:
- #USDJPYforecast
- #USDJPYanalysis
- #USDJPYtechnicalanalysis
- #ForexTradingUSDJPY
- #JapaneseYenStrength
- #USDWeakness
- #USDJPYtoday
- #ForexMarketOutlook
- #USDJPYprediction

USDJPY Daily Analysis: Slight Bearish Bias Expected Amid Yen USDJPY Daily Analysis: Slight Bearish Bias Expected Amid Yen Strength and U.S. Dollar Weakness 25/11/2024
Introduction
USDJPY is anticipated to exhibit a slight bearish bias today, influenced by the Japanese yen's safe-haven appeal, falling U.S. Treasury yields, and ongoing weakness in the U.S. dollar. With risk sentiment stabilizing globally and dovish Federal Reserve expectations weighing on the greenback, this pair's downside bias becomes increasingly apparent. In this analysis, we explore the fundamental and technical drivers shaping USDJPY’s market outlook.
---
Key Drivers Influencing USDJPY
1. Japanese Yen’s Safe-Haven Strength
The Japanese yen (JPY) remains supported by its safe-haven status, attracting investors amid persistent uncertainties in global economic growth. Despite a mild improvement in risk sentiment, the yen continues to benefit from its status as a reliable hedge, especially as market participants reduce exposure to riskier assets.
2. Weakening U.S. Dollar
The U.S. dollar (USD) is under pressure as expectations of further Federal Reserve rate hikes diminish. Recent U.S. economic data, including subdued inflation figures and slower retail sales growth, have reinforced the view that the Fed will maintain a dovish policy stance. This reduces the dollar's appeal against the yen.
3. Falling U.S. Treasury Yields
U.S. Treasury yields have declined in recent sessions as markets adjust to expectations of stable interest rates. Lower yields reduce the attractiveness of the USD, further supporting the bearish bias for USDJPY.
4. Geopolitical and Global Risk Sentiment
While geopolitical tensions have eased somewhat, the Japanese yen remains favored due to its consistent historical performance during periods of economic uncertainty. Stabilization in global markets hasn’t eroded the yen’s demand, particularly against the weaker dollar.
---
Technical Analysis
Moving Averages and RSI
USDJPY is trading below its 50-day moving average, a key signal of bearish momentum. The Relative Strength Index (RSI) is trending lower but has yet to reach oversold levels, suggesting room for additional downside moves.
MACD and Key Levels
The MACD indicator shows a bearish crossover, signaling downward momentum. Key support is at 147.00, while immediate resistance lies at 149.00. A sustained break below the 147.00 level could open the door for further declines.
---
Conclusion
Given the yen’s safe-haven appeal, ongoing dollar weakness, and declining U.S. Treasury yields, USDJPY is poised for a slight bearish bias today. Traders should monitor upcoming U.S. economic releases and global risk developments for potential volatility triggers.
---
SEO Tags:
- #USDJPYforecast
- #USDJPYanalysis
- #USDJPYtechnicalanalysis
- #ForexTradingUSDJPY
- #JapaneseYenStrength
- #USDWeakness
- #USDJPYtoday
- #ForexMarketOutlook
- #USDJPYprediction

USDJPY Long Setup for MondayNote :
Do your own Research and Trade Wisely Never rely on my opinions.
Good Luck folks
(Follow for more Valuable Updates)

USDJPY Daily Analysis: Slight Bearish Bias Expected Amid !!USDJPY Daily Analysis: Slight Bearish Bias Expected Amid Safe-Haven Yen Strength and Weak U.S. Dollar 22/11/2024
Introduction
USDJPY is anticipated to hold a slight bearish bias today as the Japanese yen benefits from its safe-haven appeal and the U.S. dollar remains under pressure due to dovish Federal Reserve expectations. Mixed global economic signals and declining U.S. Treasury yields are further weighing on the pair, while technical indicators suggest a continuation of the bearish momentum. This article highlights the key drivers shaping USDJPY and provides actionable insights for forex traders.
---
Key Drivers Influencing USDJPY Today
1. Safe-Haven Demand for the Japanese Yen
The Japanese yen (JPY) continues to attract demand as market participants navigate persistent geopolitical uncertainties and mixed global growth signals. Investors are gravitating toward safer assets like the yen, particularly amid concerns surrounding slowing U.S. economic momentum and fragile global risk sentiment.
2. Weak U.S. Dollar Amid Fed Dovishness
The U.S. dollar (USD) remains pressured following dovish comments from Federal Reserve officials. The market is increasingly pricing in a prolonged pause in rate hikes due to recent soft economic data, including lower retail sales and subdued inflation. This weakens the greenback’s appeal, contributing to USDJPY’s bearish outlook.
3. Declining U.S. Treasury Yields
U.S. Treasury yields have edged lower as markets adjust expectations for Fed monetary policy. Falling yields reduce the attractiveness of dollar-denominated assets, adding to the bearish bias for USDJPY.
4. Technical Indicators Align with Bearish Momentum
Technically, USDJPY has broken below key support levels, with indicators like the MACD and RSI signaling further downside potential.
---
Technical Analysis Indicators
Moving Averages and RSI
USDJPY is trading below its 50-day moving average, a clear sign of sustained bearish momentum. The Relative Strength Index (RSI) is edging closer to oversold territory, indicating that while further declines are possible, a consolidation phase might emerge.
MACD and Key Levels
The MACD indicator reflects a bearish crossover, confirming downward momentum. Immediate support for USDJPY is at 147.50, with resistance seen near 149.00.
---
Conclusion
With the Japanese yen gaining from safe-haven flows, a weaker U.S. dollar driven by dovish Fed expectations, and falling Treasury yields, USDJPY is expected to maintain a slight bearish bias today. Traders should monitor upcoming U.S. economic releases and shifts in global risk sentiment for potential volatility.
---
SEO Tags:
- #USDJPYforecast
- #USDJPYanalysis
- #USDJPYtechnicalanalysis
- #ForexTradingUSDJPY
- #JapaneseYenStrength
- #USDWeakness
- #USDJPYtoday
- #ForexMarketOutlook
- #USDJPYprediction

USDJPY Daily Analysis: Slight Bearish Bias Expected Amid Safe-HaUSDJPY Daily Analysis: Slight Bearish Bias Expected Amid Safe-Haven Demand and Fed's Dovish Tone 21/11/2024
Introduction
USDJPY is projected to hold a slight bearish bias today, driven by the strength of the Japanese yen as a safe-haven asset and the persistent dovish stance from the U.S. Federal Reserve. Weakening U.S. economic indicators and geopolitical concerns further fuel bearish sentiment, providing downward pressure on the currency pair. This article explores the fundamental and technical factors shaping USDJPY’s performance and offers insights for forex traders.
---
Key Drivers Influencing USDJPY Today
1. Increased Safe-Haven Demand for the Japanese Yen
The Japanese yen (JPY) remains supported by ongoing safe-haven demand amid global uncertainties. Heightened geopolitical tensions and concerns about slowing global growth have led investors to flock to the yen, exerting downward pressure on USDJPY.
2. Dovish Federal Reserve and Weak U.S. Dollar
The U.S. dollar (USD) continues to struggle as the Federal Reserve signals a cautious stance on monetary tightening. Recent U.S. data, including softer retail sales and cooling inflation, reinforce expectations that the Fed will maintain a pause in interest rate hikes. This dovish sentiment weakens the USD, further contributing to the bearish outlook for USDJPY.
3. Japan’s Stable Monetary Policy
The Bank of Japan’s (BoJ) commitment to its ultra-loose monetary policy remains unchanged. However, speculation about potential tweaks to its yield curve control strategy has bolstered the yen’s strength, adding to the bearish tone for USDJPY.
4. Technical Weakness in USDJPY
From a technical perspective, USDJPY has broken below key support levels, with momentum indicators suggesting further downside potential.
---
Technical Analysis Indicators
Moving Averages and RSI
USDJPY is trading below its 50-day moving average, signaling sustained bearish momentum. The Relative Strength Index (RSI) is trending lower but remains above oversold levels, indicating room for further declines without a reversal.
MACD and Support Levels
The MACD shows a bearish crossover, underscoring the pair’s downward momentum. The next significant support level lies at 147.00, which, if breached, could open the door for additional declines.
---
Conclusion
With strong safe-haven demand for the yen, dovish Federal Reserve signals, and bearish technical indicators, USDJPY is likely to maintain a slight bearish bias today. Traders should monitor U.S. economic releases and geopolitical developments, as they could introduce volatility and influence sentiment.
---
SEO Tags:
- #USDJPYforecast
- #USDJPYanalysis
- #USDJPYtechnicalanalysis
- #ForexTradingUSDJPY
- #JapaneseYenStrength
- #USDWeakness
- #USDJPYtoday
- #ForexMarketOutlook
- #USDJPYprediction

USDJPY Buy Trade IdeaHello Traders
In This Chart USDJPY HOURLY Forex Forecast By FOREX PLANET
today USDJPY analysis 👆
🟢This Chart includes_ (USDJPY market update)
🟢What is The Next Opportunity on USDJPY Market
🟢how to Enter to the Valid Entry With Assurance Profit
This CHART is For Trader's that Want to Improve Their Technical Analysis Skills and Their Trading By Understanding How To Analyze The Market Using Multiple Timeframes and Understanding The Bigger Picture on the Charts

USDJPY Daily Analysis: Slight Bearish Bias Anticipated Amid SafeUSDJPY Daily Analysis: Slight Bearish Bias Anticipated Amid Safe-Haven Yen Demand and Weaker U.S. Dollar 20/11/2024
Introduction
The USDJPY currency pair is expected to maintain a slight bearish bias today, driven by safe-haven flows into the Japanese yen (JPY) and continued softness in the U.S. dollar (USD). Geopolitical uncertainties, a dovish Federal Reserve outlook, and stable Bank of Japan (BoJ) policy are contributing to downward pressure on the pair. This article provides a detailed analysis of the key factors influencing USDJPY and offers valuable insights for traders navigating today’s market conditions.
---
Key Drivers Influencing USDJPY Today
1. Increased Demand for Safe-Haven Yen
The Japanese yen remains supported by its status as a safe-haven currency amid lingering geopolitical risks and mixed global economic conditions. Recent concerns surrounding slowing growth in key economies have fueled risk aversion, prompting investors to favor the yen, which puts downward pressure on USDJPY.
2. Weaker U.S. Dollar Amid Dovish Fed Signals
The U.S. dollar continues to face headwinds as the Federal Reserve maintains a cautious tone regarding future rate hikes. Softer-than-expected inflation data and moderated labor market growth have reinforced expectations that the Fed will keep rates steady, reducing demand for the USD and creating a bearish setup for USDJPY.
3. Stable BoJ Policy and Speculation on Tweaks
The Bank of Japan’s (BoJ) commitment to its ultra-loose monetary policy remains intact. However, growing speculation that the BoJ could adjust its stance in the future if inflation remains persistent has lent support to the yen. This dynamic further enhances the bearish pressure on USDJPY.
4. Technical Indicators Aligning with Bearish Momentum
USDJPY’s technical setup reflects bearish sentiment, with the pair trading below key moving averages and showing negative momentum on key indicators like the RSI and MACD.
---
Technical Analysis Indicators
Moving Averages and RSI
USDJPY is trading below its 50-day moving average, signaling ongoing bearish momentum. The Relative Strength Index (RSI) remains in a downward trajectory but stays above oversold territory, indicating room for further declines without an imminent reversal.
MACD and Volume Trends
The MACD shows a bearish crossover, confirming downside momentum. Additionally, volume analysis highlights increased selling activity, aligning with the overall bearish outlook for today.
---
Conclusion
With strong safe-haven demand for the yen, dovish signals from the Federal Reserve, and bearish technical indicators, USDJPY is likely to sustain a slight bearish bias today. Traders should remain attentive to any surprises in economic data or geopolitical developments that could shift sentiment.
---
SEO Tags:
- #USDJPYforecast
- #USDJPYanalysis
- #USDJPYtechnicalanalysis
- #ForexTradingUSDJPY
- #JapaneseYenStrength
- #USDWeakness
- #USDJPYtoday
- #ForexMarketInsights
- #USDJPYprediction

USDJPY - UniverseMetta - Signal#USDJPY - UniverseMetta - Signal
H4 - Formation of ABC structure from the lower border of the channel. Stop behind the minimum of wave C.
Entry: 154.290
TP: 155.358 - 156.752 - 158.857 - 162.307
Stop: 153.217

USDJPY: Anticipating a Bearish Move After Key Resistance TestUSDJPY is shaping up for a potential short setup, but patience is key as we wait for price to hit a critical resistance zone. Let’s break it down:
The Setup
Price is currently on a bullish push, targeting the highlighted zone at 154.332.
This resistance level is a key area where sellers could regain control. Once price enters this zone, I’ll be watching closely for signs of exhaustion or reversal to enter short.
The Plan
1️⃣ Entry Zone: I’m looking to go short from the 154.332 area, anticipating that the bullish momentum will lose steam here.
2️⃣ Stop Loss: My stop loss is placed at 155.397, safely above the resistance to protect against invalidation.
3️⃣ Take Profit: My primary target is the 152.242 support level, offering a solid risk-to-reward ratio.
Why This Makes Sense
This setup combines structure and momentum. The resistance at 154.332 aligns with previous price reactions, making it a strong area to expect sellers to step in. By positioning in this zone, I’m aiming to catch the reversal early without waiting for traditional confirmation.
Mindset Tip:
"It’s not about chasing trades; it’s about letting the market come to you. Know your levels, define your risk, and trust your process."

USD/JPY Analysis: Fundamental and Technical Outlook FX:USDJPY The recent price action in USD/JPY, characterized by a significant break through the upper pitchfork boundary with substantial momentum and volume, suggests an important moment for the currency pair. This technical development aligns with several fundamental factors influencing both the U.S. dollar and the Japanese yen.
Technical Analysis:
Breakout Confirmation: The breach of the upper pitchfork boundary indicates strong bullish momentum. However, to validate this move, it's essential to observe whether the price can sustain above this level or if it will retest and potentially fall back into the previous channel.
Key Support and Resistance Levels:
Support: The 150 level serves as a critical support. A decline below this threshold could signal a return to the long-term consolidation range between 80 and 150, which persisted for 27 years prior to 2022.
Resistance: If the price reclaims the upper channel, we may see the continuation of the uptrend with huge momentum.
Fundamental Analysis:
Bank of Japan Hawkish Stance: The BOJ has recently adopted a more hawkish tone, hinting at potential policy tightening. Governor Kazuo Ueda has indicated progress toward sustained wage-driven inflation, suggesting that interest rate hikes could be on the horizon.
Japanese Intervention: Japan’s Finance Minister has expressed concerns over excessive yen depreciation, hinting at possible intervention if the yen weakens too much. This stance aims to prevent the yen from falling to levels that could harm the economy by increasing import costs.
Federal Reserve's (Fed) Dovish Shift: In contrast, the U.S. Federal Reserve appears to be concerned with the current economical development, especially about the unemployment level, with discussions around more potential rate cuts emerging. This dovish outlook is influenced by concerns over rising U.S. debt levels and a slowing economy.
U.S. Debt: The U.S. is grappling with escalating debt, with the debt-to-GDP ratio nearing 100%. This situation is reminiscent of the economic conditions preceding the DotCom Bubble from 2000, raising concerns about potential economic instability. Not mentioning that the US credit card debt is record high.
More to read about this:
nypost.com
www.wsj.com
www.marketwatch.com
www.cnbc.com
Outlook:
The convergence of these technical and fundamental factors suggests that USD/JPY may not revisit recent highs in the near term. Instead, the pair could stabilize within the 140-150 range as the market seeks equilibrium amid contrasting monetary policies and economic conditions in the U.S. and Japan.
Risk Management:
Given the inherent volatility and unpredictability of forex markets, it's crucial to implement robust risk management strategies. Market dynamics can shift rapidly, and while current analyses provide a framework, they are not guarantees of future performance. Always conduct thorough research and remain adaptable to changing market conditions.
Disclaimer: This analysis is for informational purposes only and does not constitute financial advice. Always perform your own analysis before making trading decisions.

USDJPY Daily Analysis: Slight Bearish Bias Expected !!USDJPY Daily Analysis: Slight Bearish Bias Expected Amid Safe-Haven Yen Demand and Fed's Dovish Outlook 19/11/2024
Introduction
USDJPY is expected to exhibit a slight bearish bias today, influenced by a combination of safe-haven demand for the Japanese yen (JPY), a dovish stance from the Federal Reserve, and weaker U.S. economic sentiment. Traders are closely monitoring geopolitical and economic developments, which continue to favor the yen over the dollar in today’s market conditions. This article explores the key drivers behind USDJPY’s expected movement and provides actionable insights for traders.
---
Key Drivers Influencing USDJPY Today
1. Increased Demand for Safe-Haven Yen
The Japanese yen, a traditional safe-haven currency, continues to attract investors amid ongoing geopolitical uncertainties and concerns over global economic growth. Elevated risk aversion in financial markets is driving capital flows into the yen, adding downward pressure on USDJPY.
2. Dovish Federal Reserve Weighing on USD
The Federal Reserve’s recent dovish tone, signaling a pause in interest rate hikes, has weakened the U.S. dollar’s appeal. Softer U.S. inflation and mixed labor market data have reinforced expectations that the Fed will maintain its cautious approach. This sentiment limits USD strength, favoring a bearish outlook for USDJPY.
3. Bank of Japan Policy Stability Supporting Yen
Although the Bank of Japan (BoJ) remains committed to its accommodative monetary policy, recent comments suggest that further adjustments could be considered if inflation remains persistent. The stability in BoJ policy, combined with speculative expectations for eventual normalization, has lent support to the yen, strengthening its position against the U.S. dollar.
4. Technical Indicators Highlight Bearish Momentum
From a technical perspective, USDJPY is trading below key resistance levels, and momentum indicators signal further downside potential. The pair's failure to break above its 50-day moving average reinforces the bearish sentiment, aligning with today’s fundamental factors.
---
Technical Analysis Indicators
Moving Averages and RSI
USDJPY is trading below its 50-day moving average, signaling bearish momentum. The Relative Strength Index (RSI) is trending lower but remains above oversold levels, indicating the potential for further declines.
MACD and Volume Analysis
The Moving Average Convergence Divergence (MACD) indicator is showing a bearish crossover, confirming downward momentum. Volume analysis reflects increasing selling pressure, which supports today’s bearish bias.
---
Conclusion
Given the safe-haven demand for the yen, the dovish outlook from the Federal Reserve, and supportive technical indicators, USDJPY is expected to maintain a slight bearish bias today. Traders should remain vigilant for any geopolitical developments or surprise economic data that could influence the pair’s direction.
---
SEO Tags:
- #USDJPYforecast
- #USDJPYanalysis
- #USDJPYtechnicalanalysis
- #ForexTradingUSDJPY
- #JapaneseYenStrength
- #USDWeakness
- #USDJPYtoday
- #ForexMarketInsights
- #USDJPYprediction

USDJPYUSDJPY . Potential long opportunity.
After USDJPY has made its correction down to the trend line , the pair is still following the structure and still remains bullish . While USD is still “the best performing currency” at the moment, we can also take that into consideration for the bull move we are anticipating. If our SL is hit, the pair would be breaking structure and make deeper pullbacks in the price. Our SL (Stop Loss) is sitting at 153.758 . An important KL (Key Level) we have to look at is 155.626 . If the KL is broken to the upside, we would see our TP (Take Profit) hit, which is sitting at 157.865 .
PARAMETERS
- Entry: 154.815
- SL: 153.758
- TP: 157.865
KEY NOTES
- USDJPY made it’s pullback down to our trend line.
- Breaks below our SL would result in lower lows.
- Breaks above our KL would result in higher prices and hitting our TP.
Happy trading!
FxPocket

USDJPY Daily Analysis: Slight Bearish Bias Expected Amid !USDJPY Daily Analysis: Slight Bearish Bias Expected Amid Safe-Haven Yen Demand and Softer U.S. Dollar 18/11/2024
Introduction
The USDJPY pair is anticipated to maintain a slight bearish bias today, driven by ongoing demand for the Japanese yen (JPY) as a safe-haven currency and a weaker U.S. dollar (USD) following dovish signals from the Federal Reserve. This article delves into the fundamental factors and technical indicators shaping today’s USDJPY market outlook, offering actionable insights for traders.
---
Key Drivers Influencing USDJPY Today
1. Safe-Haven Demand for the Japanese Yen
The yen continues to benefit from its status as a safe-haven currency amid geopolitical uncertainties and mixed global economic data. Recent concerns surrounding global economic growth and risk aversion have increased demand for JPY, which strengthens its position against the U.S. dollar. As a result, safe-haven flows are contributing to USDJPY’s bearish bias.
2. Weakening U.S. Dollar Amid Dovish Federal Reserve
The U.S. dollar has softened as the Federal Reserve signals a cautious approach to further interest rate hikes. Recent inflation data and moderate employment figures have led to expectations of a prolonged pause in rate adjustments. This dovish tone diminishes the USD’s attractiveness, pressuring USDJPY downward.
3. Bank of Japan’s Stable Policy Approach
The Bank of Japan (BoJ) has maintained a dovish stance but remains consistent in its messaging. The BoJ’s approach, coupled with recent market speculation about potential tweaks in policy should inflation rise sustainably, has supported the yen. This has added to USDJPY’s downward pressure as traders favor the stability and potential yield in the JPY.
4. Technical Indicators Pointing to a Bearish Trend
USDJPY is trading below its 50-day moving average, and momentum indicators such as the RSI (Relative Strength Index) and MACD (Moving Average Convergence Divergence) are showing bearish signals. This alignment of technical factors supports the bearish bias in the pair for today’s trading session.
---
Technical Analysis Indicators
Moving Averages and RSI
USDJPY remains below its 50-day moving average, signaling continued downward momentum. The RSI is trending lower, though it has yet to reach oversold levels, suggesting further potential for declines.
MACD and Volume Analysis
The MACD is showing a bearish crossover, confirming downside momentum. Volume trends also indicate increased selling pressure, aligning with the expectation of a slight bearish bias today.
---
Conclusion
With safe-haven demand for the yen, a dovish Federal Reserve weighing on the U.S. dollar, and bearish technical indicators, USDJPY is expected to maintain a slight bearish bias today. Traders should remain vigilant for unexpected market events or economic data releases that could influence the pair’s trajectory.
---
SEO Tags:
- #USDJPYforecast
- #USDJPYanalysis
- #USDJPYtechnicalanalysis
- #ForexTradingUSDJPY
- #JapaneseYenOutlook
- #USDWeakness
- #USDJPYtoday
- #ForexMarketAnalysis
- #USDJPYprediction

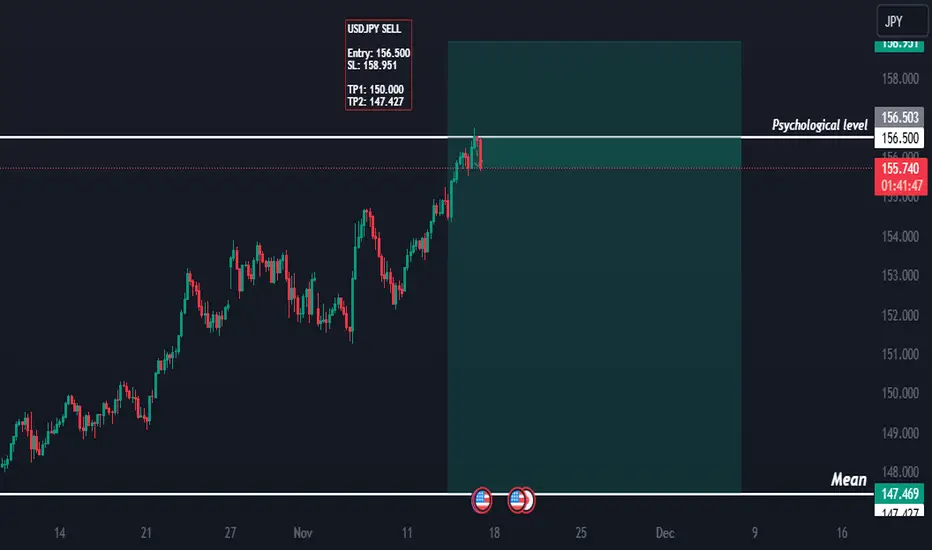
USD/ JPY ! 11/14 ! JPY value will increaseUSDJPY trend forecast November 14, 2024
The Japanese Yen (JPY) remains under selling pressure during the Asian session on Thursday, helping USD/JPY reach the 156.00 level for the first time since July 23, supported by a strong US Dollar (USD). Market sentiment suggests Japan’s political climate may hinder the Bank of Japan (BoJ) from further tightening its policy, which weakens the JPY. Additionally, worries about potential trade tariffs from US President-elect Donald Trump add further pressure on the Yen.
The dollar is benefiting from the new president trump FOMO, but it is cooling down soon.
The Japanese yen also has new moves with the new prime minister, helping the value of the Japanese yen increase further.
/// SELL USD/JPY : zone 156.100 - 156.400
SL: 156.700
TP: 40 - 100 - 200 pips (154.400)
Safe and profitable trading

USDJPY LONGWhen market opens, ill be looking to add more buys on USDJPY from the anywhere in the marked box as soon as entry confirms... Ill take 1st profit @156.179 and second profit @157.301
Total pips = 320pips
The higher TF all agree on buy trend and thta needs to be respected, do your research and lets see if we agree on this move. Fingers crossed

USDJPY - Long active !!Hello traders!
‼️ This is my perspective on USDJPY.
Technical analysis: Here we are in a bullish market structure from 4H timeframe perspective, so I look for a long. I expect bullish price action as we can see a rejection from bullish OB + trendline + level 154.000.
Like, comment and subscribe to be in touch with my content!

USDJPY Daily Analysis: Slight Bearish Bias Expected Amid Fed’sUSDJPY Daily Analysis: Slight Bearish Bias Expected Amid Fed’s Dovish Outlook and Yen’s Safe-Haven Appeal 15/11/2024
Introduction
Today’s outlook for USDJPY leans towards a slight bearish bias, driven by multiple factors that currently favor the Japanese yen (JPY) over the U.S. dollar (USD). With the Federal Reserve's dovish stance, increased safe-haven demand for the yen, and recent technical indicators pointing to downside potential, USDJPY appears set for a potential downward trend. This analysis provides key insights into the main drivers shaping the pair’s movement today, offering valuable information for forex traders.
---
Key Drivers Influencing USDJPY Today
1. Dovish Federal Reserve Reducing USD Appeal
Recent U.S. economic data, including lower-than-expected inflation and moderate job growth, has led to a more cautious outlook from the Federal Reserve. With expectations for rate hikes now muted, the USD faces downward pressure. The dovish stance has weakened the dollar’s appeal, supporting a bearish bias for USDJPY as investors seek alternatives like the yen.
2. Increased Safe-Haven Demand for Japanese Yen
The Japanese yen traditionally serves as a safe-haven currency, attracting investors during times of global uncertainty. With ongoing geopolitical concerns and fluctuating economic conditions in various regions, demand for safe-haven assets like the yen has increased. This factor adds to the downward pressure on USDJPY, as traders shift to more stable options amid market volatility.
3. Stable Policy from Bank of Japan (BoJ) Supporting Yen
While the Bank of Japan has maintained its accommodative policy stance, recent signals suggest that any policy adjustments could be dependent on sustained inflation improvements. This stability in BoJ’s approach has reinforced confidence in the yen, contributing to its strength against a softer dollar. The BoJ’s consistent position gives the JPY added support, favoring a bearish bias for USDJPY.
4. Technical Indicators Showing Bearish Momentum
From a technical perspective, USDJPY is currently trading below key resistance levels and the 50-day moving average, both of which point to a bearish trend. Indicators like the RSI (Relative Strength Index) and MACD (Moving Average Convergence Divergence) show bearish signals, suggesting potential for further downside in the pair.
---
Technical Analysis Indicators Supporting a Bearish Outlook
Moving Averages and RSI
USDJPY remains below its 50-day moving average, indicating continued downward pressure. The RSI is trending lower without reaching oversold territory, which implies room for additional declines without a correction.
MACD and Volume Trends
The MACD has shown a bearish crossover, supporting expectations for a bearish trend. Volume analysis also reflects a steady increase in selling interest, further aligning with today’s bearish bias for USDJPY.
---
Conclusion
With the Fed’s dovish outlook, rising safe-haven demand for the yen, and supportive technical indicators, USDJPY is expected to maintain a slight bearish bias today. Traders should stay vigilant to any changes in risk sentiment or key economic data releases, as these factors could impact the pair’s movement.
---
SEO Tags:
- #USDJPYforecast
- #USDJPYanalysis
- #USDJPYtechnicalanalysis
- #ForexTradingUSDJPY
- #JapaneseYenOutlook
- #USDJPYtoday
- #USDWeakness
- #ForexMarketAnalysis
- #USDJPYprediction
USDJPY LONG IDEAExecute the price at the exact price mentioned, NO FOMO.
💡KEEP IN MIND💡
I am not a financial advisor and do not contribute to any of your losses or profits. To be safe, I recommend that you risk only 0.1 - 0.2% for the first week or 10 days, as no one can predict the market.
🚀Follow, I will drop daily 2-5 Intraday Charts🚀

USDJPY - INTRADAY IDEAExecute the price at the exact price mentioned, NO FOMO.
💡KEEP IN MIND💡
I am not a financial advisor and do not contribute to any of your losses or profits. To be safe, I recommend that you risk only 0.1 - 0.2% for the first week or 10 days, as no one can predict the market.
🚀Follow, I will drop daily 2-5 Intraday Charts🚀

USDJPY Daily Analysis: Slight Bearish Bias Expected Amid Dovish USDJPY Daily Analysis: Slight Bearish Bias Expected Amid Dovish Fed and Safe-Haven Demand for Yen 14/11/2024
Introduction
Today’s outlook for USDJPY suggests a slight bearish bias, driven by key factors favoring the Japanese yen (JPY) over the U.S. dollar (USD). A cautious stance from the Federal Reserve, global uncertainty driving safe-haven demand for the yen, and stable policy signals from the Bank of Japan are all putting downward pressure on USDJPY. This article provides an in-depth look at the fundamental drivers shaping the USDJPY trend today, offering valuable insights for traders.
---
Key Drivers Influencing USDJPY Today
1. Dovish Federal Reserve and Softening U.S. Dollar
Recent U.S. economic data, including moderate inflation figures and stable but unspectacular labor market performance, have led the Federal Reserve to signal a possible hold on further rate hikes. This dovish shift is weakening the U.S. dollar, as traders expect the Fed to be cautious in adjusting rates in the near term. A softer dollar environment supports a bearish trend for USDJPY, as it reduces USD appeal against other currencies.
2. Increased Safe-Haven Demand Boosting Yen
The Japanese yen is traditionally regarded as a safe-haven currency, attracting investors during times of global economic uncertainty. With ongoing concerns in some international markets, demand for the yen has increased as investors look for stability. This shift in risk sentiment supports a bearish USDJPY outlook, as the yen’s appeal as a secure asset rises.
3. Bank of Japan’s (BoJ) Policy Stability
While the Bank of Japan (BoJ) has largely maintained its dovish policy approach, recent signals suggest it may adjust if inflation shows sustainable improvement. Even the slight possibility of a shift has bolstered confidence in the yen. By holding steady and keeping an eye on inflation targets, the BoJ has supported the JPY’s position, which creates additional downward pressure on USDJPY.
4. Technical Indicators Pointing to a Bearish Trend
USDJPY is approaching resistance levels that have proven challenging in previous sessions, and the pair is trading below its 50-day moving average, which typically signals a downtrend. Key indicators like the RSI (Relative Strength Index) and MACD (Moving Average Convergence Divergence) are also showing bearish signals, supporting the expectation of a slight bearish bias today.
---
Technical Analysis Indicators Supporting a Bearish Outlook
Moving Averages and RSI
USDJPY is currently trading below its 50-day moving average, indicating that downward momentum is intact. The RSI is trending lower but not yet oversold, which implies that there is room for further downside movement.
MACD and Volume Analysis
The MACD has produced a bearish crossover, a sign of potential downward continuation. Volume analysis also indicates growing selling interest, aligning with today’s bearish bias for USDJPY.
---
Conclusion
With a dovish Fed reducing the USD’s appeal, safe-haven demand for the yen, and technical indicators signaling downside potential, USDJPY is expected to maintain a slight bearish bias today. Traders should monitor key economic developments and risk sentiment indicators to gauge further market direction.
---
SEO Tags:
- #USDJPYforecast
- #USDJPYanalysis
- #USDJPYtechnicalanalysis
- #ForexTradingUSDJPY
- #JapaneseYenOutlook
- #USDJPYtoday
- #USDWeakness
- #ForexMarketAnalysis
- #USDJPYprediction

USDJPY Daily Analysis: Slight Bearish Bias Expected Amid Dollar USDJPY Daily Analysis: Slight Bearish Bias Expected Amid Dollar Weakness and Yen Strength 13/11/2024
Introduction
The outlook for USDJPY today points toward a slight bearish bias, driven by factors that favor the Japanese yen (JPY) over the U.S. dollar (USD). As recent U.S. economic data moderates expectations for further Federal Reserve rate hikes, and with the yen drawing safe-haven interest, USDJPY could experience downward pressure. This article provides a brief analysis of key drivers influencing USDJPY, offering valuable insights for forex traders.
---
Key Drivers Influencing USDJPY Today
1. Weaker U.S. Dollar Amid Dovish Federal Reserve Outlook
Recent U.S. economic data, including softer inflation readings and mixed labor market performance, has dampened expectations for additional Federal Reserve rate hikes. With inflation pressures appearing to ease, the Fed may adopt a more cautious approach, reducing the appeal of the USD. A softer dollar generally favors a bearish USDJPY trend, especially as the yen gains safe-haven demand.
2. Potential Yen Strength from Safe-Haven Demand
The Japanese yen traditionally serves as a safe-haven currency, attracting demand during periods of global uncertainty. With mixed economic outlooks in major global markets, investor risk aversion has increased, contributing to yen demand. This rise in safe-haven sentiment provides bearish momentum for USDJPY, especially as traders shift toward lower-risk assets.
3. Bank of Japan’s Stable Policy Adds Support for Yen
While the Bank of Japan (BoJ) has maintained its dovish monetary stance, recent statements suggest it could adjust its policies if inflation shows sustained improvement. The prospect of a potential policy shift boosts confidence in the yen, supporting a slight bearish trend in USDJPY. The yen’s stability underpins its appeal as an alternative to a softer dollar in today’s market conditions.
4. Technical Indicators Signaling Downward Momentum
Technically, USDJPY is approaching resistance levels that have previously capped upward movements. The pair is trading below its 50-day moving average, which often signals a bearish trend. Both the RSI (Relative Strength Index) and MACD (Moving Average Convergence Divergence) show signs of downward pressure, further supporting the bearish bias in USDJPY today.
---
Technical Analysis Indicators Supporting a Bearish Outlook
Moving Averages and RSI
USDJPY remains below its 50-day moving average, a key bearish indicator that suggests continued downward movement. The RSI is trending lower, indicating building selling pressure without reaching oversold conditions, reinforcing a bearish bias.
MACD and Volume Trends
The MACD is showing a bearish crossover, supporting expectations for further declines. Volume trends reflect an increase in selling activity, aligning with today’s slight bearish outlook for USDJPY.
---
Conclusion
With U.S. dollar softness, safe-haven demand for the yen, and technical indicators favoring downside potential, USDJPY is expected to maintain a slight bearish bias today. Traders should watch for any significant changes in global risk sentiment and U.S. economic data that could impact the pair’s direction.
---
SEO Tags:
- #USDJPYforecast
- #USDJPYanalysis
- #USDJPYtechnicalanalysis
- #ForexTradingUSDJPY
- #JapaneseYenOutlook
- #USDJPYtoday
- #USDWeakness
- #ForexMarketAnalysis
- #USDJPYprediction
