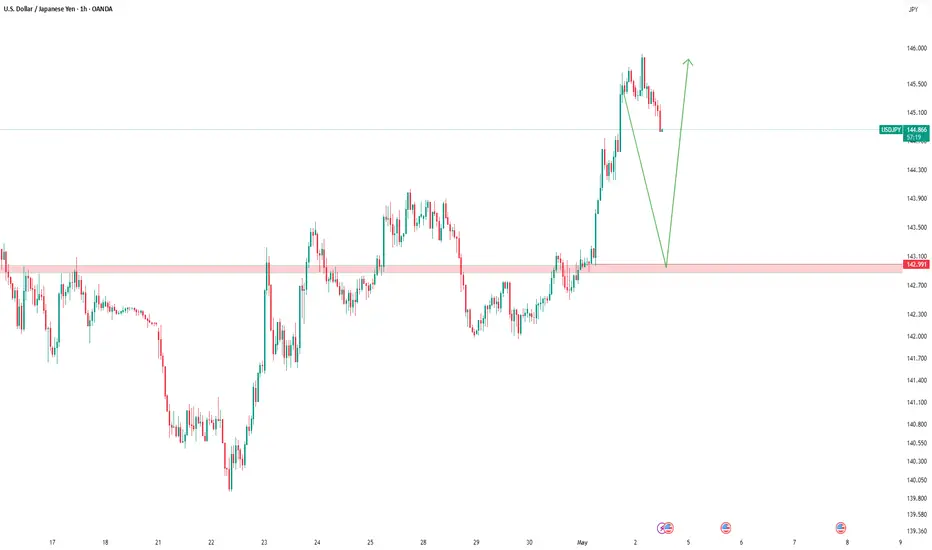
USDJPY .. LONGOANDA:USDJPY
Price is nearing a critical level around .
No setup, no trade. For me, a solid plan always comes before any prediction.
****If the zone is broken and confirmed with a retest, I’ll adjust my plan accordingly for a possible reverse trade.
Usdjpyanalysis
Yen rally ends, markets eyes Fed rate decision and BoJ minutesCurrently, the market sentiment is rather complex. On the one hand, some traders are betting on the restart of negotiations by the US side, believing that policy uncertainty will be alleviated with the convening of the meeting. On the other hand, from the perspective of the capital market, the market's concern about the medium - to - long - term depreciation trend of the US dollar is increasing. In particular, the " $2.5 trillion capital withdrawal" view proposed by the Eurizon SLJ report, if realized, will substantially suppress the US dollar.
In the short term, if the USD/JPY exchange rate fails to hold above the 145.5 level, the rebound may come to an end, and the price may test the two key support levels of 143.00 and 141.650. Especially if the Fed's policy language continues to be dovish, the exchange rate may decline further.
you are currently struggling with losses, or are unsure which of the numerous trading strategies to follow, at this moment, you can choose to observe the operations within our channel.

USD/JPY) Bullish trand analysis Read The ChaptianSMC Trading point update
Technical analysis of USD/JPY on the 2-hour timeframe, and it presents a bullish continuation setup. Here's a breakdown of the key elements and the idea behind the analysis:
---
1. Ascending Channel Formation
The price is trading within an ascending channel, suggesting a controlled uptrend.
Higher highs and higher lows confirm the trend structure.
2. Key Support and Fair Value Gap (FVG)
There’s a well-identified support level where price has bounced before (highlighted in yellow).
A Fair Value Gap (FVG) zone is marked slightly above the support level, which could act as a short-term demand area.
Price is currently pulling back into this zone, potentially setting up a buying opportunity.
3. EMA 200 Support
The 200 EMA (~143.78) is acting as dynamic support just below the current price.
If price drops further, this level may offer strong technical support.
4. RSI Momentum
RSI is above 50 (currently 56.37), supporting the bullish trend and showing room for continued upside.
5. Target Point
The chart anticipates a bounce off the support/FVG zone and a rally toward the upper boundary of the channel, targeting 147.153.
Mr SMC Trading point
---
Summary of the Idea:
This is a bullish continuation setup within an uptrend channel. The analyst expects a potential long entry around the FVG/support zone, with a target at the channel top (147.15). Confluence from the EMA 200, RSI, and previous structure supports this bullish bias.
Pales support boost 🚀 analysis follow)

Analysis of the Latest SignalsRecently, the situation in Ukraine and Russia has remained tense, and the conflict in the Middle East has escalated (such as the confrontation between Israel and the Houthi armed forces in Yemen), prompting funds to flow to traditional safe - haven currencies. However, the Bank of Japan (BoJ) maintained a dovish stance last week and did not clarify the interest - rate - hike path, which limited the upside potential of the yen.
Although inflation in Japan persists and wage growth is strong (the largest increase in 34 years), the BoJ's cautious attitude towards economic recovery has led the market to lower the interest - rate - hike expectations for June and July, putting pressure on the yen.
you are currently struggling with losses, or are unsure which of the numerous trading strategies to follow, at this moment, you can choose to observe the operations within our channel.

USDJPY Retest of Supply Zone Before Bearish ContinuationUSDJPY pair is reacting to key supply around 143.70–144.00 but shows signs of weakness after failing to hold above this level. With renewed risk-off sentiment and escalating global trade tensions—especially involving Japan and the U.S.—this pair may be setting up for a bearish continuation. Here's what both the chart and macro backdrop suggest.
📊 Technical Breakdown (4H Chart)
Key Supply Zone Retested:
The pair retraced into a previously broken structure zone (blue box), rejecting the 143.70–144.00 area multiple times.
Price is now forming lower highs, indicating bearish pressure building beneath resistance.
Bearish Continuation Pattern:
Price action resembles a bear flag, with a minor pullback likely before continuation lower.
A retest of 143.00–143.50 could serve as an ideal sell zone.
Major Support Levels:
142.04–142.02: Immediate support, already tested.
140.16: Key structure low from late April.
138.04: Final measured move target based on Fibonacci extension and prior demand zone.
Bearish Trade Setup:
Entry Zone: 143.00–143.50
Stop: Above 145.35
TP1: 142.00
TP2: 140.15
TP3: 138.00
🌐 Macro Fundamentals
Trump Tariffs Stir Instability:
President Trump is pressing Japan in trade talks with threats of new tariffs, already impacting investor confidence
A 25% tariff on Japanese auto exports has gone into effect, disrupting trade negotiations.
Urgency for a Deal, But No Progress Yet:
Trump says multiple deals are “coming,” but little substance has emerged. Analysts fear economic fallout and potential global recession if tensions continue
JPY Strengthening on Safe-Haven Flows:
With U.S. economic indicators weakening and global uncertainty rising, the yen may benefit from risk aversion.
✅ Summary
USDJPY remains vulnerable to downside continuation from the 143–144 resistance zone. If price breaks below 142.00 again with conviction, expect momentum to build toward 140.15 and potentially 138.00.

Bullish Breakout from Falling WedgeThe exchange rate of the US dollar against the Japanese yen shows a slight downward trend. The opening rate of the US dollar against the Japanese yen on that day was 144.8740. During the trading session, it hit a high of 144.9890 and a low of 144.085. The latest trading price is 144.082, which is 0.60% lower than the closing price of 144.9180 in the New York foreign exchange market on the previous trading day.
Buffett has warned of the risks of the US dollar, and funds may flow to safe - haven assets such as the Japanese yen, which may have had a certain impact on the exchange rate of the US dollar against the Japanese yen. On the other hand, from a technical perspective, according to the chart data, the "Daily Chart PP" of the US dollar / Japanese yen shows that its pivot point is at 158.27, and the maximum coverage range of the corresponding support and resistance is 157.29 - 159.33. The current exchange rate is at a relatively low level and may be attracted by the lower support level.
you are currently struggling with losses, or are unsure which of the numerous trading strategies to follow, at this moment, you can choose to observe the operations within our channel.

USD/JPY "The Gopher" Forex Bank Heist Plan (Swing/Day)🌟Hi! Hola! Ola! Bonjour! Hallo! Marhaba!🌟
Dear Money Makers & Robbers, 🤑💰✈️
Based on 🔥Thief Trading style technical and fundamental analysis🔥, here is our master plan to heist the USD/JPY "The Gopher" Forex Market. Please adhere to the strategy I've outlined in the chart, which emphasizes short entry. Our aim is the Green Zone. Risky level, oversold market, consolidation, trend reversal, trap at the level where traders and bullish robbers are stronger. 🏆💸"Take profit and treat yourself, traders. You deserve it!💪🏆🎉
Entry 📈 : "The vault is wide open! Swipe the Bearish loot at any price - the heist is on!
however I advise to Place sell limit orders within a 15 or 30 minute timeframe most nearest or swing, low or high level for Pullback Entries.
Stop Loss 🛑:
📌Thief SL placed at the nearest/swing High or Low level Using the 1D timeframe (148.800) Day/Scalping trade basis.
📌SL is based on your risk of the trade, lot size and how many multiple orders you have to take.
Target 🎯: 140.000 (or) Escape Before the Target
💰💵💸USD/JPY "The Gopher" Forex Market Heist Plan (Swing/Day Trade) is currently experiencing a Bearish trend.., driven by several key factors.👇👇👇
📰🗞️Get & Read the Fundamental, Macro, COT Report, Quantitative Analysis, Sentimental Outlook, Intermarket Analysis, Future trend targets... go ahead to check 👉👉👉🔗🔗
Detailed Explanation Recap ✨
Fundamentals: Policy divergence + trade risks ⚖️ favor JPY 💪.
Macro: US slowdown 📉 + Japan resilience 🌱 lift JPY.
Global Markets: Risk-off flows 🛡️ + yield dynamics 📜 boost JPY.
COT: Speculative unwinding 📉 aligns with bearish pressure.
Seasonality: Mild JPY edge in April 🌸.
Intermarket: USD weakness 💸 across assets aids JPY.
Quantitative: Technicals confirm bearish 📉.
Sentiment: Broad bearish tilt 😟, retail as contrarian 🚨.
Trend Prediction: Downward bias 📉 across timeframes.
Outlook: Strong bearish case 🐻 with clear targets.
⚠️Trading Alert : News Releases and Position Management 📰 🗞️ 🚫🚏
As a reminder, news releases can have a significant impact on market prices and volatility. To minimize potential losses and protect your running positions,
we recommend the following:
Avoid taking new trades during news releases
Use trailing stop-loss orders to protect your running positions and lock in profits
💖Supporting our robbery plan 💥Hit the Boost Button💥 will enable us to effortlessly make and steal money 💰💵. Boost the strength of our robbery team. Every day in this market make money with ease by using the Thief Trading Style.🏆💪🤝❤️🎉🚀
I'll see you soon with another heist plan, so stay tuned 🤑🐱👤🤗🤩

USD/JPY) bullish trend analysis Read The ChaptianSMC Trading point update
Technical analysis of USD/JPY chart shows a bullish reversal setup. Here’s a breakdown behind the analysis:
1. Downtrend & Channel Breakout:
Price was trending downward within a descending channel (marked “channel trend”).
Recently, the price broke out of the channel, signaling a potential trend reversal.
2. Demand Zone (Diamond Zone):
The yellow box labeled “Diamond Zone” represents a demand/support zone where price previously found buyers.
A retest of this zone is expected before the bullish move.
3. EMA (200):
The EMA (200) is currently above the price but close. A break above this level (142.522) could add to bullish momentum.
4. RSI Indicator:
RSI is showing a bounce off a mid-level (~50), suggesting bullish momentum is gaining.
5. Target Level:
The analysis targets 147.838, which aligns with a prior resistance zone.
The move projects a 5.19% gain (~778.5 pips) from the current setup.
Trading Idea Summary:
Entry: Around the “Diamond Zone” after a successful retest.
Confirmation: Watch for bullish candlestick patterns or a break above EMA 200.
Target: 147.838
Stop Loss (implied): Below the Diamond Zone (~140.000)
Pales support boost 🚀 analysis follow)

USDJPY Long PositionUSDJPY pair is currently positioned at a key support zone, where price action has historically reversed direction. Following a recent rebound from this level, the pair retested the support area. Given the broader uptrend structure (characterized by higher highs and higher lows), this retest presents a potential opportunity to enter long positions, contingent on bullish confirmation at this critical juncture.
Key Observations:
Established Uptrend: The pair’s consistent upward trajectory on higher time frames supports a bullish bias.
Support Retest: The current pullback to the support zone aligns with typical price behavior in trending markets, where retests of prior levels often precede trend resumptions, but a decisive close below the support would invalidate the bullish setup, potentially signaling a trend reversal or deeper correction.
Risk Management Strategy: A prudent approach would involve placing a stop-loss below the support zone to protect against a breakdown, while targeting the next resistance level for profit-taking.
Final Assessment:
The setup aligns with bullish momentum, provided the support holds.

USDJPY WILL FLY TO 161 !!HELLO TRADES
As you can see a harmonic pattren on Daily Chart for this pair udsjpy we have a great oppritunity to join the Us Dollar Rally we can see a horizontal Support was tested and and its moving to given Targets chart is simple and easy to ready make a proper research before taking any trade these are only dail based valid targets if not break given Stop loss We need ur Supports and comments Stay Tuned for more update ...

USD/JPY Eyes Breakout After Healthy Wave 4 CorrectionThe USD/JPY pair is currently unfolding a clean impulsive 5-wave structure to the upside. The price action has already completed Waves 1, 2, and 3, and has entered a probable Wave 4 correction.
Wave 3 appears extended and tapped into a key Fair Value Gap (FVG), which acted as resistance.
Wave 4 is likely to develop as a shallow retracement, possibly forming a bull flag or expanded flat before launching into Wave 5.
The ascending channel supports the bullish structure with both Wave 2 and Wave 4 respecting lower bounds.
Targets: 144.750 - 144.351
Stoploss: 146.268

DeGRAM | USDJPY Keeps the Demand Zone📊 Technical Analysis
● USD/JPY has broken the falling-wedge top and is holding above the 142.20 breakout line; that keeps 144.03 → 147.5 in scope.
💡 Fundamental Analysis
● U.S. March retail sales surged 1.4 %, underscoring resilient demand.
✨ Summary
A wedge breakout plus firm U.S. data, a hawkish Fed and a dovish BOJ favour more dollar strength; holding above 142.20 keeps USD/JPY on track for $144.03–147.5.
-------------------
Share your opinion in the comments and support the idea with like. Thanks for your support!

Technicals USDJPY Key Level (Horizontal Resistance)
A horizontal resistance zone around 143.90 has been tested multiple times.
Price is currently retesting this zone, marked as an "Entry Zone", suggesting a potential breakout or rejection.
2. Price Structure
Prior downtrend bottomed near 140.00, then formed higher lows, showing a potential trend reversal.
Current price is approaching the resistance with strong bullish candles, indicating possible momentum buildup.
3. Volume
Volume spikes align with swing highs and lows, suggesting these moves were backed by stronger participation.
4. Scenarios Outlined
Bullish Path (Black Arrow): Breakout above the entry zone could lead to targets near 147.00–150.00, continuing a bullish reversal.
Bearish Path (Red Wave): Rejection at the resistance may cause a drop toward 140.00, forming a ranging or distribution pattern.
The Fed (USD) maintains relatively high interest rates, while the BoJ (JPY) continues a dovish stance, creating upward pressure on USD/JPY.

USD/JPYThe Japanese Yen (JPY) oscillates in a narrow trading band at the start of a new week and remains close to a two-week trough touched against its American counterpart on Friday. Mixed signals from the US and China temper hopes for a quick resolution of the trade conflict between the world's two largest economies, which, in turn, offers support to the safe-haven JPY. Moreover, expectations that Japan will strike a trade deal with the US turn out to be another factor underpinning the JPY.
Meanwhile, investors have been scaling back their bets for an immediate interest rate hike by the Bank of Japan (BoJ) as rising economic risks from US tariffs overshadow signs of broadening inflation in Japan. This holds back the JPY bulls from placing aggressive bets, which, along with a modest US Dollar (USD) uptick, acts as a tailwind for the USD/JPY pair. However, the divergent BoJ-Federal Reserve (Fed) policy expectations should cap the USD and benefit the lower-yielding JPY.

USD/JPY 1H Chart AnalysisStructure: Bullish, with higher highs (H1) and higher lows consistently forming.
Key Zone: A demand zone around 143.00 – 143.20. Price could pull back here for liquidity before continuing higher.
Current Price: Consolidating near 143.70 after a strong impulse.
Bias: Bullish, as long as price holds above 143.00. Watching for a possible dip into demand before resuming the uptrend toward 144.20 highs.

USD/JPY Bullish Breakout Setup: Key Resistance at 144.939 and TaEntry Point: ~144.037
Stop Loss: ~144.939 (above the recent resistance zone)
Resistance Zone: Between 144.037 and 144.939 (highlighted by purple area)
First Target Point (EA Target Point): ~139.731 (Bearish target if reversal happens)
Second Target Point (Bullish EA Target Point): ~148.737
Current Price:
As of the chart, price is around 143.743, slightly below the entry point.
Possible Scenarios:
Bullish Breakout:
If price breaks and closes above 144.939, expect strong bullish momentum toward 148.737.
Confirmation: Look for strong bullish candles with volume above the resistance zone.
Bearish Rejection:
If price fails to break 144.939 and shows bearish reversal patterns (e.g., bearish engulfing), a pullback toward 144.037 or even down to 139.731 is likely.
Additional Notes:
The orange circles highlight key points where price respected trendlines and support zones — showing strong buyer interest.
A rising trendline (drawn underneath recent lows) supports the ongoing bullish structure.
Risk-Reward seems well balanced: small risk (~90 pips) for a potential reward (~400+ pips).
Summary:
Bias: Cautiously bullish, but watch carefully around the 144.939 resistance.
Action: Wait for a clean breakout or a rejection pattern before deciding.

USDJPY BULLISHMy deeply studied quantitative analysis indicates that price bears an overall bullish sentiment and that it will get to 150.150

USDJP WEEKLY UPDATESHello folks, if you're following
this idea since, then the higher chances are, you win the trade on my short idea before.
Now I'm expecting lows again, This idea is on weekly gap to be filled.
Chart are on 4HTF. this idea are on weekly.
It might retrace, but the weekly timeframe still on bearish.+
This is not a financial advice, follow for more.

USDJPY – Searching for a Bottom After a Brutal DropSince the start of the year, USDJPY has been in an almost free fall, losing nearly 2,000 pips and breaking multiple key supports, including the critical 150 level.
Yesterday, we even saw a spike below 140, a level not touched for quite some time.
🔄 However, after that spike, the pair reversed sharply to the upside, showing strong demand in that area.
Interestingly, this zone was tested at the start of 2024 and again back in September, adding even more technical relevance.
📊 Despite the poor outlook for the USD overall, I now expect a meaningful rebound from here, aiming for a retest of the former 146 support, which has now turned into resistance.
💡 Trading Plan:
I will be looking to buy dips near the current support, targeting a 1:3 Risk/Reward setup toward the 146 resistance area.
Disclosure: I am part of Trade Nation's Influencer program and receive a monthly fee for using their TradingView charts in my analyses and educational articles.

#USDJPY: 2050+ Pips Swing Buy| Trend Confirmed| Comment Views? **FX:USDJPY** A significant market movement has confirmed, indicating the potential for a substantial bullish swing that could reach approximately 2050 pips. Three targets have been identified, allowing you to select the one that aligns best with your analysis. The primary catalyst for this move is the reversal of the Japanese Yen (JPY) to a bearish trend. It is crucial to employ precise risk management techniques and exercise caution during this period.
Good luck and trade safely.
Thanks for your support! 😊
If you want to help us out, here are a few things you can do:
- Like our ideas
- Comment on our ideas
- Share our ideas
Team Setupsfx_
❤️

USDJPY Short Term Buy Trading Plan Update!!!Hi Traders, on April 23rd I shared this idea "USDJPY Short Term Buy Trading Plan"
I expected bullish continuation higher from the marked Fibonacci support zones. You can read the full post using the link above.
Price reached the first Fibonacci support zone, respected it and bounced higher as expected!!!
If you enjoy this idea, don’t forget to LIKE 👍, FOLLOW ✅, SHARE 🙌, and COMMENT ✍! Drop your thoughts and charts below to keep the discussion going. Your support helps keep this content free and reach more people! 🚀
-------------------------------------------------------------------------------------------------------------------
Disclosure: I am part of Trade Nation's Influencer program and receive a monthly fee for using their TradingView charts in my analysis.

USDJPY Short Term Buy Trading PlanM15 - Strong bullish momentum followed by a pullback
No opposite signs
Expecting bullish continuation until the two Fibonacci support zones hold.
If you enjoy this idea, don’t forget to LIKE 👍, FOLLOW ✅, SHARE 🙌, and COMMENT ✍! Drop your thoughts and charts below to keep the discussion going. Your support helps keep this content free and reach more people! 🚀
--------------------------------------------------------------------------------------------------------------------
Disclosure: I am part of Trade Nation's Influencer program and receive a monthly fee for using their TradingView charts in my analysis.

Market Analysis: USD/JPY Eyes Fresh IncreaseMarket Analysis: USD/JPY Eyes Fresh Increase
USD/JPY is rising and might gain pace above the 142.45 resistance.
Important Takeaways for USD/JPY Analysis Today
- USD/JPY climbed higher above the 141.00 and 141.65 levels.
- There was a break above a connecting bearish trend line with resistance at 141.20 on the hourly chart at FXOpen.
USD/JPY Technical Analysis
On the hourly chart of USD/JPY at FXOpen, the pair started a fresh upward move from the 140.00 zone. The US Dollar gained bullish momentum above 141.65 against the Japanese Yen.
There was a break above a connecting bearish trend line with resistance at 141.20. It even cleared the 50-hour simple moving average and 142.45. The pair climbed above 143.00 and traded as high as 143.21 before there was a downside correction.
The pair dipped below the 23.6% Fib retracement level of the upward move from the 139.88 swing low to the 143.21 high. The current price action above the 141.65 level is positive.
Immediate resistance on the USD/JPY chart is near 142.45. The first major resistance is near 143.20. If there is a close above the 143.20 level and the RSI moves above 75, the pair could rise toward 144.50.
The next major resistance is near 145.00, above which the pair could test 148.00 in the coming days. On the downside, the first major support is 141.65 and the 50% Fib retracement level of the upward move from the 139.88 swing low to the 143.21 high.
The next major support is visible near the 141.00 level. If there is a close below 141.00, the pair could decline steadily. In the stated case, the pair might drop toward the 139.90 support zone. The next stop for the bears may perhaps be near the 137.50 region.
This article represents the opinion of the Companies operating under the FXOpen brand only. It is not to be construed as an offer, solicitation, or recommendation with respect to products and services provided by the Companies operating under the FXOpen brand, nor is it to be considered financial advice.
