USDJPY SHORTS 📉📉📉📉 Expecting bearish price action on UJ as price takes out the buy side liquidity on the M30 and right now it's making the bearish reversal move, price made a lot of bullish imbalances that has to be filled those imbalances should act as a magnet for the price 123.000 is my target where bullish ordeblock and imbalance will be mitigated. JPYBASKET is also very strong and i expect it to rise meaning XXX JPY pairs should go down.
What do you think ? Comment below..
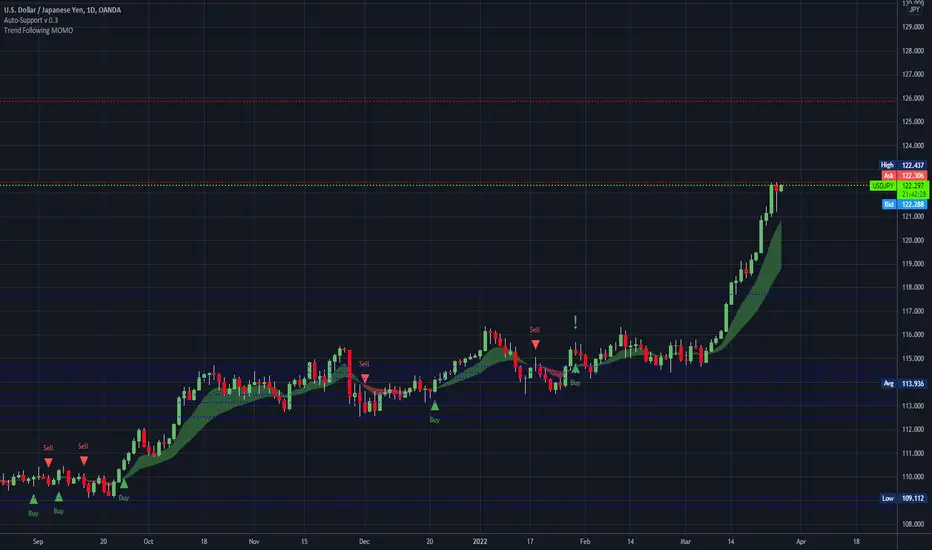
Usdjpybuy

USDJPY let’s see what happens with this Clear BOS on lower timeframe, overall trend is bullish. NY session taking place pushing price further.

USDJPY LONGS ACTIVE 📉📉📉📉 Expecting bullish price action on USDJPY as we are in a bullish market strucutre from a HTF premise W1/D1. For a H1 long entry i will wait for the price to make a retracement back into 121.730 bullish orderbloc area on the h4 filling on it's way the bullish imbalances aka price inefficiencies. We have a bullish BOS on the H1 that confirms the shift in the strucutre from bearish to bullish
The retail heard is SHORT on this pair and this could add another confluence to go LONG - contrarian approach.
What do you think ? Where we go next ?


USD/JPYThe USD/JPY made a third consecutive unusually strong weekly rise last week, closing near its high at its highest closing price seen in over 6 years. In fact, last week’s move was the strongest seen in several years. These are very bullish signs, with the Japanese Yen showing the greatest weakness of all major currencies putting this pair in focus right now. I made a good call last week seeing this pair as a buy.
Despite all these bullish signs, there is a reason for bulls to be cautious here: the price has hit an inflection point at 122.32 which has so far held as resistance. Friday also saw a strong drop of more than a day’s average true range (ATR) based upon recent volatility, and this can be a sign that a bullish move has run its course, at least for a while. However, the price did recover over the rest of the day to close above 122.00.
I think short JPY remains attractive as a long trade, but traders need to be careful with stop losses and make sure they are kept quite tight, as the price may now need to consolidate for a while before resuming its rise.
USDJPY Long1D
- price is in strong uptrend
1H
- price is in uptrend and above support line
-the price needs to retrace back to demand zone which is also 0.6 - 0.7 of fibonacci retracement
- signal = Buy

USDJPY SHORT IDEA Overall still very bearish on USDJPY.
We are currently in a very strong area of supply. Due to the Japanese bank holiday today and Powell's speech we have seen a bullish push.
Our bias remains intact, technicals suggest that the shorts are still in play.
Looking forward to see how this plays out in a day or two
Disclaimer:
These charts should only be used for educational purposes and not as signals. Trading entails high risk !
God bless,
ETGL TEAM 💛

USDJPY opens the week on a bullish USD/JPY opens the week on a bullish note, extends gains above 119 handle
USD/JPY poised for further gains, break above 120 levels likely

USDJPY On 4 Hour Timeframe Is A Bullish Trend.FX:USDJPY OANDA:USDJPY FOREXCOM:USDJPY FOREXCOM:USDJPY CAPITALCOM:USDJPY SAXO:USDJPY
USDJPY On 4 Hour Timeframe Is A Bullish Trend.
Support And Resistance Levels On The USD/JPY: 117.500 Support, 120.000 Resistance.
If USDJPY Exceeds 119.124, The Price Expected To Continue In The Uptrend Movement (Confirmation Level).
If USDJPY Exceeds 115.796, The Price Expected To Continue To Fall (Invalid level).
If USDJPY Reached 120.000 Level, The Price Expected To Rebound Downward (Resistance Area)

USDJPY SHORT/SELL IDEAHello Traders,
Hope you are having an amazing week.
Above is my analysis on USDJPY, overall perspective is very BEARISH.
One thing to keep in mind this week before taking a trade is the fundamental outlook on both the USD & Yen Pairs.
Nevertheless, our perspective is still bearish given that we are currently in a key area of supply.
Looking forward to see how this plays out.
Thank you for your support,
ETGL TEAM 💛

USD/JPYThe USD/JPY made an unusually strong weekly rise last week, closing right on its high at its highest closing price seen in over 5 years. These are very bullish signs, with the US Dollar making a strong bullish breakout and the Japanese Yen showing the greatest weakness of all major currencies putting this pair in focus right now.
I see this currency pair as a buy and as likely to see still higher prices over the coming week as it trades in blue sky.

USDJPY SHORTS 📉📉📉📉 Expecting bearish price action on UJ as price is rejecting an important area of bearish orderblock h4 and it should go lower from there, we also have a bearish orderblock on H1 right in that area + bearish imbalances that were filled.
Targets into 115.000, What do you think ? Comment below..

USDJPYAfter the Great Fall USDJPY Started Recovering and Gradually Started Pumping Upwards . I See More Buys Towards Marked Level On Chart To Over Take OLD HIGHS to Seek Buy Side Liquidity For Selling !
If I m on right page Long Runs will be towards OLD HIGHS

USDJPYUSDJPY would do correction downwards for may be 2 or 3 days and then we will se a big Bullish Movement in this pair.

USDJPY / LONGMy current bias for USDJPY / Waiting for price to get into my area before looking for a long opportunity

USD/JPY 4HR BUY SET UPHi TRADERS this is my trade set up for the USD/JPY for the new week ahead
USD/JPY I am expecting a pullback to the order block zone, this pair is still looking bullish to me overall, so will looking for buy trade only
This is my analysis only please trade with caution and risk management in place
good luck for this weeks trading
please like comment and follow

Choppy USDJPY to test the top of the channel.The price for USDJPY is consolidating at the bottom of the channel looking for another run to break the top of the channel. The bottom may be in but do not be surprised to see another fake out to the bottom. If you are already in the long, and in profit, you can take some profits off the table once price tests 116.5. Otherwise, I think we can wait for a better buy entry when price hits the oversold region of the 4hr RSI.

More downside for the USDJPY but capped in a range.It looks like there is more downside to come for the DXY though the move will likely be capped in a range. This downward move can get some support at around the 114.6 or 114.2 levels before it hits the bottom of the range. What the price chooses to do at those levels will be largely dependent on what the central banks do. Is the federal reserve going to turn more hawkish than they already are? Or are they going to stick to the original plan?

USDJPY UP Trend.!#USDJPY Looking for Buy trade setup as I mentioned in the Chart.!
Keep Supporting LIKE, COMMENT And FOLLOW.!
Thank You.!

USDJPYHello traders. Due to the negative divergence and the formation of the last ceiling, which is lower than the last ceiling, I expect the price to decrease with two targets. If you agree with me, do not forget to like.

Hawkish fed, lagging BOJ. Bullish for USDJPYThe wave 5 is incoming for the USDJPY. A hawkish fed plus a lagging BOJ is the perfect formulae for this to happen. This correction is great for a buy and we ride the wave 5 impulse to 120.

USDJPY LONG/SHORTUSDJPY is currently at a very crucial level.
It is facing a rejection from the previous resistance zone.
For LONG :- One can enter it once it closes above 116.5 in Daily TF for target of 118+.
For SHORT :- One can enter around 115.5 with a SL of 116.5 for target of 113 (SAFE TARGET).
Trade safe. Manage risk. Be profitable.
Please follow us for more simple trading analysis and setups. Also let me know in the comment in case you have any queries.
Disclaimer :- This is just my view. Please analyze charts yourself and then decide to take any trades.

USDJPY: Breakout Trap ⚠️Have buyers been lured in with a clean breakout creating support? It is a possibility.
If this is the case, I would like to see some sells from this region.
The ideal entry would be on the pullback after the BOS but aggressive traders could consider this region.
For this sell to work, price cannot pass the high marked or the setup will be invalidated.
Traders, if you have your own opinion about this idea, write in the comments section, I always reply. 💬
🚨 RISK DISCLAIMER:
Trading Crypto, Futures, Forex, CFDs, and Stocks involves a risk of loss.
Please consider carefully if such trading is appropriate for you.
Past performance is not indicative of future results.
Always limit your leverage and use a tight stop loss.
--------------------------------------------------------------------------------------------------------
Please like, subscribe, and share this idea with others! ⬇️
--------------------------------------------------------------------------------------------------------
