USD/JPY Robbery Route | Enter at Dip, Exit Before Police💥USD/JPY Forex Money Heist Plan 🎯 — Ninja Robbery at 146.000💥
🌟 Hi! Hola! Ola! Bonjour! Hallo! Marhaba! 🌟
Dear Market Bandits, Money Makers & Risky Robbers 🤑💰💸✈️
Welcome to another Thief Trader-style operation. We've cracked open the USD/JPY vault (aka "The Gopher" 💹), and here's the blueprint to pull off this forex heist like true professionals. 💼🎭💵
🚨 Strategy Overview
This isn't just a trade – it’s a well-researched, precision-timed robbery mission based on technicals, macro analysis, sentiment, and the bigger global picture.
Expect action near critical zones – especially the moving average barricade, where police (aka risk) is waiting. Stay sharp.
🔓 Entry Point – Unlock the Vault
📈 Watch for bullish pullbacks near 146.000.
Whether it's a dip, zone test, or wick bounce — you’re looking to layer buy limit orders like a seasoned thief using DCA tactics.
Enter on swings or any bullish confirmation.
Heist Window is Open.
🛑 Stop Loss – Escape Route
📍 SL near 143.000 (1D swing low) — adjust based on your capital and position size.
💡 Don’t go blind — SL is your backup plan, not an optional accessory.
Custom-fit it based on how many entries you’re stacking.
🎯 Target – Vault Exit Point
🏁 151.000 or exit before resistance heat catches on.
No greedy thieves here — precision exit is key.
Lock profits, vanish in style. 🕶️💼💸
🧲 Scalpers Take Note
Only long side raids are valid. Scalping against the trend? That's walking into a trap.
Use trailing SLs and protect your loot.
Small bag or big vault — play your game smart. 🎯💰
📢 Fundamental Boosters
USD/JPY’s bullish run isn’t random — it’s backed by:
📊 Macro shifts,
📈 COT reports,
🧠 Sentiment drivers,
📉 Intermarket trends,
And a whole mix of thief-level intel 🔍
🧭 Dive deeper before acting. The map’s been provided. 🔗🌍
🗞 News Traps Ahead – Move Cautiously
🚫 Avoid new trades during major releases
🔁 Use trailing SLs on open positions
💡 Position management is a thief’s best defense. Risk management keeps you in the game. 🎯🧠
🔥💖 Support the Heist Crew
Smash that ❤️🔥 Boost Button to keep our robbery engine running.
Each boost = strength for our crew.
💬 Share the love, spread the intel, and trade like a rogue with brains. 🤝💵
👀 Stay tuned for more high-profile FX heists from Thief Trader.
Until next time — loot wisely, vanish clean. 🐱👤💨
Usdjpylong

USDJPY Q3 | D24 | W30 | Y25📊USDJPY Q3 | D24 | W30 | Y25
Daily Forecast🔍📅
Here’s a short diagnosis of the current chart setup 🧠📈
Higher time frame order blocks have been identified — these are our patient points of interest 🎯🧭.
It’s crucial to wait for a confirmed break of structure 🧱✅ before forming a directional bias.
This keeps us disciplined and aligned with what price action is truly telling us.
📈 Risk Management Protocols
🔑 Core principles:
Max 1% risk per trade
Only execute at pre-identified levels
Use alerts, not emotion
Stick to your RR plan — minimum 1:2
🧠 You’re not paid for how many trades you take, you’re paid for how well you manage risk.
🧠 Weekly FRGNT Insight
"Trade what the market gives, not what your ego wants."
Stay mechanical. Stay focused. Let the probabilities work.
FRGNT
FX:USDJPY

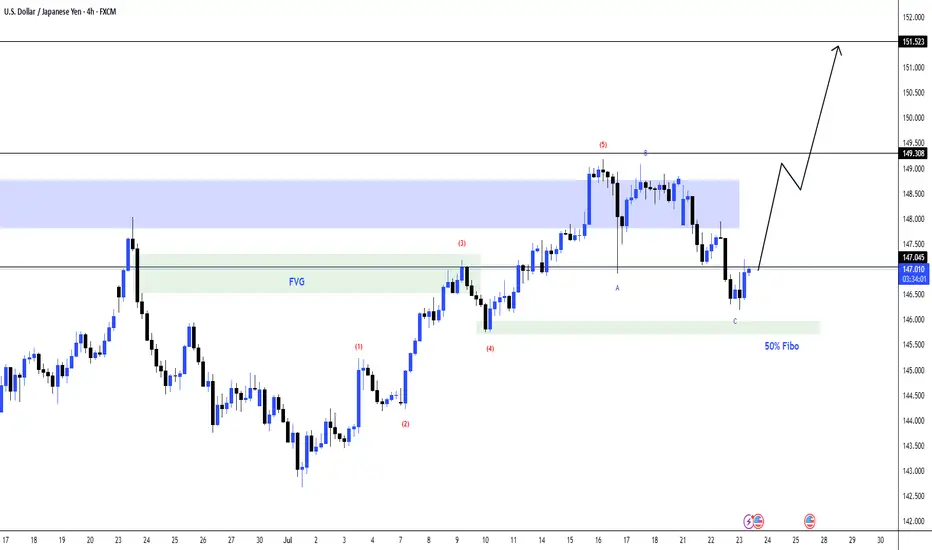
USDJPY 4H Chart Analysis – Bullish Setup in PlayThe USDJPY pair is currently showing signs of a bullish continuation after completing a corrective wave pattern (ABC) down into a strong confluence zone.
📌 Key Technical Insights:
✅ Wave Structure:
The market appears to have completed a 5-wave impulse up, followed by an ABC corrective pattern.
The final leg C has touched the 50% Fibonacci retracement level, aligning with a bullish reaction zone.
✅ Support & Confluence Zone:
Price retraced into the green demand zone marked around the 146.5 level.
This area also aligns with the Fair Value Gap (FVG) and the midpoint of the impulse leg, indicating strong demand interest.
✅ Fair Value Gap (FVG):
Price respected the FVG region twice – first as a breakout, now as a retest.
FVG acts as a dynamic support zone around 146.8–147.2.
✅ Key Resistance & Target Zones:
Immediate resistance lies at 149.30 (previous high and supply zone).
A breakout above this level can trigger a rally toward the 151.50 target, aligning with higher-timeframe resistance.
📈 Potential Bullish Pathway:
As shown on the projection path, price is expected to:
Hold above the 146.5–147.0 demand zone.
Retest 149.30 as resistance.
Continue to push higher toward 151.50, completing a larger bullish leg.
💬 Let me know your thoughts in the comments! Will USDJPY break 151 next?
#USDJPY #ForexAnalysis #ElliottWave #SmartMoney #PriceAction #FVG #TradingView #FX
USDJPY is continuing its uptrend, let's BUY✏️ OANDA:USDJPY broke the price channel and continued its uptrend at 151,000. The previous h4 candle wick had a liquidity sweep to 147,000, showing that the buyers are dominating the market. The USDJPY trading strategy will mainly BUY to the old peak around 151,000. When the price breaks 147,000, a corrective downtrend will begin to form.
📉 Key Levels
Support: 148.200 - 147.200
Resistance: 150.100 - 151.100
Buy trigger: Breakout above 148,800
BUY 147,200 (buyer liquidity zone)
Target: 145,000
Leave your comments on the idea. I am happy to read your views.

USDJPY Falling Fast Bearish Momentum or Reversal Zone?USDJPY has dropped significantly and is now trading around 147.730, nearing a key historical support zone near 147.20 – 147.00.
This area previously acted as a strong demand zone and may trigger a bounce or a breakdown depending on market sentiment.
🔹 Technical Overview (4H Chart):
• Current Price: 147.73
• Support Zone: 147.20 – 147.00
• Resistance: 149.00
• Breakdown Target: 145.80
• Possible Bounce Target: 148.80 – 149.30
📊 Bias:
I'm watching this zone closely.
• If price holds above 147.00 with bullish candle – Long Setup toward 149.00
• If price breaks below 147.00 and closes on 4H – Short Setup toward 145.80
⚠️ Use tight SL below support zone if buying.

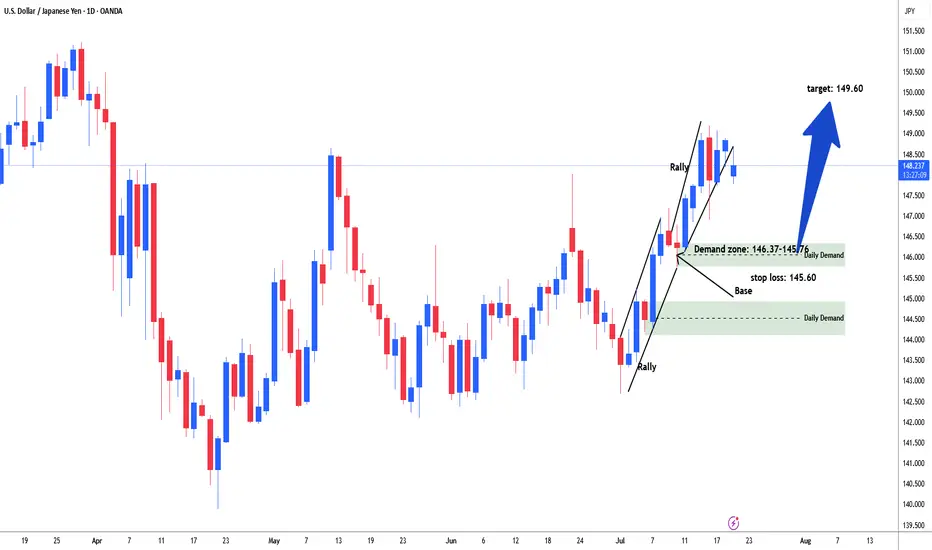
USDJPY Possible long for 149.60#usdjpy started rally from the start of the month of July. Price consolidate in range between 142.85-10. Then started rally. price again consolidate in range between 147.15-145.76 area. Market build energy and institutional add further longs and broke above the daily resistance line 148.60. Need to sell off / retracement to test demand zone range 146.37-145.78 area to test and filled remaining institutional orders for long. Buying area 146.37-145.76. stop loss: 145.60. Target: 149.60
#USDJPY: Swing Buy Almost +2000 Pips! Dear Traders,
The USDJPY currency pair appears to be in an accumulation phase at the moment, as evidenced by the lack of significant price movement throughout the current week. Several factors contribute to this trend.
Firstly, several significant economic events are scheduled for this week, particularly tomorrow and Friday. These developments will have substantial implications for the future trajectory of the USDJPY pair. Consequently, there’s a possibility that the price may experience a decline before initiating a bullish trend. We’ve recently seen a strong bullish candle, which suggests a strong bullish move in the coming weeks. Additionally, the strong USD could continue rising, while the JPY is dropping.
Secondly, there are two primary areas where the price could reverse its course. The extent to which the USD reacts to the economic data will indicate potential reversal zones.
It’s crucial to conduct your own analysis before making any financial decisions. This chart should be used solely for educational purposes and does not guarantee any specific outcome.
Regarding the stop loss, as this is a swing trade, it’s advisable to employ a larger stop loss if the price reaches entry zones. The take profit level can be determined based on your entry type and analysis.
We wish you the best of luck in your trading endeavours and emphasise the importance of trading safely.
Please share this analysis with others through likes, comments, and social media platforms. If you have any questions or require further assistance, don’t hesitate to comment below. We’re here to provide support.
Team Setupsfx_
❤️🚀

#USDJPY: Price is currently accumulating ! Wait For DistributionAt present, the USDJPY currency pair appears to be in an accumulation phase, as evidenced by the absence of significant price movement throughout the current week. Several factors contribute to this trend.
Firstly, several significant economic events are scheduled for this week, particularly tomorrow and Friday. These developments hold substantial implications for the future trajectory of the USDJPY pair. Consequently, there exists a possibility that the price may experience a decline prior to initiating a bullish trend.
Secondly, there are two primary areas where the price could reverse its course. The extent to which the USD reacts to the economic data will serve as an indicator of the potential reversal zones.
It is imperative that you conduct your own analysis before making any financial decisions. This chart should be utilised solely for educational purposes and does not guarantee any specific outcome.
Regarding the stop loss, as this is a swing trade, it is advisable to employ a larger stop loss if the price reaches entry zones. The take profit level can be determined based on your entry type and analysis.
We wish you the best of luck in your trading endeavours and emphasise the importance of trading safely.
Kindly share this analysis with others through likes, comments, and social media platforms. If you have any questions or require further assistance, please do not hesitate to comment below. We are here to provide support.
Team Setupsfx_
❤️🚀
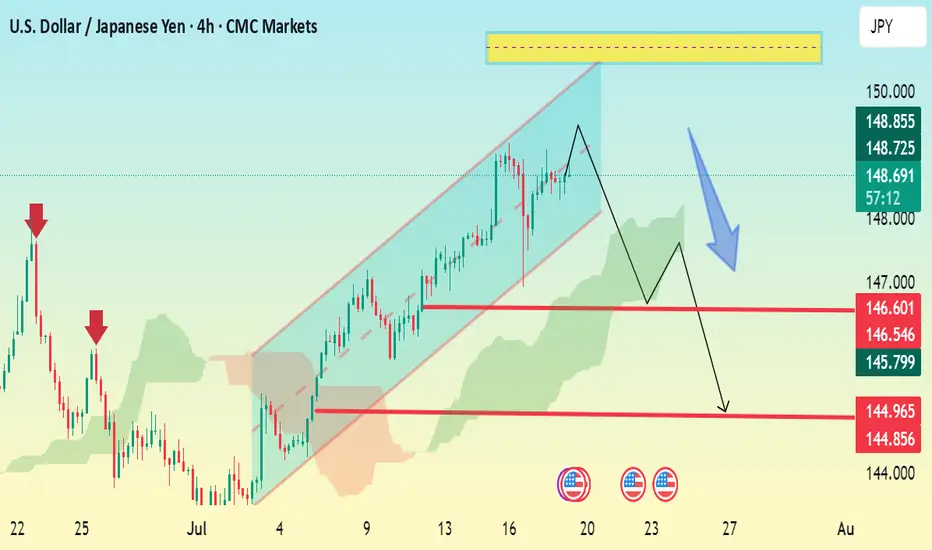
USD/JPY 4H Bearish Setup – Channel Breakdown ExpectedThe chart shows USD/JPY in a rising channel with a projected bearish reversal setup forming. Here’s a breakdown:
🔹 Current Price: 148.83
🔹 Pattern Observed:
The pair is trading inside a rising channel.
A potential double top or lower high formation near the top of the channel suggests weakening bullish momentum.
Price may break down through the channel support.
🔻 Bearish Scenario (as shown by the blue arrow):
1. Initial drop expected to the support zone around:
146.60 – 146.54
Minor consolidation possible at this level.
2. If broken, next target zone is:
144.96 – 144.85
🔑 Key Levels:
Resistance Zone: 149.80–150.00 (highlighted in yellow)
Support Levels:
First: 146.60
Second: 144.96
✅ Bearish Confirmation:
A 4H candle close below 146.60 would confirm the bearish move.
Watch Ichimoku cloud — if price breaks and closes below the cloud, it will strengthen the downtrend.
USD/JPY - Triangle Pattern (18.07.2025)The USD/JPY pair on the M30 timeframe presents a Potential Buying Opportunity due to a recent Formation of a Triangle Pattern. This suggests a shift in momentum towards the upside and a higher likelihood of further advances in the coming hours.
Possible Long Trade:
Entry: Consider Entering A Long Position around Trendline Of The Pattern.
Target Levels:
1st Resistance – 149.93
2nd Resistance – 150.65
🎁 Please hit the like button and
🎁 Leave a comment to support for My Post !
Your likes and comments are incredibly motivating and will encourage me to share more analysis with you.
Best Regards, KABHI_TA_TRADING
Thank you.
Disclosure: I am part of Trade Nation's Influencer program and receive a monthly fee for using their TradingView charts in my analysis.

USD/JPY(20250717)Today's AnalysisMarket news:
The annual rate of PPI in the United States in June was 2.3%, lower than the expected 2.5%, the lowest since September 2024, and the previous value was revised up from 2.6% to 2.7%. Federal Reserve Beige Book: The economic outlook is neutral to slightly pessimistic. Manufacturing activity declined slightly, and corporate recruitment remained cautious.
Technical analysis:
Today's buying and selling boundaries:
147.97
Support and resistance levels:
150.23
149.38
148.84
147.11
146.56
145.72
Trading strategy:
If it breaks through 147.97, consider buying in, and the first target price is 148.84
If it breaks through 147.11, consider selling in, and the first target price is 146.56

USDJPY H1 Support & Resistance Levels🚀 Here are some key zones I've identified on the 15m timeframe.
These zones are based on real-time data analysis performed by a custom software I personally developed.
The tool is designed to scan the market continuously and highlight potential areas of interest based on price action behavior and volume dynamics.
Your feedback is welcome!

Fundamental Market Analysis for July 16, 2025 USDJPYEvent to Watch Today:
15:30 EET. USD – Producer Price Index
USDJPY:
USD/JPY has stabilized around 148.900, maintaining upside potential due to:
Interest Rates: The Fed keeps yields elevated (10-year bonds at 4.46%), while the Bank of Japan maintains an ultra-loose policy, keeping real yields negative.
Political Uncertainty: Upcoming elections in Japan and possible fiscal tightening reduce the yen’s appeal.
Dollar Demand: Trade frictions and geopolitical risks drive safe-haven flows into the dollar.
A break above 149.000 could open the path to 149.500. Support at 148.600 remains a critical barrier for the bullish scenario.
Trade Recommendation: BUY 149.000, SL 148.700, TP 149.900

USD/JPY) Bullish trend analysis Read The captionSMC trading point update
Technical analysis of USD/JPY on the 4-hour timeframe, signaling a breakout and possible rally toward the 151.016 target zone. Here's the detailed breakdown:
---
Technical Analysis – USD/JPY (4H)
1. Bullish Structure Breakout
Price has broken above a long-term resistance trendline, indicating a bullish breakout from a rising wedge or ascending channel.
The breakout is confirmed by bullish momentum and sustained price action above the previous highs.
2. Trendline + EMA Confluence
Price remains well above the 200 EMA (145.143), reinforcing the bullish bias.
A clear higher low was formed at the inner trendline (support), followed by strong upside moves.
3. RSI Strength
RSI is around 63.16, indicating strong bullish momentum without being overbought yet.
Suggests more upside potential while maintaining healthy trend conditions.
4. Price Target Projection
The chart shows two upward extensions:
First move projected ~+2.20%, indicating a measured move target around 149.7.
Final target point is 151.016, based on previous price action extension and resistance level.
Mr SMC Trading point
---
Summary
Bias: Bullish
Current Price: 147.366
Key Support: Rising trendline + 145.143 EMA
Targets:
Short-term: ~149.7
Final: 151.016
RSI: Strong but not overbought (63.16)
Invalidation: Break below the inner trendline support and EMA (below 145.00)
Please support boost 🚀 this analysis)

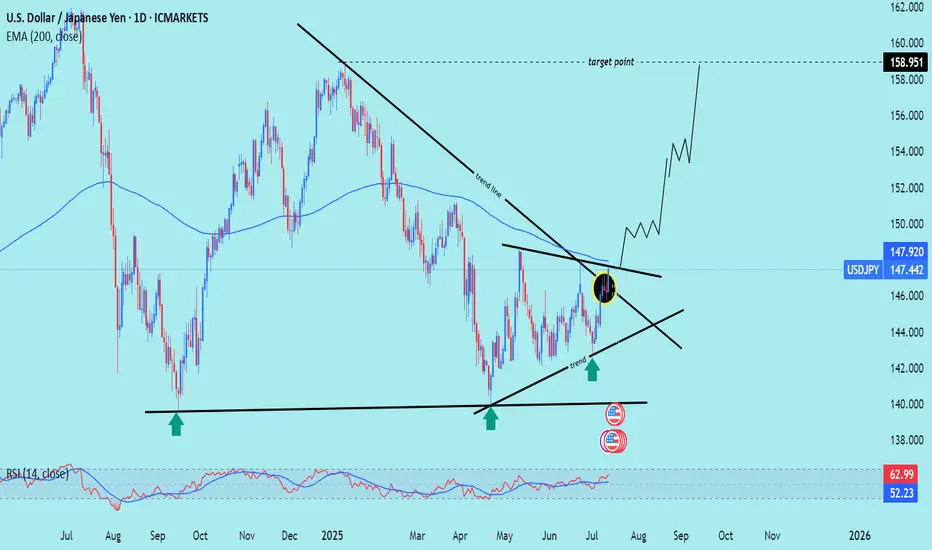
USD/JPY) LOGN TIME Analysis Read The captionSMC trading point update
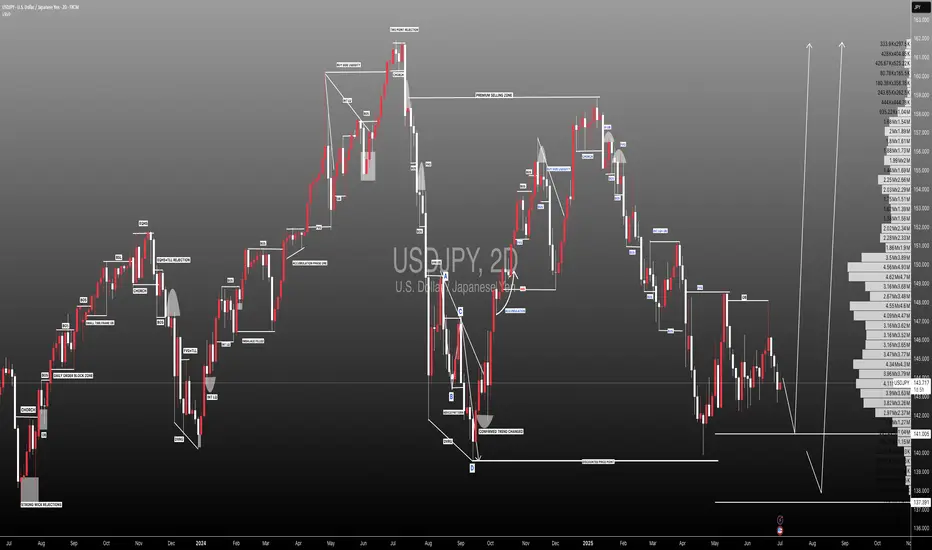
Technical analysis of USD/JPY on the daily timeframe, highlighting a long-term downtrend reversal with potential for significant upside.
---
Analysis Summary
Pair: USD/JPY
Timeframe: Daily
Current Price: 147.442
Bias: Bullish breakout from a descending wedge structure.
---
Key Technical Insights
1. Descending Trendline Break:
Price has broken above the long-term downtrend line, signaling a reversal.
Breakout area is circled in yellow, confirming bullish intent.
2. Trendline & Structure Support:
Multiple rejections from the ascending support trendline (marked by green arrows) confirm accumulation and higher lows.
3. 200 EMA as Dynamic Resistance/Support:
Price is now above the 200 EMA (147.920) — a bullish signal, turning resistance into support.
4. RSI (14):
RSI at 62.99, approaching overbought territory, but still has room to push further.
---
Target Point
Target: 158.951
Based on measured move from wedge breakout and historical resistance level.
---
Trade Setup Idea
Direction Entry Stop-Loss Target
Buy 147.40–147.60 Below 145.80 158.95
Mr SMC Trading point
---
Summary
This chart signals a major bullish breakout on USD/JPY, with the break of a year-long downtrend structure, reclaiming the 200 EMA. If this breakout sustains, price could aim for 158.95 in the coming weeks.
Please support boost 🚀 this analysis)
USD/JPY Profit Heist – Are You In or Missing Out?"🔥💰 "USD/JPY NINJA HEIST: Bullish Loot Before the Trap! (Thief Trading Style)" 💰🔥
🌟 Attention Market Robbers & Profit Takers! 🌟
🚨 Thief Trading Alert: USD/JPY "The Ninja" is primed for a BULLISH HEIST!
Based on our stealthy technical & fundamental analysis, we’re locking in a long entry strategy. The plan? Loot profits before the RED ZONE danger hits! Overbought? Maybe. Risky? Sure. But the real robbery happens before the bears wake up! 🏴☠️💸
🎯 ENTRY: The Vault is OPEN!
Buy Limit Orders: Swipe the dip on pullbacks or jump in at key swing lows.
Aggressive? Enter now & ride the wave!
🛑 STOP LOSS (Thief-Style Escape Plan):
Swing Low (5H TF): 143.600 (Adjust based on your risk & lot size!)
Multiple orders? Scale SL wisely—don’t get caught!
🎯 TARGETS:
Main Take-Profit: 151.000 (Or escape earlier if the trap triggers!)
Scalpers: Only play LONG—trail your SL & lock in quick loot!
📢 SCALPERS & SWING TRADERS:
Got deep pockets? Ride the wave now!
Small account? Join the swing heist & rob the trend slowly!
📈 WHY USD/JPY?
Bullish momentum + Macro/Fundamental tailwinds!
COT Report, Sentiment, & Intermarket Analysis all hint at more upside! go ahead to check 👉🔗🌏
⚠️ WARNING: NEWS = VOLATILITY!
Avoid new trades during high-impact news!
Trailing SL = Your best friend! Protect profits & avoid jail (stop-out)!
💥 BOOST THIS IDEA TO SUPPORT THE HEIST!
More boosts = More robberies = More profits for YOU!
Stay tuned—next heist coming soon! 🚀💰
🔥 Like, Share, & Follow for Daily Steals! 🔥

USDJPY M15 Support & Resistance Levels🚀 Here are some key zones I've identified on the 15m timeframe.
These zones are based on real-time data analysis performed by a custom software I personally developed.
The tool is designed to scan the market continuously and highlight potential areas of interest based on price action behavior and volume dynamics.
Your feedback is welcome!

USD/JPY - H1- Wedge Breakout (07.07.2025)The USD/JPY pair on the H1 timeframe presents a Potential Buying Opportunity due to a recent Formation of a Wedge Breakout Pattern. This suggests a shift in momentum towards the upside and a higher likelihood of further advances in the coming hours.
Possible Long Trade:
Entry: Consider Entering A Long Position around Trendline Of The Pattern.
Target Levels:
1st Resistance – 148.00
🎁 Please hit the like button and
🎁 Leave a comment to support for My Post !
Your likes and comments are incredibly motivating and will encourage me to share more analysis with you.
Best Regards, KABHI_TA_TRADING
Thank you.
Disclosure: I am part of Trade Nation's Influencer program and receive a monthly fee for using their TradingView charts in my analysis.

$UJ (USDJPY) 1HPrice tapped into a 4H FVG (gray zone 146.800–146.300), a high-probability reversal zone when paired with liquidity sweep and break of structure.
The bullish internal trendline was cleanly broken, signaling a short-term shift in momentum.
Prior to the drop, price ran buy-side liquidity resting above previous highs (marked $$$), fulfilling liquidity objectives before reversing.
The move into the 4H-FVG occurred in premium territory, ideal for institutional distribution.
As long as price holds below 146.300 (top of the FVG), the bearish leg remains valid.
Next liquidity target is around 145.240, where previous sell-side liquidity (lows marked $$$) is resting.

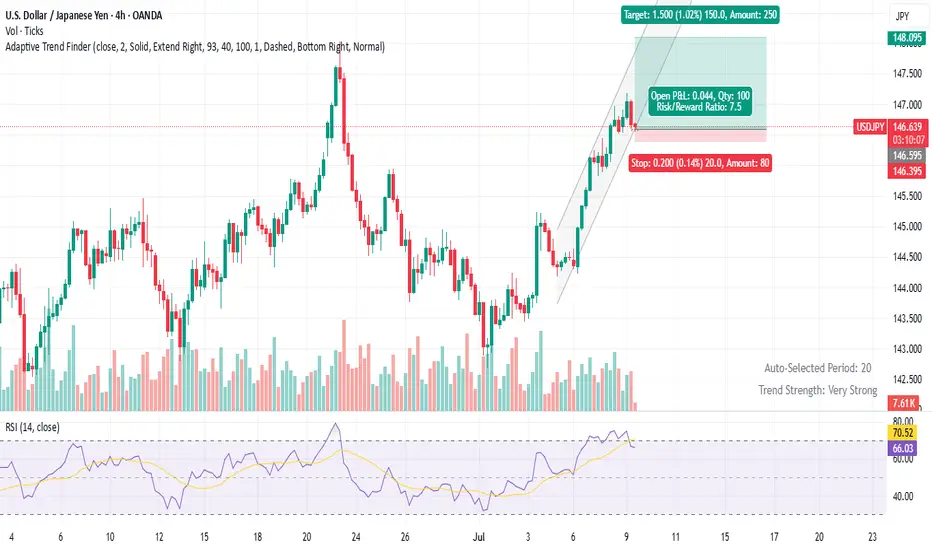
Smart 15-Min Entry on USDJPY – Clear Plan with 2.33 R/R📢 Hey Guys;
I've placed a buy limit order on USDJPY at a key support level.
🔵 Entry: 145.956
🔴 Stop Loss: 145.743
🟢 Targets:
• TP1: 146.069
• TP2: 146.232
• TP3: 146.468
📐 Risk/Reward Ratio: 2.33
-------
Your likes and support are what keep me motivated to share these analyses consistently.
Huge thanks to everyone who shows love and appreciation! 🙏

USD/JPY Long Trade SetupBuy dips - 146.50-146.60
Stop Loss -145.80 - Below retest zone; invalidates breakout.
TP-1 148.80 - Scale 50 % Pattern target / June high cluster.
TP-2 150.00 - Round-number magnet, option strikes.
Rationale
The dollar-yen cross has snapped out of its early-summer drift and vaulted back above the 100-day simple moving average for the first time since February, reaching ¥147.19 on 9 July – a two-and-a-half-week high – as the greenback rides an upswing in U.S. yields and tariff-driven inflation fears. The technical breakout puts the familiar 148.00/150.00 band – the June swing high and the psychological round number – back in play for trend-followers over the next several sessions.
Policy divergence as wide as ever
Federal Reserve – higher-for-longer: Minutes from the June FOMC showed staff pushing inflation projections higher and flagging “upside risks” should tariff pass-through accelerate, reinforcing the market’s view that rate cuts will be pushed into Q4 at the earliest. Five straight sessions of rising Treasury yields have followed, lifting the 10-year to 4.45 % and widening the U.S.–Japan real-rate gap.
Bank of Japan – stuck on hold: Former BOJ board member Makoto Sakurai told Reuters the central bank will “wait at least until March 2026” before considering another hike, as Trump’s 25 % tariff on Japanese goods (effective 1 August) clouds the export outlook and will likely force the BOJ to cut its growth forecast at the 31 July Outlook Report. With headline CPI still only just above target and real wages contracting.
USDJPY – Key Support Bounce with Macro TailwindsUSDJPY is bouncing off a key trendline and 61.8% Fib zone (143.25–143.60) with confluence across multiple JPY crosses (EURJPY, AUDJPY, CADJPY). This area has historically triggered strong upside momentum, and the current setup aligns with both technical structure and macro drivers.
📊 Fundamentals Supporting the Move:
✅ US Yields Stable: US10Y is holding above 4.20%, keeping USDJPY supported. If yields push back toward 4.30%, expect USDJPY to retest 145.30 and potentially 147.80.
✅ BoJ Dovish: Japan shows no shift in policy. Despite weak Tankan data, BoJ remains patient, and no meaningful rate hike or YCC change is expected soon.
✅ USD Macro Resilience: Core PCE held firm at 2.6%. Focus now shifts to ISM Services PMI (Wed) and NFP (Fri). Markets are still pricing a soft landing – supporting risk-on and a stronger USD.
✅ JPY as a Fading Safe Haven: Even with geopolitical headlines (Trump tariff tensions, Taiwan, Middle East), JPY demand remains weak. Traders are favoring USD and Gold over JPY as risk hedges.
⚠️ Risks to Watch:
Dovish US Data Surprise: Weak NFP or ISM could drag yields down and trigger USDJPY reversal.
Verbal or Actual BoJ Intervention: If we approach 148.50–150, Japan may step in again.
Geopolitical Escalation: Any sharp risk-off could trigger safe haven demand for JPY, though this has underperformed recently.
🔎 Correlation Dynamics:
📈 USDJPY is leading JPY crosses like EURJPY and AUDJPY. The recent bounce started simultaneously across the JPY complex, with USDJPY slightly ahead.
📉 If US yields drop or risk sentiment shifts, USDJPY may lag gold or bonds but eventually catch up.
🧠 Trading Plan:
📍 Entry Zone: 143.30–143.60 (trendline + Fib confluence)
🎯 Target 1: 145.30 (38.2% Fib)
🎯 Target 2: 147.80 (channel resistance)
🛑 Invalidation: Daily close below 141.50 with US yields breaking down
📅 Upcoming Events to Watch:
Wed July 3: ISM Services PMI (key for USD reaction)
Fri July 5: US Non-Farm Payrolls + Average Hourly Earnings
JPY Risk: Verbal intervention possible near 148+
🧭 Summary:
USDJPY is positioned for a bullish continuation, backed by:
Rising yields
Resilient US macro
Weak JPY fundamentals
Technical structure respecting trendline support
Short-term traders can target the 145–147.80 range ahead of NFP, with a tight eye on yield and risk sentiment.
📌 If this analysis helps, drop a like and follow for more real-time macro-technical breakdowns. Stay nimble ahead of NFP! 🧠📈

USDJPY Price Accumulated|Time For Bullish Distribution|Setupsfx|The price has accumulated nicely and is now distributing. We have three targets in mind, but set your own based on your analysis. Our approach is purely technical, but also includes a basic fundamental approach. This analysis concludes over 1500 pips and is a swing move. Please use this analysis as educational purposes only, as it does not guarantee that price will move exactly as predicted.
If you like our idea, please consider liking and commenting on it.
Good luck and trade safely!
Team Setupsfx_
