USDJPY 4H: Bullish outlook seen, further upside above 136.5Price is bullish, forming higher highs and higher lows. Price is currently hovering above a key demand zone at 134 on the H4 timeframe. A throwback to this demand zone, which coincides with the 78.6% Fibonacci retracement, followed by a break above our upside confirmation at 135.2 could provide the bullish acceleration to the supply zone at 136.5.
Usdjpylong

Potential bullish breakout in play on USD/JPYTokyo has just opened and we see futures traders shorting the yen with decent volume, which suggests institutions have a bearish bias today on the local currency.
This has pushed USD/JPY up to a 4-day high, and keeps a bull-flag breakout in play on the 1-hour chart. The flag projects a target around 135.50, but we're looking for prices to retrace towards the 113.17 high for a potential long to increase the reward to risk ratio.
Note that the sideways oscillation formed a triple bottom around 134.63, before a higher low formed around 135 / 200-bar EMA to show an increase in bullish activity - which favours an upside break from its sideways range.

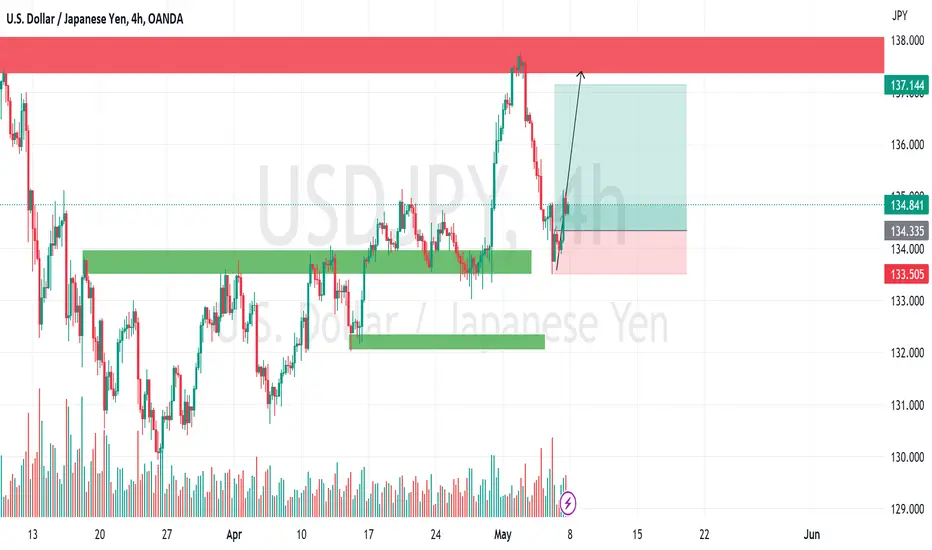
USDJPY to find support at trend line?USDJPY - 24h expiry
Trend line support is located at 134.00.
The trend of higher lows is located at 129.80.
We can see no technical reason for a change of trend.
The Risk/Reward would be poor to call a buy from current levels.
A move through 135.00 will confirm the bullish momentum.
We look to Buy at 134.05 (stop at 133.55)
Our profit targets will be 135.25 and 135.50
Resistance: 135.00 / 135.50 / 135.75
Support: 134.50 / 134.00 / 133.50
Risk Disclaimer
The trade ideas beyond this page are for informational purposes only and do not constitute investment advice or a solicitation to trade. This information is provided by Signal Centre, a third-party unaffiliated with OANDA, and is intended for general circulation only. OANDA does not guarantee the accuracy of this information and assumes no responsibilities for the information provided by the third party. The information does not take into account the specific investment objectives, financial situation, or particular needs of any particular person. You should take into account your specific investment objectives, financial situation, and particular needs before making a commitment to trade, including seeking advice from an independent financial adviser regarding the suitability of the investment, under a separate engagement, as you deem fit.
You accept that you assume all risks in independently viewing the contents and selecting a chosen strategy.
Where the research is distributed in Singapore to a person who is not an Accredited Investor, Expert Investor or an Institutional Investor, Oanda Asia Pacific Pte Ltd (“OAP“) accepts legal responsibility for the contents of the report to such persons only to the extent required by law. Singapore customers should contact OAP at 6579 8289 for matters arising from, or in connection with, the information/research distributed.

USDJPY H1 this gay is again pullback for more loge with high and low . this is beautiful step for more profit

USDJPY Going for UptrendAfter a long Down Trend. Price Taps into 4hr Demand Zone. We will wait for the CHOCH in 15 Min to Confirm the Bullish Trend.

USDJPY BuyUSDJPY is taking support on its major levels. Japanese yen is not stronger, as we all knows Japan did not increased it interest.
USD-JPY Rebound aheadThe FED were dovish as expected which hammered the USD. This whole debacle is based on their banking system and how the FED is trying to resolve. NFP coming out tomorrow!
Carpe Diem!


USDJPY | Perspective for the new week | follow-up detailsFollwing the Bank of Japan’s policy meeting on Friday, the US Dollar moved a significant 1.74% against the Japanese Yen to settle above the 135.000 for the first time in six weeks. The risk-averse market atmosphere helped the Greenback find demand as a safe haven while hawkish Federal Reserve (Fed) bets provide an additional boost to the currency. The coming week is laced with a handful of high impact macroeconomic event hence the need to consider different factors before making an informed decision. In this video, we dissected the current market structure form a technical stanpoint to figure out how to position ourselves ahead of the new week.
Disclaimer:
Margin trading in the foreign exchange market (including commodity trading, CFDs, stocks etc.) has a high risk and is not suitable for all investors. The content of this speculation (including all data) is organized and published by me for the sole purpose of education and assistance in making independent investment decisions. All information herein is for your reference only and I take no responsibility.
You are hereby advised to carefully consider your investment experience, financial situation, investment objective, risk tolerance level, and consult your independent financial adviser as to the suitability of your situation prior to making any investment.
I do not guarantee its accuracy and is not liable for any loss or damage which may result directly or indirectly from such content or the receipt of any instruction or notification therewith.
Past performance is not necessarily indicative of future results.

USDJPY - Long#USDJPY In Daily Time Frame Setup
USDJPY is Way to Up
We are looking bullish moves at that area.


USDJPY: The seller is back!Fundamental Overview
Over the last two decades, the US Dollar's share of the global market has declined from 71 percent to 59 percent, and there is a possibility of further reduction in the future. This decline has an adverse impact on the United States as currency usage in the global trade market works on a zero-sum basis. When other currencies like Yuan, real, or Rupee are used in global trade, it reduces the usage of the US dollar. If the credible alternatives of the US dollar get popular, it will weaken America's dominance in the global market.
US Dollar's position as the primary global reserve currency is being challenged
Plan trade in the intro ♥

USDJPY0.25% Interest rate on the DOllar.
are we going to see a bullish dollar against the yen?
whats your thought?
This is not a financial advice, trade base on your own decissions.
Follow for more

USD/JPY: Rebound during today' session?From a technical point of view, some consolidation swing is possible on small time frames (15'). As we can see on 15' chart, the FX:USDJPY pair may have developed an impulsive structure (12345). With this in mind, a bullish leg can appear during today's session with a first Target around 136. The market is waiting for the FOMC decision so be careful during this important event. This is a speculative setup (scalp) and requires experience and good risk management.
LONG TERM ANALYSIS (BULLISH)
(Click & Play on chart below)
Trade with care!
Like if my analysis is useful.
Cheers!

USDJPY long Sell We looking for selling opportunities, as most impulses will be bearish.
From the break of our structure we have a clear impulse with consecutive continuation flags. The purple Arcs show reversal (triple top), shows strong resistance and more confirmation that we taking bearish movement. The recent ascending channel have completed multi- touch confirmation ( 3 touches to complete a structure) showing that we have more probability of going down!

USDJPY - Expect retracement ✅Hello traders!
‼️ This is my perspective on USDJPY.
Technical analysis: Here we are in a bullish market structure from 4H timeframe perspective, so I am looking for longs from premium zone. For now I expect price to continue the retracement to fill the imbalances lower and then to reject from bullish order block + institutional big figure 134.000.
Fundamental analysis: Tomorrow will be released Interest Rate in USA which is expected to increase, as well FOMC Meeting. Also, on Friday we have NFP and Unemployment Rate in USA. Pay attention to these news, as they are important for the upcoming month and USD bias.
Like, comment and subscribe to be in touch with my content!

USDJPY POTENTIAL LONG FORMATION IN PROGRESSWe have been looking at this pair and waiting for various patterns to form which will assist us
to form a basis for the potential direction of the pair. Our trades are based on the higher time frame
trend, being the weekly and monthly charts in order to avoid excessive noise of the lower time
frames. We can see that the pair remains bullish despite the pair showing bearish price action on
the lower time frames, hence we are only looking for buying opportunities until further notice.
With this being said we have managed to spot a buying opportunity due to the following reasons
listed below:
1: Trendline breakout
2: Double bottom pattern formation.
We are still waiting for two more confluence factors to form before we consider looking for entries.
These have been listed below:
1: Key-level breakout which signals a change in market structure from bearish and bullish
2: Entry will be on a retest of key level area.

USDJPY:Capitalizing on Short-Term Retracement for Long-Term Gain"Banking on USDJPY: Capitalizing on Short-Term Retracement for Long-Term Gains"
In this idea, we explore a trading strategy that involves taking a long position on the USDJPY currency pair after a short-term retracement, based on the strength of the dollar and recent bank data.
As the global economy continues to recover from the pandemic, investors are closely watching bank data to gauge the health of the financial system. Recent data shows that banks are reporting strong profits and loan growth, indicating a positive outlook for the economy. This has led to a strengthening of the US dollar against the Japanese yen, making USDJPY an attractive option for traders looking for long-term gains.
However, in the short-term, there may be periods of retracement as the market adjusts to new information. By taking advantage of these short-term dips, traders can position themselves for long-term success. This strategy involves waiting for a retracement in the USDJPY pair, then taking a long position based on the strength of the dollar and positive bank data.
By examining past retracements and analyzing current market trends, traders can identify the optimal time to enter the market for maximum gains. This idea will provide insights into the factors that affect USDJPY trading, as well as tips for implementing this strategy effectively.
Whether you're an experienced trader or just starting out, this idea offers valuable insights into how to profit from short-term retracements and long-term gains in the USDJPY currency pair.

USDJPY top-down analysis Hello traders, this is a complete multiple timeframe analysis of this pair. We see could find significant trading opportunities as per analysis upon price action confirmation we may take this trade. Smash the like button if you find value in this analysis and drop a comment if you have any questions or let me know which pair to cover in my next analysis.

USDJPY News H1Here is my view for USDJPY on H1 for May 1st, 2023. The price could go bullish, you can put a pending order on the Order block or find an entry on LTF within OB Zone. Trade Safe!

USDJPY: Buyer's Opportunity!Fundamental Overview
The USD Index, which follows the performance of the US dollar against other currencies, has declined and is impacting the USD/JPY pair. There are concerns about the banking sector crisis in the US, a potential recession, and the US debt ceiling, leading to speculation that the Federal Reserve may cut interest rates later this year. As a result, US Treasury bond yields are decreasing, causing the US dollar to weaken.
Plan trade in the intro ♥

Long USDJPYI'm going long here just above 134 on USDJPY. I failed on two previous attempts around 133.63 (38.2 retracement) and got stopped out with much tighter stops. I still like USDJPY long currently based on a fundamental bias with COT data showing 63% of institutions are long USD and 83% are short JPY. In addition, US GDP and interest rates outweight the JPY.
From a technical standpoint, we have a fairly strong uptrend in play currently throughout 2023 with a nice channel showing some nice reactions along this slope. Specifically, we recently saw support hold around 134, and some bullish price action just below that around 133.50 with a break and retest back above 134. In my opinion, this is a bullish signal that could warrant a move back to 135 or 135.50.
I have a stop just below structure around 133.25 and I took two separate positions which I will plan to close half of at 135 and then trail stops on the remaining half.
Longer term view
Break and retest on on the 30m

USDJPY (Is the whole world scramble for collateral?)
View On USDJPY (19 Apr 2023)
UJ is in
* Uptrend in short term (Intraweek)
* Uptrend in Mid term (Intramonth)
* Uptrend in Long term (Last 3 months)
Now UJ has managed to stay above 130 and we need to watch 134.8x region closely.
Once the break out is strong, we shall easily see 136 region.
140 will be the next.
DYODD, all the best and read the disclaimer too.
Feel Free to "Follow", press "LIKE" "Comment".
Thank You!
Legal Risk Disclosure:
Trading crypto, foreign exchange or CFD on margin carries a high level of risk, and may not be suitable for all investors.
The high degree of leverage can work against you as well as for you.
Before deciding to trade foreign exchange you should carefully consider your investment objectives, level of experience and risk appetite.
The possibility exists that you could sustain a loss of some or all of your initial investment and therefore you should not invest money that you cannot afford to lose. You should be aware of all the risks associated with foreign exchange trading, and seek advice from an independent financial advisor.
