USDJPY is in bullish modeUSDJPY is making a triangle pattern if breaks upward then it will bullish
Buy at 134.600
TP 135.164
SL 134.000
Usdjpylong

USDJPY SellThe USD/JPY pair is approaching 134.50 amid the release of the dovish Bank of Japan (BoJ) minutes for the monetary policy meeting, announced last week on March 09. The last monetary policy announcement by ex-BoJ Governor Haruhiko Kuroda lacked surprises as a continuation of an ultra-dovish policy stance was highly required to keep inflation steady near desired rates.
The commentary in BoJ minutes that the central bank will continue with Quantitative and Qualitative Monetary Easing (QQE) with Yield Curve Control, aiming to achieve the price stability target of 2 percent, as long as it is necessary for maintaining that target in a stable manner, indicates that the ultra-loose monetary policy would stay for a longer period.
USDJPY main trend is still down. Currently on the h1 chart this currency pair is in a deep correction. Recommend waiting to sell down when the price returns to 135.00, SL: 135.60, TP: 134.00

USDJPY - Short active ✅Hello traders!
‼️ This is my perspective on USDJPY.
Here we are in a bearish market structure from H4 timeframe perspective, so I am looking for shorts. I expect bearish price action from here as price rejected from bearish order block + institutional big figure 135.000.
‼️Attention!!! Due to the fact that we have news events on USD tomorrow, the analysis can be invalidated.
Like, comment and subscribe to be in touch with my content!

USDJPY: Bull Run AgainAfter a huge bull run, we expect the price to mitigate both buyers and sellers to generate liquidity for the next move.
I personally believe we will see a final sweep of sellers around my sell zone of interest before selling off aggressively to the downside to take out the remaining buyers.
Once this move is complete, or something similar has occurred.
I will then look to buy in and continue with the bulls.
You can play between the zones if you like but ideally getting the long-term buy is better.

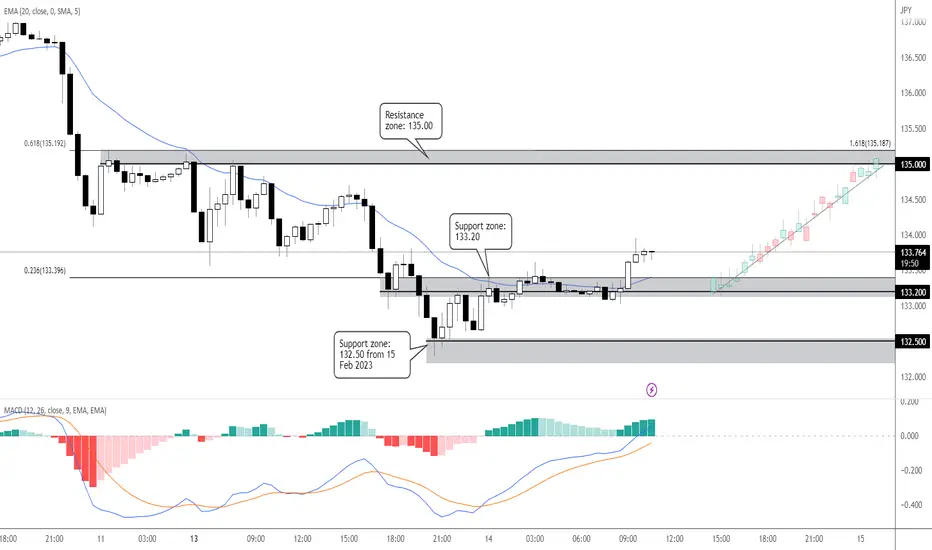
USDJPY M30: Bullish outlook seen, further upside above 133.20Prices have broken above a key resistance-turned support zone at 133.20 on the M30 timeframe, in line with the 23.6% FIbonacci retracement. A throwback to this zone could present an opportunity to ride the bounce to the resistance zone at 135.00, which coincides with the 161.8% Fibonacci extension and 61.8% Fibonacci retracement. Price is holding above the 20 EMA, while MACD is showing bullish momentum, supporting our bullish bias.
USDJPY SellUSD/JPY is down some 1.3% on the day and has fallen from a high of 135.05 to a low of 132.28 ahead of what will be critical data in the US Consumer Price Index on Tuesday. The US Dollar was pressured at the start of the week and in a continuation to the fallout from the Nonfarm Payrolls.
While the Nonfarm Payrolls showed robust jobs growth, the rise in the Unemployment Rate and signs of cooling wage inflation sent the greenback lower as investors started to trim bets that the Federal Reserve will raise interest rates as sharply. The United States added 311,000 payrolls in February and the unemployment rate rose to 3.6%. However, a survey of economists polled by Reuters expected the United States to have added 205,000 jobs last month and the unemployment rate to hold steady at 3.4%. Average hourly earnings rose 0.2% last month after gaining 0.3% in January, below expectations of 0.3%.
USDJPY h1 price is in a downtrend. After a correction at the end of yesterday, the price is now showing signs of continuing to go down. With this pair traders can sell to current price 133.18, SL: 133.90, TP: 132.00

USDJPY Potential BuyUSD has been loosing value due to the 2 bank runs that happened over the weekend causing price to have a major sell off, we have reached support so I believe we are over sold and should see a retracement to highlighted zone. BUY!!!

usdjpy elliott wave analysis updateusdjpy elliott wave analysis update 13/03/2023
Then activate all sales operations on a pair and then achieve a profit of 760 points
Now, the price will often change its direction because all the rise was just a correction. Let us prepare for upcoming selling operations after the correction. The pair is currently descending with an impulse wave that we can call it wave 1 or A.

USDJPY (Week Buy)From the previous week, USD/JPY did sell as expected due to the top resistance zone within my screen shot. Also the USD red folder news on March 10th (Unemployment Rate) made it to sell tremendously to the support zone and exceeded my expectations. This week, im expecting a buy since we have CPI and PPI reports coming out, causing the USD to be stronger and be in a uptrend to the top resistance zone. Just my opinion, thoughts? have a good week everyone.
I left a link to the previous week.


The USD/JPY currency pair is expected to continue its upward..The USD/JPY currency pair is expected to continue its upward trend above 137.00 as the Bank of Japan maintains an ultra-loose monetary policy.
The USD/JPY currency pair is currently experiencing reduced volatility around 136.65, following a period of heightened volatility due to the Bank of Japan's (BoJ) decision to maintain an ultra-easy monetary policy. BoJ Governor Haruhiko Kuroda has implemented this policy in response to the lack of inflationary pressure caused by stagnant domestic demand and wages in the Japanese economy.

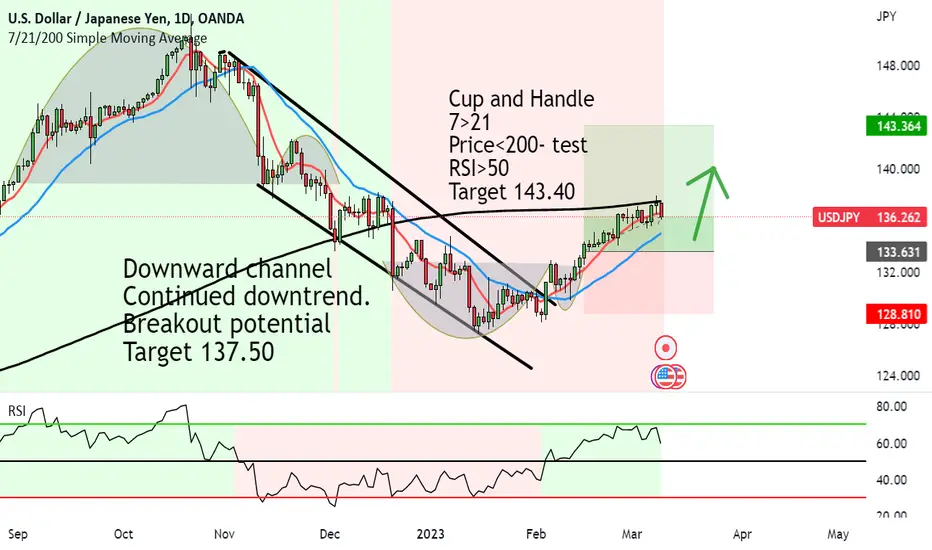
USDJPY showing strong upside from the big break of structure upCup and Handle formed on USDJPY after the major downtrend broke up.
The Price has now officially entered into a bull market where we can expect upside to continue.
7>21
Price<200- test
RSI>50
Target 143.40
This coincides with the US dollar strengthening brining down many other currencies.
USD JPY BUY usdjpy buy a good opportunity now'
reasons are :
1. break of structure
2. taking inducment
3. poi opportunity
please support with ur like and comment. if my analysis helpful. please join my channel also..
note: please close half trade if ur positive trade running in 50% profit

