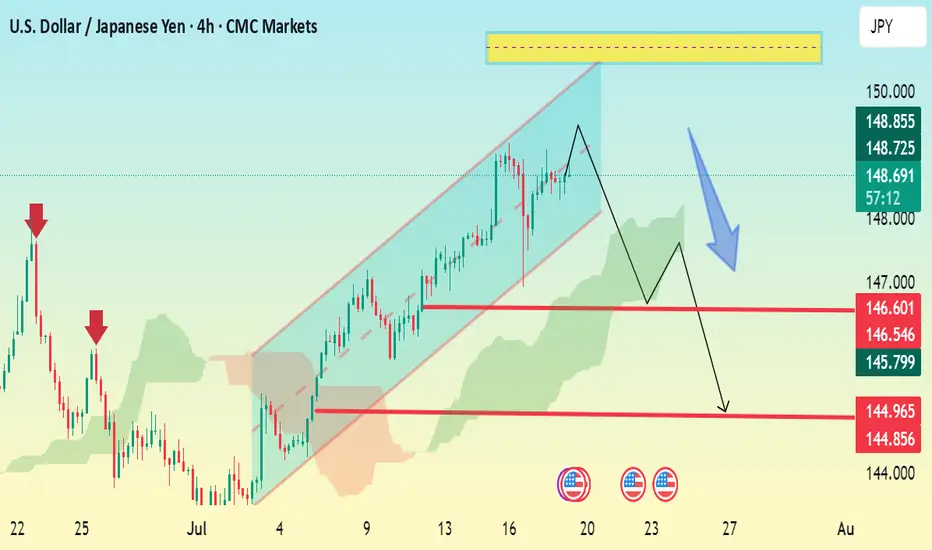
USD/JPY 4H Bearish Setup – Channel Breakdown ExpectedThe chart shows USD/JPY in a rising channel with a projected bearish reversal setup forming. Here’s a breakdown:
🔹 Current Price: 148.83
🔹 Pattern Observed:
The pair is trading inside a rising channel.
A potential double top or lower high formation near the top of the channel suggests weakening bullish momentum.
Price may break down through the channel support.
🔻 Bearish Scenario (as shown by the blue arrow):
1. Initial drop expected to the support zone around:
146.60 – 146.54
Minor consolidation possible at this level.
2. If broken, next target zone is:
144.96 – 144.85
🔑 Key Levels:
Resistance Zone: 149.80–150.00 (highlighted in yellow)
Support Levels:
First: 146.60
Second: 144.96
✅ Bearish Confirmation:
A 4H candle close below 146.60 would confirm the bearish move.
Watch Ichimoku cloud — if price breaks and closes below the cloud, it will strengthen the downtrend.
Usdjpyshort
USDJPY SELLUSD/JPY rises further and approaches 148.00 as the US Dollar firms up
The US Dollar rallies for the second consecutive day against the Yen, and approaches 148.00. Strong US data support the Fed's "wait and see" stance and underpin demand for the US Dollar. In Japan, the uncertain political context is likely to deter the BoJ from hiking interest rates further.
Previous market optimism is turning into caution as the market shifts its focus to the monetary policy reports by the Bank of Japan and the US Federal Reserve due next week.
The Fed is widely expected to leave interest rates unchanged next week, more so after the strong US business activity and Jobless Claims figures released on Thursday. These data confirmed that the US economy remains resilient with a healthy labour market, which gives further leeway for the Fed to await further insight into the impact of tariffs before resuming rate cuts. The US Dollar has been trading higher following Thursday’s releases.
Also on Thursday, US President Trump paid an unusual visit to the Federal Reserve, only a few days ahead of their monetary policy meeting. Trump complained about the overcosts of the headquarters’ renovation and pressed for a less restrictive monetary policy, but his unusually soft comments after the visit eased investors’ concerns about the previous attacks on the central bank's independence.
In Japan, the somewhat softer Tokyo inflation figures seen on Friday and the trade deal would help the BoJ to continue hiking interest rates, but the bank is likely to stand pat next week and probably delay further monetary tightening until the political situation clarifies. This is likely to keep the Yen upside attempts subdued in the near-term.
SUPPORT 147.642
SUPPORT 147.311
SUPPORT 146.854
RESISTANCE 148.206
RESISTANCE 147.972

USD/JPY Is Ready Move Will Be Fly USD/JPY 30-min chart shows a potential buy setup from the 146.18 support zone, targeting 148.10 with stop loss at 145.82. Price is expected to rise through resistance levels at 147.00 and 147.70.

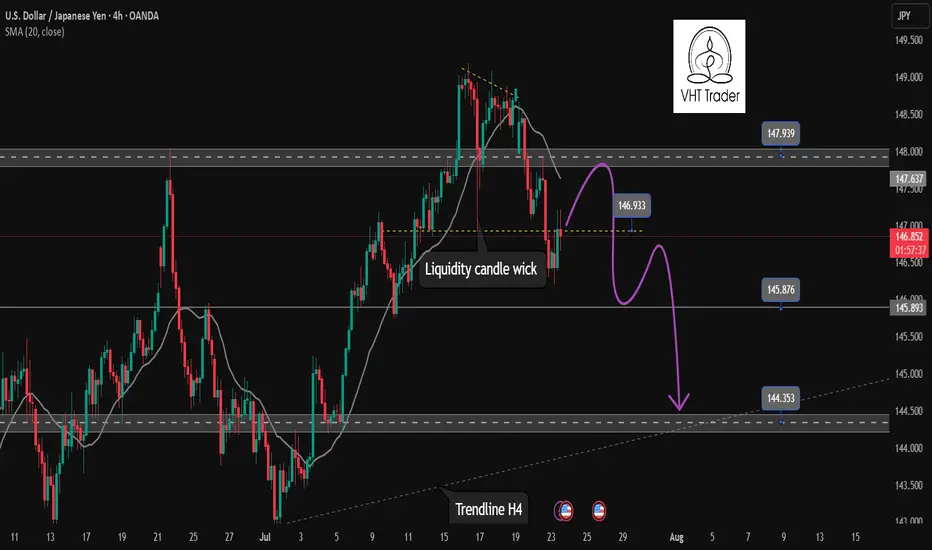
Continuation of downtrend. Waiting for confirmation SELL USDJPY✏️ OANDA:USDJPY is starting a corrective downtrend. Yesterday's New York session's selling pressure surpassed the buying liquidity zone around 147,000. This further confirms the possibility of the pair continuing its downward correction. Some recovery waves in today's Asia-Europe session are considered a good opportunity to SELL towards the target of 144,300 (trailline zone of the h4 frame). Pay attention to the important breakout price zone of 145,900.
📉 Key Levels
Support: 145,900-144,300
Resitance: 147,000-147,800
SELL trigger: Rejection from 147,000
SELL 147,700 (Strong resistance + SMA 20)
Target 144,400
SELL DCA: Break 145,900
Leave your comments on the idea. I am happy to read your views.
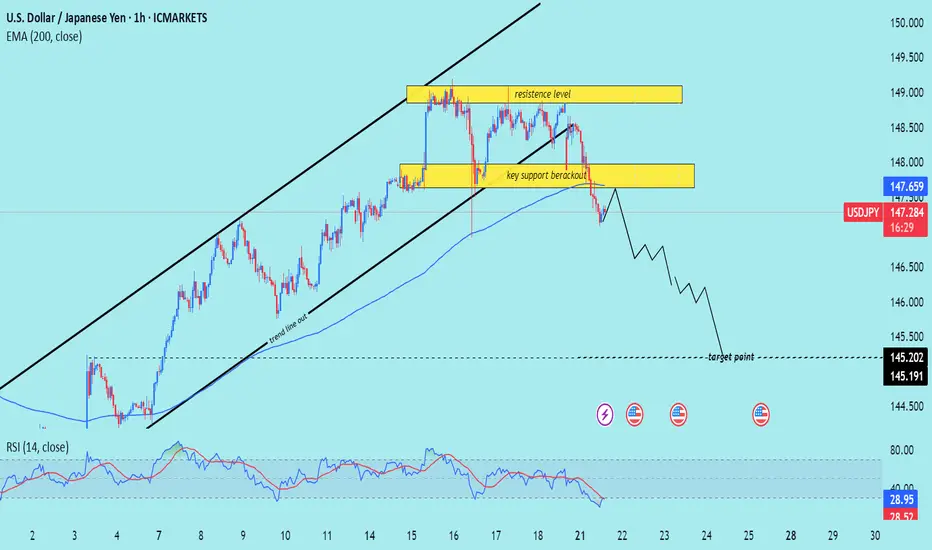
USD/JPY) bearish Trend Read The captionSMC Trading point update
Technical analysis of USD/JPY on the 1-hour timeframe, signaling a potential drop toward the 145.200 – 145.191 target zone. Here's the detailed breakdown:
---
Technical Analysis – USD/JPY (1H)
1. Rising Channel Breakdown
Price has broken below an ascending channel, confirming a trend line breakout and signaling a trend shift from bullish to bearish.
The trend line cut and rejection from the upper resistance zone support the bearish reversal.
2. Key Support Breakout
A crucial horizontal support zone around 147.80–148.00 was broken.
The break-and-retest of this area (yellow box) acts as a confirmation of bearish momentum continuation.
3. Bearish Momentum Below EMA
Price is trading below the 200 EMA (147.659) — a strong signal of downward bias on this timeframe.
The EMA has flipped from dynamic support to resistance.
4. RSI Oversold but Bearish
RSI is at 29.41, in oversold territory, which may hint at a short-term bounce.
However, the broader structure suggests more downside potential before a deeper retracement.
5. Target Projection
Projected target zone is between 145.200–145.191, aligning with previous structure lows and likely liquidity zone.
Mr SMC Trading point
Summary
Bias: Bearish
Current Price: 147.307
Key Resistance: 147.80–148.60 zone
Structure: Rising channel break + key support breakout
200 EMA: Above price (bearish signal)
RSI: 29.41 – oversold but momentum remains bearish
Target: 145.200–145.191
Please support boost 🚀 this analysis)
USDJPY Bearish Breakout!
HI,Traders !
#USD-JPY was trading along
The rising support line but
Now we are seeing a bearish
Breakout so we are bearish
Biased and we will be expecting
A further bearish move down !
Comment and subscribe to help us grow !

USD/JPY 4-Hour Forex Chart4-hour chart from FOREX.com displays the exchange rate between the U.S. Dollar (USD) and the Japanese Yen (JPY). The current rate is 147.446, with a slight increase of 0.072 (+0.05%). The chart shows recent price movements, including a notable drop within a highlighted support and resistance zone (light green and pink areas). Buy and sell prices are marked at 147.446 and 147.444, respectively, with additional price levels indicated on the right side ranging from 146.943 to 149.000. The chart includes candlestick patterns and is timestamped up to July 22, 2025.

USDJPY SELL
USD/JPY
Editorial Tools Latest
USD/JPY Forecast and News
share
Join
NEW
Japanese Yen hangs near multi-month low against USD ahead of Japan election on Sunday
The Japanese Yen drifts lower against its American counterpart for the second straight day on Friday and remains within striking distance of an over three-month low touched earlier this week. Investors now seem convinced that the Bank of Japan (BoJ) would forgo raising interest rates this year amid worries about the economic fallout from higher US tariffs
From a technical perspective, the USD/JPY pair showed some resilience below the 100-hour Simple Moving Average (SMA) earlier this week, and the subsequent move up favors bullish traders. Moreover, oscillators are holding comfortably in positive territory and are still away from being in the overbought zone. However, the overnight failure to build on the momentum beyond the 149.00 mark warrants some caution. Hence, it will be prudent to wait for some follow-through buying beyond the 149.15-149.20 region, or a multi-month peak, before positioning for a move towards reclaiming the 150.00 psychological mark.
On the flip side, the 148.20-148.25 region, or the 100-hour SMA, could offer immediate support ahead of the 148.00 mark. Some follow-through selling, leading to a slide below the 147.70 area, could make the USD/JPY pair vulnerable to accelerate the fall towards testing sub-147.00 levels. Acceptance below the latter might shift the bias in favor of bearish trades and drag spot prices to the 146.60 intermediate support en route to the 146.20 area, the 146.00 mark, and the 100-day SMA, currently pegged near the 145.80 region
1 SUPPORT147.642
2 SUPPORT 147.311
3 SUPPORT 146917
1 RESISTANCE 148.206
2 RESISTANCE 147.972

U.S. Dollar / Japanese Yen - 4h Chart (FOREX.com)4-hour chart from FOREX.com shows the exchange rate between the U.S. Dollar (USD) and the Japanese Yen (JPY). The current rate is 148.184, reflecting a decrease of 0.623 (-0.42%) as of 01:29:16. The chart highlights recent price movements over the past few hours, with a shaded area indicating a consolidation phase around the current level.

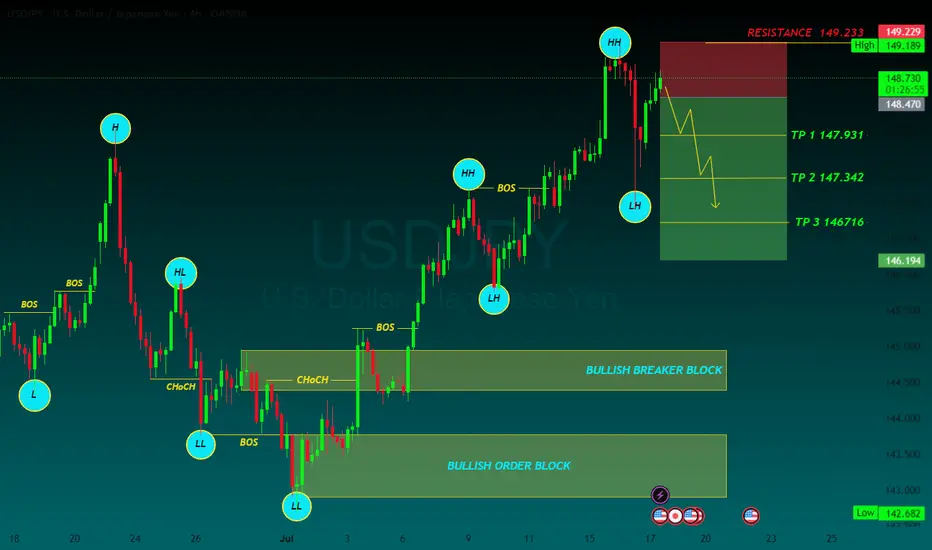
USDJPY Q3 | D21 | W30 | Y25 15' OB UPDATE 📊USDJPY Q3 | D21 | W30 | Y25 15' OB UPDATE
Daily Forecast 🔍📅
Here’s a short diagnosis of the current chart setup 🧠📈
Higher time frame order blocks have been identified — these are our patient points of interest 🎯🧭.
It’s crucial to wait for a confirmed break of structure 🧱✅ before forming a directional bias.
This keeps us disciplined and aligned with what price action is truly telling us.
📈 Risk Management Protocols
🔑 Core principles:
Max 1% risk per trade
Only execute at pre-identified levels
Use alerts, not emotion
Stick to your RR plan — minimum 1:2
🧠 You’re not paid for how many trades you take, you’re paid for how well you manage risk.
🧠 Weekly FRGNT Insight
"Trade what the market gives, not what your ego wants."
Stay mechanical. Stay focused. Let the probabilities work.
FRGNT 📊

"USD/JPY Elliott Wave Short Setup – Targeting Key Support Zone"This chart shows a potential USD/JPY short trade setup based on Elliott Wave analysis. The price appears to have completed a 5-wave upward structure, reaching resistance near 148.75–149.19. A short position is suggested with:
Entry: Around 148.75
Stop Loss: Above 149.19
Target: 146.23–145.80 support zone
The trade aims to capture a corrective move following wave (5).

An arbitrage chance: NZ Dollar goes down & JP Yen goes upDue to economies trends and currency policies, USDJPY is going down in a long term (3 to 5 years) and NZDUSD is also going down in the next 3 years
Except for trend following trade for these 2 pairs, you can also set buy limit at the bottom of a value box for NZDJPY and sell limit at the top boarder of this box. Will take good P/L and good win rate positions for this crosspairs

USDJPY SELL IDEAAfter yesterday's spiky move caused by d.trump
Market should correct some of those imbalance soon
Target at the ERL

SHORT ON USD/JPYNice CHOC (Change of Character) on USD/JPY
Followed by a retest to the supply area/zone with massive wick rejection.
I will be selling USD/JPY looking to catch over 200 pips to the next level of support/demand.

USDJPY SELLJapanese Yen adds to intraday losses; USD/JPY climbs to 148.80 amid broad-based USD strength
The Japanese Yen selling remains unabated through the early European session on Thursday, which along with a goodish pickup in the US Dollar demand, lifts the USD/JPY pair to the 148.80 region in the last hour. Data released earlier today showed that Japan clocked a smaller-than-expected trade surplus in June.
From a technical perspective, the USD/JPY pair showed some resilience below the 100-hour Simple Moving Average (SMA) on Wednesday, and the subsequent move up favors bullish traders. Moreover, oscillators are holding comfortably in positive territory and are still away from being in the overbought zone, suggesting that the path of least resistance for spot prices is to the upside. Hence, some follow-through strength back towards the 149.00 mark, en route to the overnight swing high near the 149.15-149.20 region, looks like a distinct possibility. The upward trajectory could extend further towards reclaiming the 150.00 psychological mark for the first time since late March.
On the flip side, the 148.00 round figure now seems to protect the immediate downside ahead of the Asian session low, around the 147.70 region. The latter nears the 100-hour SMA, below which the USD/JPY pair could retest sub-147.00 levels. Some follow-through selling might shift the bias in favor of bearish trades and drag spot prices to the 146.60 intermediate support en route to the 146.20 area, the 146.00 mark, and the 100-day SMA support, currently pegged near the 145.80 region\
TP 1 147.931
TP 2 147.342
TP 3 146716
RESISTANCE 149.233
USD/JPY 4-Hour Chart Analysis4-hour chart displays the price movement of the U.S. Dollar against the Japanese Yen (USD/JPY) from June to August 2025. The chart shows a significant upward trend in July, followed by a correction. Key levels are highlighted, including support at 147.031 and resistance at 150.130, with the current price at 148.809. The chart suggests a potential bullish continuation, as indicated by the upward arrow and green box, targeting higher levels above 150.000.

USD/JPY 4-Hour Forex Chart4-hour performance of the U.S. Dollar (USD) against the Japanese Yen (JPY) from late June to mid-July 2025, sourced from FOREX.com. The current exchange rate is 147.436, with a 1.178 (+0.81%) increase. Key levels include a sell price of 147.393 and a buy price of 147.479. The chart shows a recent upward trend with a resistance zone highlighted between 147.436 and 148.092, and support around 146.598. Candlestick patterns indicate volatility, with notable price movements around early July.

USDJPY LONG & SHORT – DAILY FORECAST Q3 | D15 | W29 | Y25💼 USDJPY LONG & SHORT – DAILY FORECAST
Q3 | D15 | W29 | Y25
📊 MARKET STRUCTURE SNAPSHOT
USDJPY is currently reaching for a key higher time frame supply zone, looking for price action to show weakness at premium levels. Structure and momentum are now aligning for a short opportunity backed by multi-timeframe confluence.
🔍 Confluences to Watch 📝
✅ Daily Order Block (OB)
Looking for Strong reaction and early signs of distribution.
✅ 4H Order Block
Break of internal structure (iBoS) confirms a short-term bearish transition.
✅ 1H Order Block
📈 Risk Management Protocols
🔑 Core principles:
Max 1% risk per trade
Only execute at pre-identified levels
Use alerts, not emotion
Stick to your RR plan — minimum 1:2
🧠 You’re not paid for how many trades you take, you’re paid for how well you manage risk.
🧠 Weekly FRGNT Insight
"Trade what the market gives, not what your ego wants."
Stay mechanical. Stay focused. Let the probabilities work.
🏁 Final Thoughts from FRGNT
📌 The structure is clear.
The confluences are stacked.
Let execution follow discipline, not emotion.

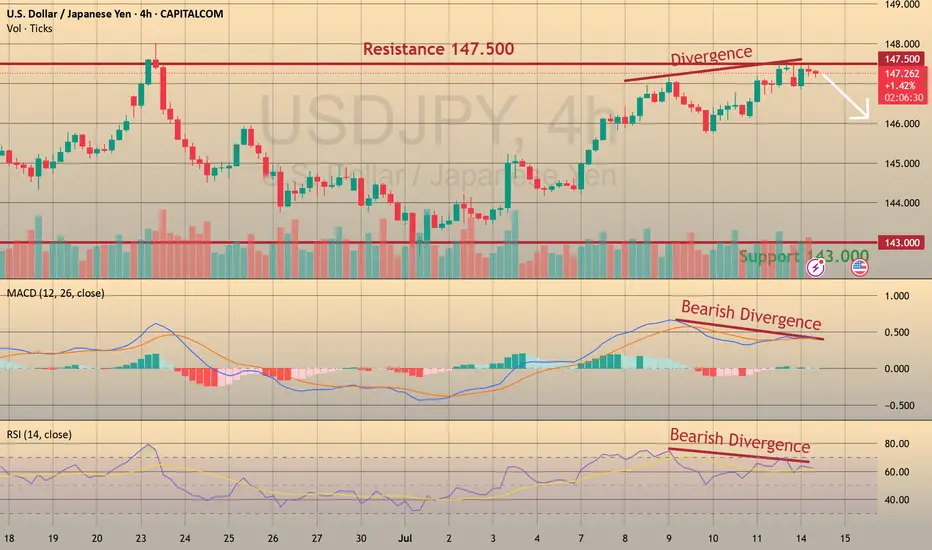
USDJPY: Bearish Divergence – Eyeing Shorts to 143 CAPITALCOM:USDJPY
We’re seeing strong bearish divergence in USDJPY near the 148 resistance zone, shifting our focus to short opportunities with a medium-term target at 142.
📈 Trading Plan:
🔻 SELL Stop: 147.040
❌ Stop Loss: 149.220
✅ Take Profit: 143.000
(Click 👉 Trade Now 👈 on your mobile to copy SL & TP easily)
🔍 Why am I short here?
✅ Technical: Clear bearish divergence on the H4 (RSI & MACD), indicating potential reversal signals.
✅ Resistance Zone: Price is testing the key 148 resistance, providing an ideal risk-reward location for shorts.
✅ Macro Event: Ahead of tomorrow’s US CPI release, a conservative trade structure is maintained to manage volatility risks.
📰 Fundamental Snapshot:
Japan’s economy shows signs of stabilization:
Core machinery orders fell only 0.6% MoM in May to ¥913.5B, much better than April’s -9.1% and forecasts of -1.5%.
Despite the headline decline, it indicates resilience in Japan’s capital spending, supporting the JPY’s medium-term outlook amid global trade and growth risks.
Trade cautiously!
USDJPY Short From Resistance!
HI,Traders !
#USDJPY keeps growing
And the pair is overbought
So after it hits the horizontal
Resistance of 148.149 from
Where we will be expecting
A local bearish correction !
Comment and subscribe to help us grow !

USD/JPY 4-Hour Chart Analysis4-hour chart for the U.S. Dollar/Japanese Yen (USD/JPY) currency pair, sourced from The chart displays the exchange rate's fluctuations over time, with key indicators and annotations

USD/JPY Made H&S Reversal Pattern , Short Setup Valid !Here is my 15 Mins Chart on USD/JPY , We have a very clear reversal pattern , head & shoulders pattern and we have a confirmation by closure below our neckline so we can enter direct now or waiting the price to go back and retest the neckline and this is my fav scenario .

USDJPY IS THE ONLY FALLING h4Price dips below 143.000 support
Attracts breakout sellers
Sharp reversal back toward resistance at 146.500+
Target zone: 147.800 – 149.000
