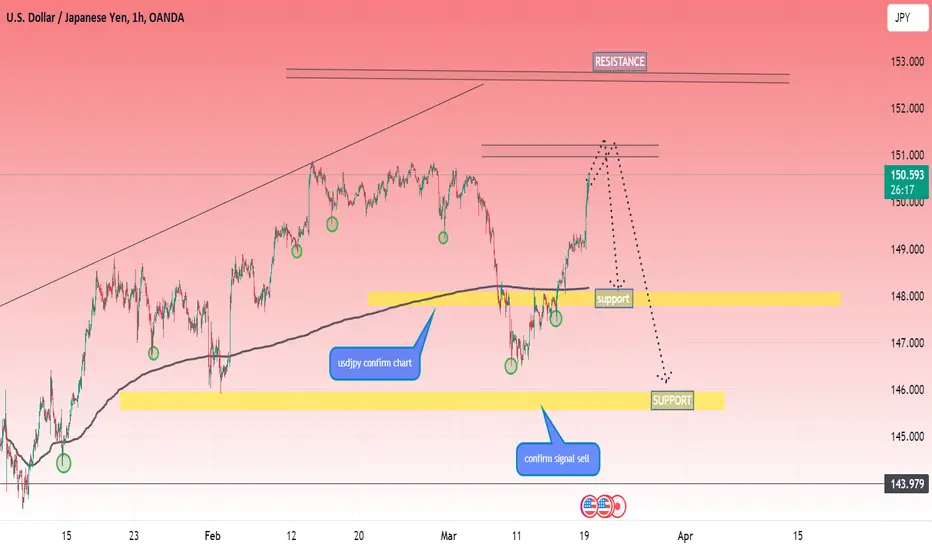
USDJPY SELL | Day Trading AnalysisHello Traders, here is the full analysis.
I think we can soon see more fall from this range! GOOD LUCK! Great SELL opportunity USDJPY
I still did my best and this is the most likely count for me at the moment.
Support the idea with like and follow my profile TO SEE MORE.
Traders, if you liked this idea or if you have your own opinion about it, write in the comments. I will be glad 🤝
Patience is the If You Have Any Question, Feel Free To Ask 🤗
Just follow chart with idea and analysis and when you are ready come in THE GROVE | VIP GROUP, earn more and safe, wait for the signal at the right moment and make money with us💰
Usdjpyshort

USD-JPY / ASCENDING TRIANGLE USD-JPY / ASCENDING TRIANGLE
For me , a breakout above 152level, open the door for the next macro resistance!

USD JPY 1HRUSD JPY 1 hour timeframe outlook.
On The one-hour timeframe, the market is currently consolidating on that resistance level, we need to see a break out to the downside and a retest to get an entry for SELL.
On the other hand, if the market breaks above the resistance level to the upside we need to see a retest of the broken resistance turn support to get a BUY entry ⏰

USD JPY TRADE SET UP USD JPY TRADE SET UP.
USD JPY has reached the daily resistance level and is showing multiple rejections and wicks on the daily timeframe, so we are looking to SELL.
We need to scale down to the lower timeframe to find patterns and confirmations to get a sell entry..

USDJPY in a quandary Although, the market seems to be accumulating sellers from the recent highs, the Hawkish tone of BOJ didn't make any significant changes in favour of JPY
I believe the market might dip toward 150 zone in the coming days although it would be very risky to short from here, use proper stop loss and trade safe.
Carpe Diem!

USDJPY I Technical and fundamental overviewWelcome back! Let me know your thoughts in the comments!
** USDJPY Analysis - Listen to video!
We recommend that you keep this pair on your watchlist and enter when the entry criteria of your strategy is met.
Please support this idea with a LIKE and COMMENT if you find it useful and Click "Follow" on our profile if you'd like these trade ideas delivered straight to your email in the future.
Thanks for your continued support!

USDJPY to breakdown?USDJPY - 24h expiry
Price action continues to be mixed and volatile for 6 days in succession resulting in spikes in both directions.
The rally was sold and the dip bought resulting in mild net losses yesterday.
Bespoke support is located at 148.96.
A Fibonacci confluence area is located at 148.95.
Rumours of intervention have resulted in a spike in volatility.
A break of 151.02 is needed to confirm follow through negative momentum.
We look to Sell a break of 151.02 (stop at 151.62)
Our profit targets will be 149.52 and 149.32
Resistance: 151.97 / 154.73 / 155.00
Support: 150.50 / 149.96 / 148.54
Risk Disclaimer
The trade ideas beyond this page are for informational purposes only and do not constitute investment advice or a solicitation to trade. This information is provided by Signal Centre, a third-party unaffiliated with OANDA, and is intended for general circulation only. OANDA does not guarantee the accuracy of this information and assumes no responsibilities for the information provided by the third party. The information does not take into account the specific investment objectives, financial situation, or particular needs of any particular person. You should take into account your specific investment objectives, financial situation, and particular needs before making a commitment to trade, including seeking advice from an independent financial adviser regarding the suitability of the investment, under a separate engagement, as you deem fit.
You accept that you assume all risks in independently viewing the contents and selecting a chosen strategy.
Where the research is distributed in Singapore to a person who is not an Accredited Investor, Expert Investor or an Institutional Investor, Oanda Asia Pacific Pte Ltd (“OAP“) accepts legal responsibility for the contents of the report to such persons only to the extent required by law. Singapore customers should contact OAP at 6579 8289 for matters arising from, or in connection with, the information/research distributed.

USDJPY - SELL SIGNALThe drop in FX volatility after last week’s action is being helped by the PBoC's stabilisation of the Yuan and should not help the Yen, which remains the most popular funding currency for carry trades.
Verbal interventions in Japan and the softer Dollar momentum are helping a bit, but the current environment suggests a recovery in JPY remains even more strictly tied to US rates breaking lower.
My call remains bearish on USD/JPY moving forward, but in the very short term, the pair may retest the 152.00+ ‘verbal intervention’ area.
Guys, what do you think? Leave a comment with your thoughts.


USDJPY: USD/JPY traded 0.1% lower at 151.29, with the pair stillThe recent weakness in the yen, which comes despite the Bank of Japan's first interest rate hike in 17 years, has prompted warnings about possible Japanese government intervention. The warnings, especially comments from Japan's top currency diplomat Masato Kanda, helped stabilize the yen.
For now, the focus is on upcoming consumer inflation data from Tokyo, due out later in the week.

usdjpy signalUSD/JPY is the forex ticker that shows the value of the US Dollar against the Japanese Yen. It tells traders how many Yen are needed to buy a US Dollar. The Dollar-Yen is one of the most traded forex pairs - second only to EUR/USD - and is a benchmark for Asian economic health and even the global economy. View the live Dollar-Yen rate with the USD/JPY chart and improve your technical and fundamental analysis with the latest USD/JPY forecast, news and analysis.
From a technical perspective, last week's swing high, around the 151.85 region, could act as an immediate hurdle. Some follow-through buying beyond the multi-decade high, around the 152.00 mark touched in November 2022, will be seen as a fresh trigger for bullish traders. The USD/JPY pair might then build on its well-established uptrend witnessed since January 2023. On the flip side, the 151.00 mark now seems to have emerged as strong support, below which spot prices could accelerate the fall to the 150.25 region. This is followed by the 150.00 psychological mark, which, if broken, will expose the next relevant support near the 149.35-149.30 region before the pair eventually drops to the 149.00 round-figure mark.

USDJPYIn the 4-hour timeframe, USD/JPY appears to be in a bullish trend, adhering to an ascending channel pattern and displaying an ABC correction. The current price action suggests a bullish pennant formation following a breakout above a resistance level. Traders may anticipate a short-term bullish movement towards the ascending channel's resistance trendline, completing the C point, before considering potential long-term bearish positions based on subsequent price action.

USD-JPY: SHORT CALL ON ONE HOUR SETUPUSD-JPY forex pair is moving in a bearish direction. This setup is designed for SHORT TRADE call at one hour setup. In this trade, retarcement of the price movement will be captured based on Fib Retaracment.

USDJPY
USD/JPY has shown a bullish trend on the daily timeframe, following an ascending trendline. However, recent price action indicates a potential reversal as it forms a triple top pattern, suggesting a shift in sentiment towards a downtrend. Traders may consider monitoring key support levels for confirmation of a reversal and adjust their trading strategies accordingly.

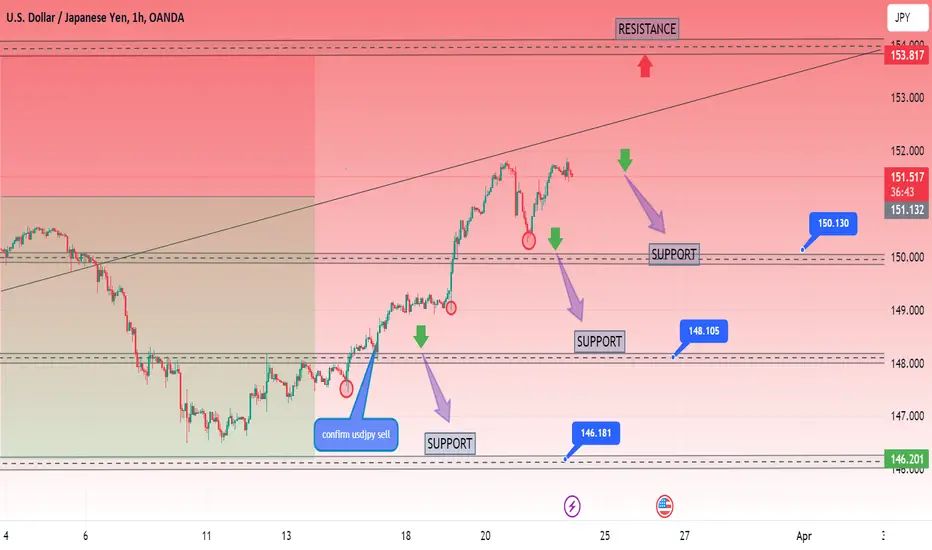
USDJPY SELL | Day Trading AnalysisHello Traders, here is the full analysis.
I think we can soon see more fall from this range! GOOD LUCK! Great SELL opportunity USDJPY
I still did my best and this is the most likely count for me at the moment.
Support the idea with like and follow my profile TO SEE MORE.
Traders, if you liked this idea or if you have your own opinion about it, write in the comments. I will be glad 🤝
Patience is the If You Have Any Question, Feel Free To Ask 🤗
Just follow chart with idea and analysis and when you are ready come in THE GROVE | VIP GROUP, earn more and safe, wait for the signal at the right moment and make money with us💰

Building The Case For The BIG Yen Reversal?? (Coming Soon)Unless you've been living under a rock the last few years you have seen the massive depreciation in the Japanese Yen against every other major currency pair in this post I'm going to share with you why I think the BIG reversal in fast approaching.
This post is much like the post I did on the CHF at the beginning of the Year where I correctly predicted a major correction (see related post) where every single CHF pair had reached key higher timeframe support levels and buy zones at the same time.
A similar story is occurring in the major JPY cross pairs also at the same time we have the BOJ finally ending negative rates and hinting of more possible rate hikes this Year whilst other central banks are talking about cutting rates with the SNB leading the race last week.
First off is the USDJPY you can see on the Monthly chart where 152 is acting as a key resistance level that goes all the way back to 1990 this is a key technical level.
Next is the GBPJPY I did a post on this last week about the likelihood of a sell off from the 193 Monthly resistance level (see image below)
Then we have the AUDJPY which the 100 mark last week which is approaching a key resistance zone @101 above this zone has seen massive corrections in the past (see image below)
Next is the NZDJPY which I done a post on several months ago showing you the importance of the 93 resistance and the likelihood of a correction from this level which the chart below shows we got a rally to here followed by a sell off.
Next is the EURJPY which last week got the break above 165 before selling off shortly back below last years high of 164 the chart below shows 2 key resistance areas here @164 and @167 where we have seen massive sell offs before.
As you can see all the major pairs are at or approaching key Monthly resistance levels and sell zones where there have been huge corrections from in the past.
To me this is a massive correlation across all the major pairs and very much indicating that a change in the tide is coming very soon. This very much is mimicking exactly what happened with the CHF pairs this year.
Will the same happen with the JPY pairs only time will tell but it's looking very good there are several ways to trade this build into sell positions across all pairs off course this can increase your risk exposure and off course swap fees or you can trade yen futures.
Off course the timing of this reversal is the hard part as it's the Monthly charts could take several months to play out or more. And then there is the possibility that I am wrong and the YEN weakens more and all these major levels get blown out at the same time :)
Let me know what you think in the comments :)

Minutes of the Bank of Japan`s January assembly - the opportunit
Minutes of the Bank of Japan's financial coverage assembly on January 22 and 23, 2024, complete textual content here:
Members agreed that they have got now no longer but reached the level in which the inflation goal may be done sustainably
Members proportion the view that the probabilities of attaining 2% inflation are increasing, so if we are able to affirm a tremendous cycle in wages and inflation, we are able to take into account finishing bad hobby charges and Unusual loosening steps
Some individuals stated the hazard of inflation exceeding the 2% goal had emerge as smaller
One member stated if a ruling on finishing bad hobby charges is delayed, it'd prevent efforts to attain the 2% goal and referred to as for a fast tightening.
One member stated now's a once-in-a-lifetime possibility to extrade financial coverage
One member stated the scope for financial coverage flexibility might be decrease for Japan as different nations pass to reduce hobby charges.
Some individuals trust that they have to forestall shopping for ETFs and JREITs if they could attain the inflation goal
Some individuals stated the BOJ isn't below stress to hurry up hobby fee will increase like in Western nations.

USDJPY possible double top#usdjpy price testing resistance level 151.70-90 which is high level of last year 2023. price need energy to fall down side for 148.90 & 148.00. time requires in building energy. suspect price will hold the resistance level to make double top. stop loss above the resistance level as 152.10, entry level 151.25 & 151.75. target: 148.90.

UsdJpy sellUSD/JPY is the forex ticker that shows the value of the US Dollar against the Japanese Yen. It tells traders how many Yen are needed to buy a US Dollar. The Dollar-Yen is one of the most traded forex pairs - second only to EUR/USD - and is a benchmark for Asian economic health and even the global economy. View the live Dollar-Yen rate with the USD/JPY chart and improve your technical and fundamental analysis with the latest USD/JPY forecast, news and analysis.
The Japanese Yen edges higher following the release of Japanese consumer inflation data. The uncertainty over the BoJ’s future policy steps keeps a lid on any further positive move. A modest US Dollar downtick exerts some pressure, though the downside remains limited.
The USD/JPY pair finds support after correcting to near 150.27 in the European session on Thursday. The asset rebounds as the US Dollar recovers after refreshing a five-day low. The US Dollar Index (DXY) bounces back from 103.17 as the Federal Reserve’s (Fed) latest economic projections showed that the United States growth rate for 2024 was revised higher to 2.1% from 1.4% forecasted in December’s policy meeting.
USDJPY: First Entry dropped 400 pips, Focusing on ReentryDear Traders,
OANDA:USDJPY first entry dropped successfully 400 pips, now there is possibility of price filling up the liquidity and dropping from that region. Bullish price will likely to push the price up to our area of entry where price will fall strongly. Use accurate stop loss and take profit as described in our chart, if you have any doubt or finding it hard to understand something, please leave a comment.
good luck and trade safe as always

USDJPY 15 / Potential Breakout / Bullish JPY Basket?Hello Traders!
This is my idea related to USdJPy M15. I expect to see a breakout of the bullish channel as I see the JPY Basket for a potential bullish move. If confirmed, I will execute this trade.
Please LIKE 👍, FOLLOW ✅, SHARE 🙌, and COMMENT ✍ if you enjoy this idea! Also, share your ideas and charts in the comments section below! This is the best way to keep it relevant, support us, keep the content here free, and allow the idea to reach as many people as possible.
____________________________________
www.tradingview.com

USDJPY I FOMC analysis and forecast Welcome back! Let me know your thoughts in the comments!
** USDJPY Analysis - Listen to video!
We recommend that you keep this pair on your watchlist and enter when the entry criteria of your strategy is met.
Please support this idea with a LIKE and COMMENT if you find it useful and Click "Follow" on our profile if you'd like these trade ideas delivered straight to your email in the future.
Thanks for your continued support!

usd jpy shortUSD/JPY is the forex ticker that shows the value of the US Dollar against the Japanese Yen. It tells traders how many Yen are needed to buy a US Dollar. The Dollar-Yen is one of the most traded forex pairs – second only to EUR/USD – and is a benchmark for Asian economic health and even the global economy. View the live Dollar-Yen rate with the USD/JPY chart and improve your technical and fundamental analysis with the latest USD/JPY forecast, news and analysis.
USD/JPY is the forex ticker that shows the value of the US Dollar against the Japanese Yen. It tells traders how many Yen are needed to buy a US Dollar. The Dollar-Yen is one of the most traded forex pairs – second only to EUR/USD – and is a benchmark for Asian economic health and even the global economy. View the live Dollar-Yen rate with the USD/JPY chart and improve your technical and fundamental analysis with the latest USD/JPY forecast, news and analysis.
The USD/JPY pair exhibits strength above the crucial support of 149.00 in the early New York session. The asset clings to gains as market expectations for the Bank of Japan (BoJ) delaying its plans to exit negative interest rates and scrap Yield Curve Control (YCC) have escalated.