Forex Bee | Possible short On USDJPYAttention Traders! 🚨 We're keeping a close watch on USDJPY for a potential selling opportunity within the 150.30-150.60 zone.
🎯 USDJPY in a correction phase, approaching the retrace area near 150.30-150.60
#TradingAlert #usdjpy #technicalanalysis
Usdjpyshort

USDJPY 18/03Pair : USDJPY ( U.S Dollar / Japanese Yen )
Description :
Completed " 123 " Impulsive Waves
RSI - Divergence
Break of Structure
Fibonacci Level - 261.8%
Bullish Channel as an Corrective Pattern in Short Time Frame

USDJPY I BOJ will possibly end negative interest ratesWelcome back! Let me know your thoughts in the comments!
** USDJPY Analysis - Listen to video!
We recommend that you keep this pair on your watchlist and enter when the entry criteria of your strategy is met.
Please support this idea with a LIKE and COMMENT if you find it useful and Click "Follow" on our profile if you'd like these trade ideas delivered straight to your email in the future.
Thanks for your continued support!

USDJPY bearish move will start**Monthly Chart**
USDJPY broke the high of August 1998 and moved higher in Oct 2022 which created a new swing high at around 150 level before drifting lower. This created a new strong level since then and the price was unable to break above it. Additionally, the price created a new MC in Nov 2023 and the price moved towards it and currently testing it.
**Weekly Chart**
This week I like to see USDJPY break the high one more time or at least test the high at around 149.50 level and provide a reversal indication to see it for around 800 pips Target. The move is going to be aggressive after BOJ news on Tuesday 19th March. This is the same for all JPY pairs.
**Daily Chart**
Last week we had a good buying opportunity after the close of the key daily reversal (Ring Low formation) then the price continued higher. This week, I will be looking to sell this pair only and other JPY pairs after BOJ news on Tuesday if the market provides it. My two scenarios are shown in the chart.

USDJPY-4h#USDJPY
The price came out of that 4h trend, but we don't have a LL on 1D, which made the price pump from the support of 145, at this moment the week closed with a resistance rejection . on 4h, respectively of the former trend line, on Tuesday morning we have the BOJ R-interest.

USDJPY USD/JPY is the forex ticker that shows the value of the US Dollar against the Japanese Yen. It tells traders how many Yen are needed to buy a US Dollar. The Dollar-Yen is one of the most traded forex pairs – second only to EUR/USD – and is a benchmark for Asian economic health and even the global economy. View the live Dollar-Yen rate with the USD/JPY chart and improve your technical and fundamental analysis with the latest USD/JPY forecast, news and analysis
Japanese Yen bears look to seize control, flirt with 148.00 ahead of US macro data
From a technical perspective, the USD/JPY pair has been showing some resilience below the 38.2% Fibonacci retracement level of the December-February rally. The subsequent move up, however, struggled to find acceptance above the 100-day Simple Moving Average (SMA) and faltered ahead of the 23.6% Fibo. level. Moreover, oscillators on the daily chart are still holding deep in the negative territory and are still away from being in the oversold zone, suggesting that the path of least resistance for spot prices is to the downside confirm

USDJPY Short setupUSDJPY Looks good to add more to my shorts. I am waiting the price to reach the resistance area at 148.400, where i expect it to start drop again. I think we will see new lows this week or at the beginning of the next week.

USDJPY:750+ PIPS SETUP!!Expecting JPY to reverse and stay bullish; as the price of the UJ have been overbought, in this strong bullish impulse if price drops it would drop heavily most of the time.
Let's wait and see how price react at our designated selling zone.

USDJPY
In the 4-hour timeframe, USD/JPY is displaying a bearish bias, evident by a breakout from consolidations on the downside. Traders might seek to enter selling positions after a correction, typically ranging from 61% to 78%, has been completed, anticipating further downward movement. Monitoring for confirmation of the correction's end could help in timing entry points more effectively amidst the prevailing bearish sentiment.

USDJPY USD/JPY is the forex ticker that shows the value of the US Dollar against the Japanese Yen. It tells traders how many Yen are needed to buy a US Dollar. The Dollar-Yen is one of the most traded forex pairs – second only to EUR/USD – and is a benchmark for Asian economic health and even the global economy. View the live Dollar-Yen rate with the USD/JPY chart and improve your technical and fundamental analysis with the latest USD/JPY forecast, news and analysis.
USD/JPY Sinks on Bets BoJ Will End Negative Rates Soon, US Inflation in Focus
comfirm signal

USDJPY: Has bears taken over UJ?Dear Traders,
FX:USDJPY reached the maximum bullish exhaustion point, currently the consolidation phase is going on expecting huge volume coming on tomorrow. Sellers will likely to dominate in this month as corrections on all JPY pairs will begin in soon time. Meanwhile, We will be focusing on targeting the ‘target one’ and then we will update the chart idea to alert you all. Focus on keeping the stop loss around 100-120 pips max since it is swing entry stop loss will be greater and so the take profit; overall we are targeting 700 pips.
Good luck and trade safe!

short on USDJPYshort position on USDJPY, scouted to be turning towards bearish, break of support did not find uptick, R:R 2.62. please note this is a historic trade and does not predict future performance.

USD JPY SHORTS Looking for a pull back and rejection with a 4h close from 147.618 and ten a lower low close on the 30m to look for shorts

USDJPY big picture in daily time frame USDJPY: On the daily time frame, after hitting the middle line of the horizontal white channel, it cannot return to its upward purple channel. Therefore, it can hunt for twin ceiling after collecting liquidity. If it turns, it will most likely lose its last support and enter a long-term downtrend

usdjpy has formed a twin ceilingIn the daily time frame, usdjpy could not break its previous ceiling and weakness in the power of buyers is observed. In the weekly time frame, the price is in the range of the ceiling of the descending channel and the ceiling of the ascending cycle, and it seems that we will see a correction in the weekly candles: either a large correction after collecting liquidity above the twin ceiling or a retest to the ceiling of the broken channel and then movement to 176.

USD/JPY: Will External Liquidity Drain Trigger a Yen Surge?
The USD/JPY pair has been on a tear lately, but a potential shift in global liquidity conditions could throw a wrench into the rally.
The Story: Recent economic data and central bank policy stances have favored the US dollar, pushing the pair higher. However, concerns are rising that external liquidity, or the flow of funds from overseas investors, might be drying up.
Why it Matters: External liquidity has been a key driver of the USD/JPY appreciation. If this support weakens, it could lead to a reversal of fortunes for the pair, potentially propelling the Japanese Yen higher.
Factors to Watch:
Global risk sentiment: Rising geopolitical tensions or economic uncertainties could trigger a flight to safe havens, like the Yen.
US Federal Reserve policy: The Fed's stance on future interest rate hikes will continue to influence the relative attractiveness of the dollar.
Japan's economic performance: If Japan's economy shows signs of improvement, it could boost confidence in the Yen.
The Trade: This is not a trade recommendation, but the potential for a USD/JPY reversal due to shifting liquidity conditions is a developing story worth watching.
Stay tuned: As the situation unfolds, keep an eye on these factors to see if they translate into a Yen comeback against the US dollar.
usdjpy sell USD/JPY is the forex ticker that shows the value of the US Dollar against the Japanese Yen. It tells traders how many Yen are needed to buy a US Dollar. The Dollar-Yen is one of the most traded forex pairs – second only to EUR/USD – and is a benchmark for Asian economic health and even the global economy. View the live Dollar-Yen rate with the USD/JPY chart and improve your technical and fundamental analysis with the latest USD/JPY forecast, news and analysis.
Although Powell's remarks leaned towards the hawkish side, they were nothing new: they merely echoed the sentiment expressed in the previous central bank meeting. In this context, traders took today’s developments as “no news is good news”, giving little incentive to yields and greenback’s bulls to charge.

USDJPY SELL USD/JPY: Japanese Yen remains confined in a multi-week-old trading band against USDThe Japanese Yen struggles to capitalize on Tuesday’s Tokyo CPI-inspired gains. The BoJ policy uncertainty is holding back the JPY bulls from placing fresh bets. Subdued USD price action caps USD/JPY ahead of US data, Powell’s testimony.The USD/JPY pair falls sharply to the psychological support of 150.00 in early American session on Tuesday as hopes of Bank of Japan (BoJ) quitting the decade-long expansionary policy stance have escalated.USD/JPY is the forex ticker that shows the value of the US Dollar against the Japanese Yen. It tells traders how many Yen are needed to buy a US Dollar. The Dollar-Yen is one of the most traded forex pairs – second only to EUR/USD – and is a benchmark for Asian economic health and even the global economy. View the live Dollar-Yen rate with the USD/JPY chart and improve your technical and fundamental analysis with the latest USD/JPY forecast, news and analysis CONFIRM SIGNAL


USDJPY SELL CONFIRM SIGNAL USD/JPY tumbles to 150.00 as prospects of BoJ exiting dovish policy stance deepensUSD/JPY slumps to 150.00, hoping the BoJ will exit the dovish policy stance sooner. Japan’s Murai is optimist on a positive cycle of rising growth, improving wage outlook. Fed Powell is expected to maintain a hawkish narrative on interest rates.The USD/JPY pair falls sharply to the psychological support of 150.00 in early American session on Tuesday as hopes of Bank of Japan (BoJ) quitting the decade-long expansionary policy stance have escalated.USD/JPY is the forex ticker that shows the value of the US Dollar against the Japanese Yen. It tells traders how many Yen are needed to buy a US Dollar. The Dollar-Yen is one of the most traded forex pairs – second only to EUR/USD – and is a benchmark for Asian economic health and even the global economy. View the live Dollar-Yen rate with the USD/JPY chart and improve your technical and fundamental analysis with the latest USD/JPY forecast, news and analysis CONFIRM

The BIG SHORT USDJPY This is a counter trend but here is why we are selling.
Trend:
W1: Up
D1: Up
H4: Flat
Moving Average:
Above the Daily MA
H4 pointing downwards
Pattern:
Shark on Daily
Strong resistance at 151.50
Double top on Daily and lots of divergence


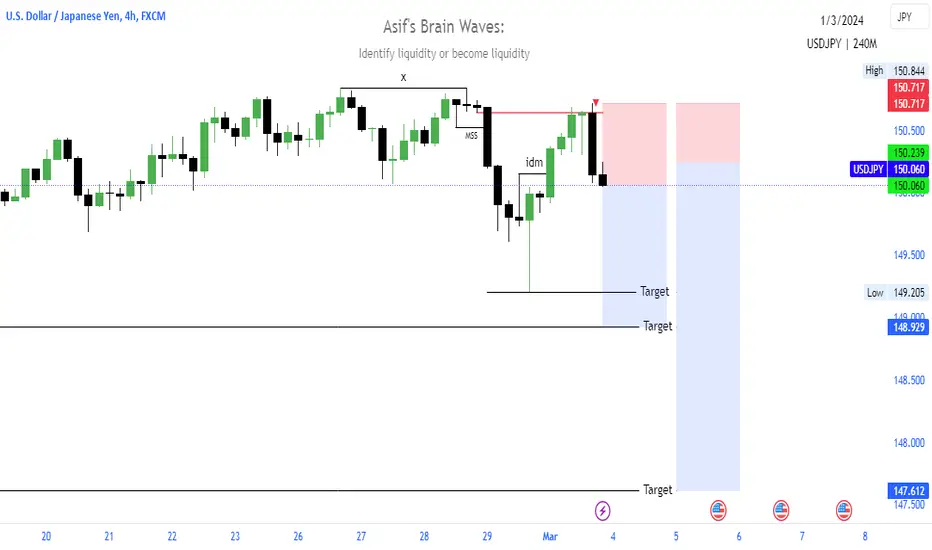
USDJPY H4 4 March 2024USD/JPY, H4
USD/JPY experiences uncertainty due to mixed monetary policy statements from Bank of Japan
members. While Hajime Takata signals a potential exit from ultra-loose policy with the inflation
target in sight, Governor Kazuo Ueda provides a contradictory view, emphasising the need for
confirmation in a positive wage-inflation cycle. This mixed sentiment continues to fuel uncertainty for the USD/JPY pair.
USD/JPY is trading lower following the prior retracement from the resistance level. Suggesting the pair might extend its losses since the RSI stays below the midline.
Resistance level: 150.80, 151.70
Support level: 149.40, 147.60
