Sontrader - SELL USDJPYEntry : 148.184
SL : 148.6
TP : 144.750
RRR : 1/5.5
Every trade has risk!! So please set SL with your own caution and always follow my orders at Tradingview !!
Support Broker with me in the Bio section
Usdjpyshort

USDJPY Long Term SELLING Trading IdeaHello Traders
In This Chart USDJPY DAILY Forex Forecast By FOREX PLANET
today USDJPY analysis 👆
🟢This Chart includes_ (USDJPY market update)
🟢What is The Next Opportunity on USDJPY Market
🟢how to Enter to the Valid Entry With Assurance Profit
This CHART is For Trader's that Want to Improve Their Technical Analysis Skills and Their Trading By Understanding How To Analyze The Market Using Multiple Timeframes and Understanding The Bigger Picture on the Charts

USDJPY highest height Analysis ↗️ ↘️Hello Everyone 🙋🏽♂️
As we could see at the end of the descending channel,
we had a highest height breakout after that we have 2 scenarios after the price will bounce that zone or we could see double bottom before a bearish market will start or the price will break the zone 152 and a bull market will continue .
my most forecasting scenario is the double top with a descending channel
I will share with you everything new.
We are not responsible of any losses for anyone, our trades are profitable more for long terms and we take losses as everyone,
manage your lot size as well and your SL and TP
Don't forget to hit the like bottom and write a comment to support us.
Follow us for more 🙋🏻♂️
Best Regard / EMA Trading .
Disclaimer:
----------------
It's not a financial advise, As everyone we take losses sometime but for long term trading we are profitable traders, so manage your account well with SL and TP and your lot size to keep your account safe and stay in the market .

USDJPY I Weekly Forecast & Technical OverviewWelcome back! Let me know your thoughts in the comments!
** USDJPY Analysis - Listen to video!
We recommend that you keep this pair on your watchlist and enter when the entry criteria of your strategy is met.
Please support this idea with a LIKE and COMMENT if you find it useful and Click "Follow" on our profile if you'd like these trade ideas delivered straight to your email in the future.
Thanks for your continued support!

USDJPY 4H (Pivot Price:149.05)USDJPY
stabilizing above 149.05 will support rising to touch 149.62 then 150.08 then 150.60
stabilizing under 149.05will support falling to touch 148.41 and then 147.85
Pivot Price:149.05
Resistance prices: 149.62 & 150.08 & 150.60
Support prices: 148.41& 147.85 & 147.05
timeframe:4H

USDJPY Looking beautiful.As you can see RSI making huge divergence in 1W TF and most likely to retest previous high which is around 152. It can go higher but if candles are able to close below 152 it is most likely to go down till 127-125 area.

USDJPY 1D OUTLOOK USDJPY
Analyze
If a price can stable above 148.73 the direction will be uptrend again to reach 150.28 , 152.03 , 153.89
For any reason if the price backs off and stable under 148.73 , the price will try to reach 147.62 If can break it then will reach 146.19 and 1143.45
Support line:147.62,146.19 ,143.45
resistance line: 150.28,152.03 ,153.89

usd jpy good retest to buyHello, according to my analysis of USDJPY, there is a very good buying opportunity. We now notice a retest of the strong support at 137500. With a very positive green candle on the daily chart. The 200 moving average is also in the same area. This is evidence of the power of buyers at this level. good luck for everbody

USDJPY Long Term SELLING Trading IdeaHello Traders
In This Chart USDJPY DAILY Forex Forecast By FOREX PLANET
today USDJPY analysis 👆
🟢This Chart includes_ (USDJPY market update)
🟢What is The Next Opportunity on USDJPY Market
🟢how to Enter to the Valid Entry With Assurance Profit
This CHART is For Trader's that Want to Improve Their Technical Analysis Skills and Their Trading By Understanding How To Analyze The Market Using Multiple Timeframes and Understanding The Bigger Picture on the Charts
USD/JPY with plan trading week : 25.09 - 29.09.2023H4 frame - we can see that UJ is following an uptrend.
However, recently there have been signs of light selling - a normal occurrence when encountering resistance zones.
Trading plan, watch SELL at 150.7
If Buy, wait for the signal at area: 146.6
Currently, UJ is in the middle zone, so we encourage followers to wait for good signals

SELL USDJPY H4 WedgeUSD/JPY - H4 Chart - Rising Wedge Pattern formation
Price need to Break the Trendline and Retest wedge Pattern and
after strong Reversal formation, we take entry.
Always wait for strong Conformation in Short term for entry. 👈👈👈
If you found my post helpful or informative, could you please leave a comment 💬🖌 and hitting that like button💚💚
“Markets are never wrong, but opinions often are.”-Jesse Livermore
Good Luck💛💛

USDJPY📊 #USDJPY
⏱ TIME:1month
📝It is reaching very important areas for spot purchases, and you can make purchases in a gradual and managed manner.
📍The initial sell limit:160.340 $
⭕️type: Swing Trade

USDJPY📊 #USDJPY
⏱ TIME:1day
📝It is reaching very important areas for spot purchases, and you can make purchases in a gradual and managed manner.
📍The initial sell limit:150.128 $
⭕️type: Swing Trade

USDJPY Potential Selling Opportunity Sell Description:
Pair: USDJPY
SL: 20 - 30 pips
TP: 80-100 pips
We have identified a potential selling opportunity in pair. The price has shown signs of bearish momentum and is currently trading below key resistance levels.
Our entry point for this trade is is Shown in Picture, with a stop loss (SL) set at . This provides a risk-reward ratio of approximately 1:3,4 ensuring a favorable risk management strategy.
Our take profit (TP) target is set at mentioned Area on the chart, aiming for a potential gain of 80 to 100 pips. This level aligns with previous support and offers a high probability of price reversal or further downward movement.Please note that trading involves risks, and it is essential to manage your positions carefully. Always adjust your position size according to your risk tolerance and ensure you have a clear understanding of the market conditions before entering any trades.

Best level to sell USD/JPY (+700 Pips, Entry, TP and SL)Hello traders! USD/JPY is on a continuous uptrend. However, price
might reach a strong resistance level from where it could
reverse. With BOJ rate event scheduled for tomorrow, this scenario
might play out.
📌The area 151.50-152 is a strong rejection zone. Currently, there is
not much resistance between 148 and 152.
📌The area 152 also happens to be at the top of the price channel
that you can see in my chart.
📌During the BOJ rate event, if price spikes to the 152 zone, I would
consider selling USDJPY@151.70-152.20 with SL above 153 and swing
TP at 143.50

USDJPY 4H (Pivot Price:147.76)USDJPY
if it falls above148.73 in this direction will rise to 149.48 then 150.38 then 151.77
but if it is below 147.76 the direction will go down 147.28 ,146.39 then 145.72
Pivot Price:147.76
Resistance prices:149.73 & 150.38 & 151.77
Support prices:147.28 & 146.39 & 145.73
timeframe: 4H

USD/JPY Short Opportunity - September Market structure was clean, clean traffic to the left. Every rule / confluence was met - great RR and great RT to EMA on HTF and entered TF - however took a chance on price action as the entered bearish engulf was 50% body & wick.....then trade is invalid !!

USDJPY SHORT OUTLOOKHello Traders, this is outlook that i think might be work. All Entry, Stop Loss, and Take Profit its already showed up. All trade it is on yourself. NFA.

"USDJPY: Watching 148.80 for Reversal"The USDJPY currency pair is currently on an upward trajectory, approaching the key resistance level at 148.80. It's worth noting that in October of the previous year, the price experienced a significant downturn from this same level. Given this historical context, there is a reasonable expectation that a similar price reversal may occur this time as well.
Should the daily candle manage to close above the critical resistance point at 148.80, it could potentially signal a further bullish extension towards the next target at 150.10. However, our strategy entails a bearish outlook. We plan to initiate a sell position at 150.10, with a target set at 145.55. This target aligns with the trend line support, which suggests a potential bearish move in the market, mirroring the historical precedent of price declines from the 148.80 level.
🔥1st Sell Entry - 148.80
🔥2nd Sell Entry - 150.10
👇TP - 145.50
🔴SL - Join Our Channel

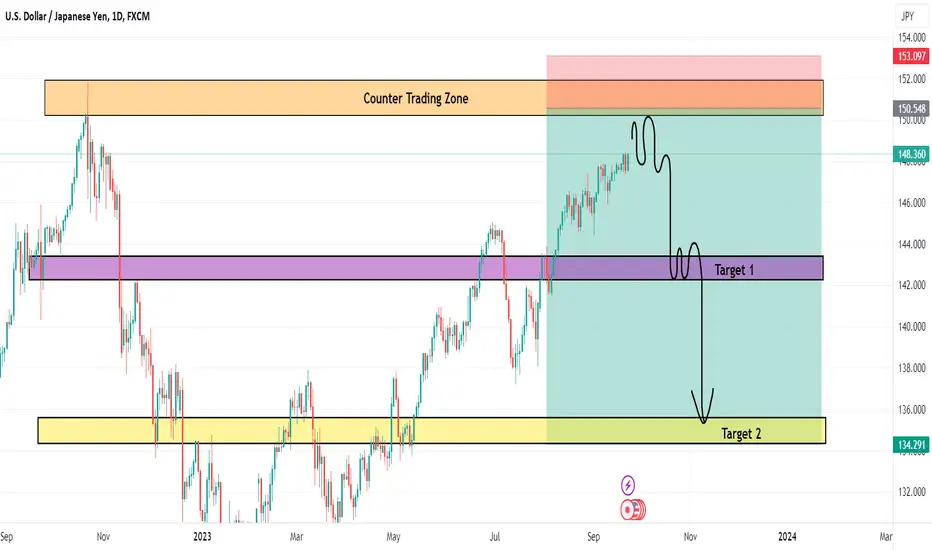
USD/JPY Weekly Analysis - Potential SellWelcome to our weekly USD/JPY analysis on TradingView! In this post, we'll provide you with a comprehensive overview of the USD/JPY currency pair's current situation. It's currently trading within a channel, and we'll also discuss the possibility of a double top formation. Let's dive into the analysis!
📈 Key Weekly Analysis Points:
Inside the Channel: Explore the implications of USD/JPY trading within the channel and its potential impact on future price movements.
Double Top Potential: Discuss the formation of a potential double top pattern and its significance for traders.
Support and Resistance: Analyze the crucial support and resistance levels within the channel and their importance.
Trade Strategies: Discover potential trading strategies for a scenario involving both a channel and a double top pattern.
If you're a trader or investor interested in USD/JPY, this post offers valuable insights to help you navigate the markets effectively on TradingView.
Please remember to follow us for regular updates and analysis. Feel free to share your thoughts and questions in the comments section below. Your feedback and interaction are highly appreciated!
Disclaimer: This analysis is for educational purposes only and should not be considered as financial advice. Always conduct your research and consult with a financial advisor before making any trading decisions. Trading involves risks, and it's crucial to manage them wisely.

USD/JPY at PRZ, may fall 100 pips from hereHello everyone! There was an attempt to break the 147.85 resistance
level. However, we might have witnessed a fake break on Friday and price
is currently back below the resistance zone.
📌At present, USD/JPY is below the 147.85 resistance level.
📌 In the 4Hour chart, if price continues to stay below the key resistance
level, we can see a pullback of 100 pips or more
📌Traders can consider selling USD/JPY@147.70-147.90 with SL above 148
and initial TP at 146.70

A SELL TRADE SETUP ON USDJPYHI Traders,
USD/JPY's bullish rally seems to be running out of steams and bullish momentum is beginning to the weakened down showing some downside preparation.
📌 Currently, the price is forming up a bullish wedge pattern
in the 8H chart of usd/JPY.
📌 The price is showing a very prolonged Divergence taking note of the RSI indicator revealing LL and LH when the price is technically showing HH and HL.
📌 Though the price is yet to break below the 2weeks bullish trendline, but it is most likely going to break before the end if the week.
📌 Technically, a break below the wedge lower band the market could start a new bearish momentum.
📌 Stay on a watchout.

USDJPY SHORT OUTLOOKHello Traders, this is outlook that i think might be work. All Entry, Stop Loss, and Take Profit its already showed up. All trade it is on yourself. NFA.
