USD/JPY's 30-Minute Support and ResistanceIn the intricate realm of forex trading, precision guides every move. Every level, and every fluctuation holds profound significance. Let's delve into the technical intricacies shaping the journey of the USD/JPY pair within the 30-minute timeframe.
Steadying the Path: Dual Support Levels
In the heart of these crucial moments, USD/JPY establishes its path with the presence of two distinct support levels:
Primary Support - 145.722: This forms the primary anchor for the pair, laying the groundwork for potential rebounds and recoveries.
Secondary Support - 146.273: A supplementary layer of support in case the pair faces heightened downward pressure, bolstering its capacity to resist further descent.
Overcoming Barriers: Resistance Comes to Light
However, the journey forward is characterized by barriers. The pair faces a single resistance point that stands as a formidable hurdle, demanding a determined push to surmount:
Resistance 1 at 146.631: This pivotal juncture marks the principal challenge for USD/JPY's upward advance. A successful breach could signal a shift in the underlying market sentiment, possibly opening avenues for further ascension.
Guiding Strategy: Plotting the Trajectory
For traders and astute observers, the interplay between USD/JPY and these support and resistance levels is a treasure trove of insights. Each movement, every shift, holds key clues about the evolving market sentiment.
The dual supports at 145.722 and 146.273 serve as a strong foundation, providing opportunities for potential recoveries. Yet, the obstacle presented by the resistance at 146.631 underscores the necessity of a concerted effort to propel the pair upward.
As time ticks within this 30-minute window, the movements of USD/JPY unfold like an engaging narrative. The interplay between support and resistance, between the aspirations of buyers and the strategies of sellers, crafts a dynamic storyline that traders closely follow, seeking to unravel the near-term trajectory of this captivating currency pair.
Usdjpyshort

USD-JPY / DAILYUSD its strong with a DXY in uptrend with new H-Highs ,and the 147.2 are its the half of the last cycle liquidity so, lets see what the price will do.

usdjpy selling opportunity usdjpyafter impulse and corection its near to selling zone wait for the confirmation on given area and go for it

USDJPY | Perspective for the new week | Follow-upThe USDJPY landscape is a complex interplay of monetary policy divergence between the US and Japan, actively influencing the Yen's weakening. Yet, optimism surrounding the peak of US interest rates introduces an intriguing caveat to the Greenback's ascent. Federal Reserve minutes unveiled this week emphasize a consensus among committee members about "significant upside risks to inflation", amplifying the allure of further tightening.
Amid robust economic data – particularly retail sales – a compelling case for heightened tightening unfolds. Meanwhile, market participants exercise caution, mindful of potential FX intervention by the Bank of Japan (BoJ), evoking memories of last year's intervention triggered by similar price action levels.
The yen's depreciation heightens vigilance, with traders poised for possible Japanese authority intervention. As attention shifts to Jackson Hole, Wyoming, where top central banks gather annually, all eyes are on Fed Chair Jerome Powell's upcoming speech. Anticipated next Friday, Powell's address is a golden opportunity for insights into the interest rate outlook, potentially laying the groundwork for the Fed's next policy steps.
USDJPY Technical Analysis:
In this video, we conduct an in-depth technical analysis of the USDJPY chart, carefully examining the current market structure. Our primary focus is still within the key zone of 145.000, which will serve as our center of focus ahead of the upcoming week. As price action remains within this zone, it becomes an area of interest that has led to choppy consolidation before a clear direction emerges. The market's reaction around this area at the beginning of the new week will heavily influence the trajectory of price action in the days to come.
Join me on this journey as we explore potential trading opportunities using trendlines, key levels, and chart patterns. Be sure to stay connected to my channel, follow my updates, and actively engage in the comment section as we navigate the dynamic USDJPY market together.
Wishing you the best of luck as you chart your course in the USDJPY market this week.
Disclaimer Notice:
Please be aware that margin trading in the foreign exchange market, including commodity trading, CFDs, stocks, and other instruments, carries a high level of risk and may not be suitable for all investors. The content of this speculative material, including all data, is provided by me for educational purposes only and to assist in making independent investment decisions. All information presented here is for reference purposes only, and I do not assume any responsibility for its accuracy.
It is important that you carefully evaluate your investment experience, financial situation, investment objectives, and risk tolerance level. Before making any investment, it is advisable to consult with your independent financial advisor to assess the suitability of your circumstances.
Please note that I cannot guarantee the accuracy of the information provided, and I am not liable for any loss or damage that may directly or indirectly result from the content or the receipt of any instructions or notifications associated with it.
Remember that past performance is not necessarily indicative of future results. Keep this in mind while considering any investment opportunities.

triple trendline before fedfirst it made rising wedge pattern
now it is making triple top trendline
it all depends on fed and boj
if it breakout to upside then buy retest target 150
or sell third retest of trend near big daily resistance near 145

USDJPY IdeaHere we can see USDJPY is making continuous HHs and now at the stage of high resistance zone + we can see bearish divergence. Hopefully, we will reject these resistance levels and start to be bearish.

"USDJPY: Bearish Momentum Gaining Ground 📉🐻""Deciphering USDJPY's Bearish Move: Insights from Smart Money on H4 📉🐻
Unlocking the intentions of the smart money players, a meticulous analysis of USDJPY's H4 timeframe reveals a compelling story of bearish momentum gaining strength.
📊 **Smart Money Blueprint**: The high time frame (H4) serves as our canvas to interpret the movements of institutional players. A bearish structure is unmistakably emerging, reflecting the strategic decisions of those who influence larger market movements.
📉 **Gradual Descent**: The H4 chart showcases a series of lower highs and lower lows, characteristic of a bearish trend. This meticulous pattern speaks volumes about the deliberation behind each price movement, hinting at a concerted effort to drive prices downward.
📈 **Trading Opportunity**: Armed with these insights, traders are positioning themselves for potential bearish trades. The identification of key resistance-turned-support levels becomes crucial as the price tests these critical zones.
💡 **Smart Money Wisdom**: It's not just about spotting patterns; it's about deciphering the intentions of institutional investors. The bearish structure on H4 signifies a calculated move, possibly tied to broader market sentiments.
🚧 **Risk Reminder**: Trading carries inherent risks. This analysis serves as educational information and isn't financial advice. Always conduct your research and consider seeking professional guidance before making trading decisions.
As we navigate the USDJPY landscape, the bearish undertones on the H4 timeframe offer a glimpse into the minds of the smart money players. 📉🐻 #SmartMoneyInsights #USDJPYAnalysis"

USDJPY Local Short! USD-JPY broke the key
Horizontal level then went
Up to retest the new
Resistance of 145.006 from
Where I think we will see
A local bearish pullback !

USDJPY - SHORTPrice reached the fib levels between 61.8 and 78.6 reaching the OB that created change of character after the FVG. Great area to short.

Bearish control...Seems like bearish market can control USDJPY again.
There is no intervention by BOJ yet, but, selling yen in this levels is so dangerous.
Trade safe.
Good luck.

USD JPY SHORTRisk 0.5%
TP1 = 1:1.5 RR
Disclaimer:
The contents in this Idea are intended for information purpose only and do not constitute investment recommendation or advice. Nor are they used to promote any specific products or services. They serve as an integral part of a case study to demonstrate fundamental concepts in risk management under given market scenarios. A full version of the disclaimer is available in our profile description.


Usdjpy : potential sell zoneTraders:
We monitor price in usdjpy for a possible sell set up.
- best possible sell point :146.80
- stop loss : 146.98
Target 146
As always we need confirm.
Use stop loss to keep your capital safe.
Good luck

USDJPY: ATTAINING NEW HEIGHTS?According to TradingView news, th exchange rate is looking into a fairly calm day with no major economic news scheduled ahead.
A possible bearish shift is at the door; knocking using a trend patter.
Comment what you see

USDJPY possible short for 145.0517th August daily key reversal bar indication for weakness ahead. use low risk, reversal trade need patience & discipline. supply zone 146.30-60, target: 145.05. stop loss above 146.60 i.e. 147.00.

(USDJPY) : Great opportunity to SELLHello guys, I hope you're all doing well. The main reason that convinced me to go for a short position is that the USDJPY respects 146.5 resistance level (in my opinion) and I think it will fall all the way down to 141.699. But keep in mind that if USDJPY breaks the resistance, it must reach 150.1.
May you all be PROFITABLE,

USDJPY Swing Breakout!USD-JPY was trading along
The rising support line
But now we are seeing a
A powerful breakout so
We are now bearish biased
And I think that we will see
A further move down !

USDJPY Possible Reversal
OANDA:USDJPY has been on an uptrend for the past few weeks, but a Head and Shoulder pattern has been detected on the 1-hour chart.
Additionally, inflation in the US is decreasing, which could potentially impact the USDJPY pair.
If the Head and Shoulder pattern breaks below the resistance zone of 145.0 - 144.9, there is a possibility that the price could continue to move downward.

USDJPY - Long after filling the imbalance ✅Hello traders!
‼️ This is my perspective on USDJPY.
Technical analysis: Here we are in a bullish market structure from 4H timeframe perspective, so I am looking for a long position, if price makes a retracement to fill the imbalance lower and then rejects from bullish order block + institutional big figure 144.000.
Like, comment and subscribe to be in touch with my content!

USDJPY I Potential area to LONG this weekWelcome back! Let me know your thoughts in the comments!
** USDJPY Analysis - Listen to video!
We recommend that you keep this pair on your watchlist and enter when the entry criteria of your strategy is met.
Please support this idea with a LIKE and COMMENT if you find it useful and Click "Follow" on our profile if you'd like these trade ideas delivered straight to your email in the future.
Thanks for your continued support!

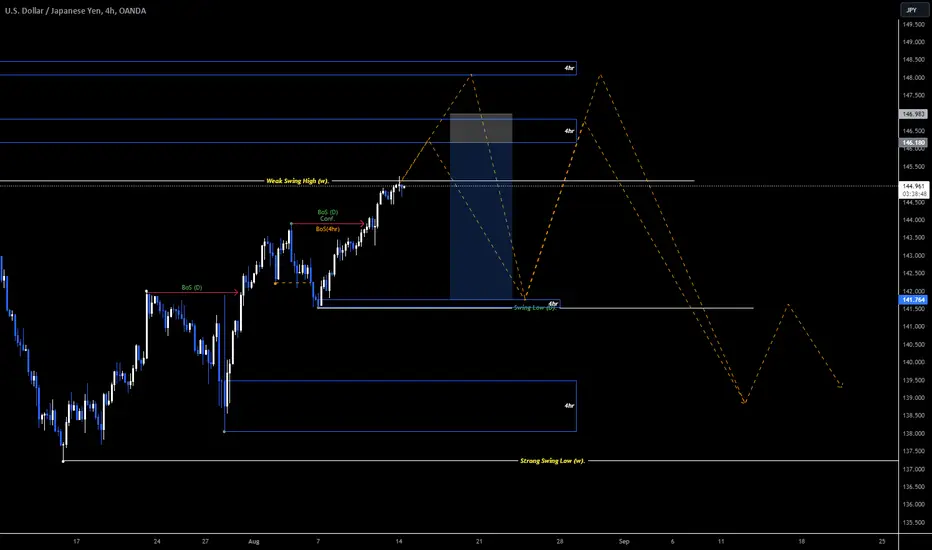
A Buy to Sell for the UJFor the UJ, I'm looking for this short buy to our supply zone 1., if that doesnt work, then we look to out to our supply zone 2.
After that, we look for a sell set up to at least 141.500s
USDJPY HIGHER CONTEXT IDEASBase on distribution while approaching to its supply of last october 2022 @ 147.500 zone
Distribution comes with buying climax, as I refered ideas before a breaker order block.
Now were approaching the highs called Automatic rally/reactions.
wait below for secondary test, price would break 145.070 on our breaker block high,
after the break, price could make a possible H&S for pattern traders, but it will just react below its demand zone to baits for sellers. and retest back again on its previous AR zone until it reach the 147.500 possible supply.
FOr a better trading wait for that zone. with stoploss above the highs of october 2022.
Trade base on your own decissions, this is not a financial advice, follow for more.
If you want to copy my ideas just give some credit..thanks.
Im not following anyone on this platform, I analyze base on my understanding on markets.
For validity of this setup , see it for yourself in the futures.
Thank you and happy 400+ followers.

USDJPY short ideaNice rejection at 144.80 with a bearish structure, I want to see the price gravitate towards pervious day London close lows under 144.50.
