Usdjpyshortsetup

SHORTING UJ FOR 60 PIPSPrior to today's market closure, UJ recorded a low at 129.520 before a move upside. Expected a fall out at my rejection zone (130.050-129.920).
Expecting a rollover to 129.350's before the NFP data for June drops!!!
NB: Red BOx; Rejection zone

USDJPY 4Hr Short!
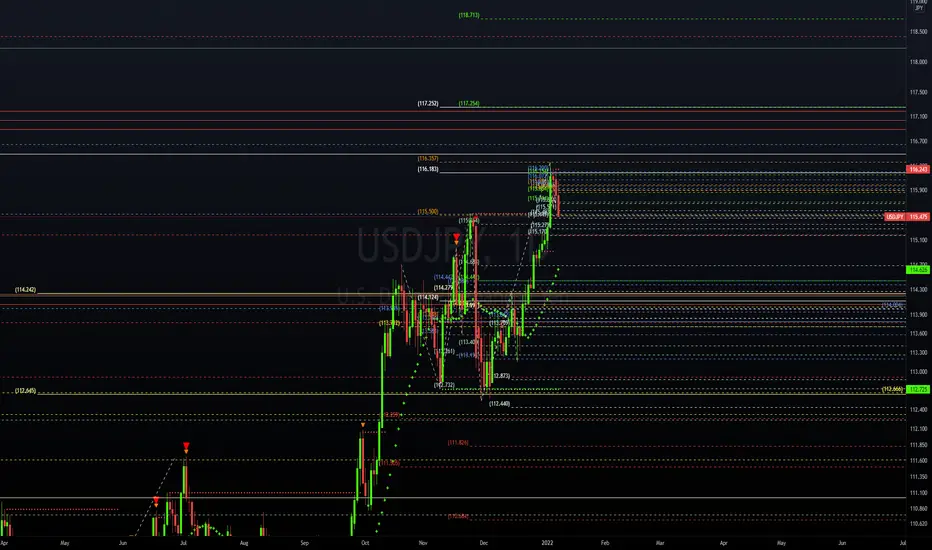
This idea is VERY SPECIFIC (and simplified) in that: Price has tested and closed (this past week) below a very important Daily Resistance Price = 119.322
Resistance Price 119.322 has corresponding Supporting Price at 116.488.
This idea remains valid only if downside Rejection at 119.322 sustains-- Meaning, price in time will drop to Support 116.488 for tests-- And failure to support at 116.488 will cause further decline to 111.028 for tests.
What if 119.322 turns to Support? Next Daily significant Resistances are 120.681 | 123.353 | 130.945
Visit USDJPY previous idea following this link:
Note: Idea is to complement your research.
Check comments section for future updates on idea.
Like this idea? Like, Share, Comment, Follow, (...)
Thank you. Happy Trading.

They got memy latest analysis on USDJPY just broke my SL
.
let's see if it gonna go down or not
.
this time short term target will be that OB
.
.
This is Not Financial Advice
.
🧅JUST AN OPINION OF THE ONION.🧅

🧅USDJPY1:3 RR on USDJPY
.
short term target at previou OB
.
.
waiting for third wave
.
This is Not Financial Advice
.
🧅JUST AN OPINION OF THE ONION.🧅


USDJPY | Still in downtrend.If you find this technical analysis useful, please like & share our ideas with the community.
What do you think is more likely to happen? Please share your thoughts in comment section. And also give a thumbs up if you find this idea helpful. Any feedback & suggestions would help in further improving the analysis.
Good Luck!
Disclaimer!
This post does not provide financial advice. It is for educational purposes only! You can use the information from the post to make your own trading plan for the market. But you must do your own research and use it as the priority. Trading is risky, and it is not suitable for everyone. Only you can be responsible for your trading.

USDJPY - Short as USD Get's Weaker We broke past the previous resistance after the market retest likely to go lower.

USD/JPY SHORT SELL NOW...
💹USD/JPY ⏬SELL STOP @ 115.095 ((Scalping Trade))
✅TP-1# 114.873
✅TP-2# 114.650
⛔️SL 115.414
N.B- MUST USE SL BECAUSE ITS WAVE CORRECTION ENTRY AND
DOLLAR HIGHLY STRONG.PLZ! FOCUS TP1.
AronnoFX will not accept any liability for loss or damage as a result of
reliance on the information contained within this channel including
data, quotes, charts and buy/sell signals
If you like this idea, do not forget to support with a like and follow.
Traders, if you like this idea or have your own opinion about it,
write in the comments. I will be glad.

USD/JPYThe US dollar initially rallied last week to reach towards the ¥115 level. That is an area that is a large, round, psychologically significant figure, and now it looks like we are ready to continue breaking down in the short term. The ¥112.50 level underneath could be a potential support level, and perhaps a potential target. At this point, we will continue to move based upon risk appetite more than anything else. I do believe that we will continue to see a lot of noisy behavior, but I think ¥112.50 is the target.

USDJPY: Three Take-Profit prices on running Short!
Previous update on analysis quoted reason for executed Short 116.183 Entry. Though 4Hr timeframe slightly differs, Daily has Three price-action prices for Take-profits on running Short.
ie 114.442 | 114.242 | 113.991
Reasons:
112.645 | 114.242 zone is previous Support/Resistance zone likely to see Retest.
114.442 and 113.991 respectively, are 0.5% and 0.618 following Fibonacci Swing Lo-Hi retest zone.
The quoted Three prices, if examined, could give reason to reverse the trade for upside breach at 116.183 for 117.254 | 118.713 zoned targets.
Conservatively, further decline could see tests at zones:
112.873 | 112.440
112.259 | 111.505 &
111.826 | 110.684
Note: Idea is to complement your research.
Check comments section for future updates on idea.
Like this idea? Like, Share, Comment, Follow, (...)
Thank you. Happy Trading.
USDJPYThe USD/JPY currency pair made its highest weekly close in 5 years for the third week running, but the candlestick formed is a pin candlestick which looks only weakly bullish, if at all. We do see a strong bullish trend, but the souring of risk sentiment last week had the effect of boosting the Japanese yen, so I do not want to go long here until we see a daily (New York) close above the nearest key resistance level at 116.29.

USDJPY DAILY! [Where to S_ELL, Where to B_UY] | SHORT!
LONG: 110.684 | 111.896 ZONE
LONG MINIMUM TARGET 113.712
USE CONFIRMATIONS!!!!!!
SHORT ENTRY ZONE 114.688 | 115.354
SHORT TARGET 112.259 | 110.684 ZONE
Note: Idea is to complement your research.
Check comments section for future updates on idea.
Like this idea? Like, Share, Comment, Follow, (...)
Thank you. Happy Trading and Happy Holidays.

USDJPY | Strong Bearish Trend. When it comes to USDJPY , a while ago, we've seen a strong impulse to the upside. And got rejected from a resistance. Right now price is staying near a supply zone as well. We also seen a multiple rejection from that area as well, which clearly shows the selling strength. Looks like there aren't many support areas till S1. So you could start booking profit from S1, which was the previous resistance area.
If you find this technical analysis useful, please like & share our ideas with the community.
What do you think is more likely to happen? Please share your thoughts in comment section. And also give a thumbs up if you find this idea helpful. Any feedback & suggestions would help in further improving the analysis.
Good Luck!
Disclaimer!
This post does not provide financial advice. It is for educational purposes only! You can use the information from the post to make your own trading plan for the market. But you must do your own research and use it as the priority. Trading is risky, and it is not suitable for everyone. Only you can be responsible for your trading.


My view for USDJPY - MychartbaseIt seems the price of USDJPY is entering the SELL AREA. If the analysis running well, we may see it going to drop to 112.530-111.715.
Saya melihat potensi pergerakan USDJPY sedang memasuki AREA SELL. Setelah itu, harga mungkin akan turun ke kisaran 112.530-111.75.
SL = stop loss
TP = take profit / target
Disclaimer On
OANDA:USDJPY #USDJPY

NEW TRADE IDEA USDJPY SHORTIts that time of the year.
USDJPY Short.
The zone has been hit once. We are trying for a re-entry of that zone.
Entry 113.080-113.300
Stop 113.400
T1 - 112.345
T2 - 111.553
We might not get there the way things are going but we are going to try to entry the momentum .
Short term trade / Daily.

usdjpy short term sell idea after the creation of W formation, we do expect the price will make correction at least to backtest the 38.2% FIB.

USDJPYWhat's up guys!
This is a really great setup from my own perspective
Price has been bullish until it approaches a major resistance zone and the momentum is killed on the larger timeframe
An upward trend line around a major resistance zone and refuses to make higher highs, it also breaks it but as a conservative trader I want to see More bears take control before my entry , I'm looking for an entry on the break of the H1 minor support zone indicated in green
There's already a cross of the Moving averages too , what do you guys think ?

USDJPY - H4 - DOWNSIDE COMING - RISK ON MODEUsdjpy - H4 - price action calling for some downside on this pair now as a big rally recently. Risk on mode as jpy strengthens as usd tumbles

UsdJpy- Drop to channel's base?Yesterday UsdJpy has reversed from the channel's resistance
With the stock market ready to fall again I expect the pair to drop to channel's base in the next weeks.
The bearish scenario is valid as long as UsdJpy is trading under 112 zone

Incoming Bulls | USDJPYOANDA:USDJPY
As it can be inferred from the chart, price broke the bearish structure from the inception where we goa a shift in market structure (SMS), we see smart money active at that point
Now, we see BSL engineered by SM to initiate the bullish order flow continuation
We expect liquidity to be grabbed and we then expect price to come into the OB before shooting higher

USDJPY 15min TIMEFRAME ANALYSIS SELLWe consider selling this USDJPY pair because of a strong resistance above. We know what we are doing and we do what the market is doing. This is more than an institutional analysis. Invest wisely. Thank you for following me on tradingview.
