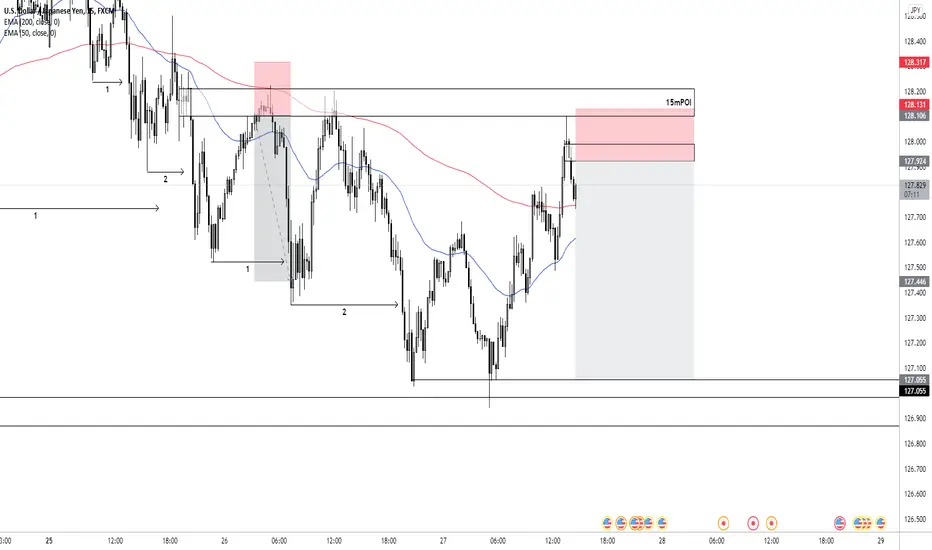
USDJPY | follow-up detailsThis is a follow-up detail to my previous speculation about this pair (see link below for reference purposes). So in this video, I explained how I plan to take advantage of a buying opportunity.
Risk Disclaimer:
Margin trading in the foreign exchange market (including commodity trading, CFDs, stocks etc.) has a high risk and is not suitable for all investors. The content of this speculation (including all data) is organized and published by me for the sole purpose of education and assistance in making independent investment decisions. All information herein is for your reference only and I take no responsibility.
You are hereby advised to carefully consider your investment experience, financial situation, investment objective, risk tolerance level, and consult your independent financial adviser as to the suitability of your situation prior to making any investment.
I do not guarantee its accuracy and is not liable for any loss or damage which may result directly or indirectly from such content or the receipt of any instruction or notification therewith.
Past performance is not necessarily indicative of future results.
Usdjpysignal

USDJPY 🧅WYCKOFF🧅I'm currently studying the wyckoff .
.
Let's see how it goes.
.
i can't publish smaller TF so ....
.
This is Not Financial Advice
.
🧅JUST AN OPINION OF THE ONION.🧅

USDJPY | Perspective for the new weekUSDJPY traded up and down as participants anticipate Fed speak during the course of last week's trading session after which we witnessed a spike down into the buy opportunity area around 128.5 that we identified at the beginning of last week's trading session ( see link below for reference purposes - Following the test 128.5 was the appearance of a reversal pattern which might be the basis for a bullish bias going into the new week.
Risk Disclaimer:
Margin trading in the foreign exchange market (including commodity trading, CFDs, stocks etc.) has a high risk and is not suitable for all investors. The content of this speculation (including all data) is organized and published by me for the sole purpose of education and assistance in making independent investment decisions. All information herein is for your reference only and I take no responsibility.
You are hereby advised to carefully consider your investment experience, financial situation, investment objective, risk tolerance level, and consult your independent financial adviser as to the suitability of your situation prior to making any investment.
I do not guarantee its accuracy and is not liable for any loss or damage which may result directly or indirectly from such content or the receipt of any instruction or notification therewith.
Past performance is not necessarily indicative of future results.

USDJPY seems BullishJapanese yen is weaker against the USD. I believe that this bullish journey will remain continue in next week. Better to look buy opportunity on every support taken on trend line.

My trade setup for next week (3)my trade setup for next week (3)
.
This is Not Financial Advice
.
🧅JUST AN OPINION OF THE ONION.🧅

USDJPY | follow-up detailsThis is a follow-up detail on the USDJPY that was published 2 days ago (see link below for reference purposes) where we were expecting the price to retrace to a minimum of 129.1 but It appears the price is finding it difficult to break the support level at 129.500 which shall become our new demand zone if this level continues to hold price action. In this regard, we should be looking for a breakout of a new key level for a bullish signal in the nearest future.
Risk Disclaimer:
Margin trading in the foreign exchange market (including commodity trading, CFDs, stocks etc.) has a high risk and is not suitable for all investors. The content of this speculation (including all data) is organized and published by me for the sole purpose of education and assistance in making independent investment decisions. All information herein is for your reference only and I take no responsibility.
You are hereby advised to carefully consider your investment experience, financial situation, investment objective, risk tolerance level, and consult your independent financial adviser as to the suitability of your situation prior to making any investment.
I do not guarantee its accuracy and is not liable for any loss or damage which may result directly or indirectly from such content or the receipt of any instruction or notification therewith.
Past performance is not necessarily indicative of future results.

USDJPY Long In The Channel!USD-JPY is trading in a uptrend
In a parallel rising channel pattern
So I am locally bullish on the pair
And I think that we will see the price go up
To retest the rising resistance above AT 134.30

USDJPY UP Trend.!#USDJPY Looking for Buy trade setup as I mentioned in the Chart.!
Keep Supporting LIKE, COMMENT And FOLLOW.!
Thank You.!


USDJPY | Perspective for the new week | follow-up detailsA follow-up detail on the USDJPY that was published sometime last week (see link below for reference purposes) where we locked in about 300pisp from our second entry.
Despite a considerable pullback from two-decade highs (which kicked us out of our first entry)during last trading week's trading session hereby edging lower some 0.52%, amid broad US dollar weakness; the bullish momentum that began at the later part of last week's trading session appears to submit a signal that participants still have confidence in the Greenback.
So, the key level identified $129 area shall be our yardstick for either a bullish (which I think is very likely) or bearish (retracement of the long-term uptrend) momentum going into the new week.
Risk Disclaimer:
Margin trading in the foreign exchange market (including commodity trading, CFDs, stocks etc.) has a high risk and is not suitable for all investors. The content of this speculation (including all data) is organized and published by me for the sole purpose of education and assistance in making independent investment decisions. All information herein is for your reference only and I take no responsibility.
You are hereby advised to carefully consider your investment experience, financial situation, investment objective, risk tolerance level, and consult your independent financial adviser as to the suitability of your situation prior to making any investment.
I do not guarantee its accuracy and is not liable for any loss or damage which may result directly or indirectly from such content or the receipt of any instruction or notification therewith.
Past performance is not necessarily indicative of future results.

USDJPY | New perspectiveConsidering the long-term bullish momentum on the USDJPY where we continue to see the Greenback grow immensely against the Yen in the last 4 months; I am looking forward to a buying opportunity above the key level identified at the 128 area. However, should a breakdown/retest of the bullish trendline on the 4H timeframe... we might be looking forward to a retracement. I shall keep an update on this trade in the comment section on my Tradingview account.
Risk Disclaimer:
Margin trading in the foreign exchange market (including commodity trading, CFDs, stocks etc.) has a high risk and is not suitable for all investors. The content of this speculation (including all data) is organized and published by me for the sole purpose of education and assistance in making independent investment decisions. All information herein is for your reference only and I take no responsibility.
You are hereby advised to carefully consider your investment experience, financial situation, investment objective, risk tolerance level, and consult your independent financial adviser as to the suitability of your situation prior to making any investment.
I do not guarantee its accuracy and is not liable for any loss or damage which may result directly or indirectly from such content or the receipt of any instruction or notification therewith.
Past performance is not necessarily indicative of future results.

They got memy latest analysis on USDJPY just broke my SL
.
let's see if it gonna go down or not
.
this time short term target will be that OB
.
.
This is Not Financial Advice
.
🧅JUST AN OPINION OF THE ONION.🧅

🧅USDJPY1:4 RR on USDJPY
.
pending sell position
.
target previous equal low
.
This is Not Financial Advice
.
🧅JUST AN OPINION OF THE ONION.🧅
🧅USDJPY1:2.8 & 1:4 RR on USDJPY
.
.
two possible entries for short position
.
target at previous H1 OB
.
This is Not Financial Advice
.
🧅JUST AN OPINION OF THE ONION.🧅

USDJPY 4H Projection USDJPY 4H Projection
My view on USDJPY for 4H.
USDJPY Elliott Wave(5 Wave) Structure is over now
USD-JPY was trading in an uptrend
For a very long time
But now we are finally seeing a bearish breakout
And as the correction is overdue
I am expecting a move down
Towards the target below
Sell!
Like, comment and subscribe to boost your trading!
See other ideas below too!

🧅USDJPY1:3 RR on USDJPY
.
short term target at previou OB
.
.
waiting for third wave
.
This is Not Financial Advice
.
🧅JUST AN OPINION OF THE ONION.🧅

usdjpyit broke the HTF trendline and clearly looks bearish. it is kind of a risky trade to trade but the way market is working usd will go alot lower than expected.Not a financial advice .


USDJPY | New perspectiveWe were able to close our last position on this pair with approximately 210pips (see link below for reference purposes) and now we are likely at a juncture in the market where another opportunity to buy appears to be evolving. The identification of a consolidation phase sitting on a strong bullish trendline on the 1H timeframe is probably a signal of a bullish momentum building up.
Risk Disclaimer:
Margin trading in the foreign exchange market (including commodity trading, CFDs, stocks etc.) has a high risk and is not suitable for all investors. The content of this speculation (including all data) is organized and published by me for the sole purpose of education and assistance in making independent investment decisions. All information herein is for your reference only and I take no responsibility.
You are hereby advised to carefully consider your investment experience, financial situation, investment objective, risk tolerance level, and consult your independent financial adviser as to the suitability of your situation prior to making any investment.
I do not guarantee its accuracy and is not liable for any loss or damage which may result directly or indirectly from such content or the receipt of any instruction or notification therewith.
Past performance is not necessarily indicative of future results.

USDJPY | New perspectiveSince the beginning of the month, price action has continued to respect the bullish trend line identified in the 4H timeframe and we are hoping to catch one last bullish move if it finally happens. A significant breakout of key levels during the course of yesterday's trading session could probably be a signal for a trend continuation in the nearest future as long as the price does not break down the bullish trendline.
Risk Disclaimer:
Margin trading in the foreign exchange market (including commodity trading, CFDs, stocks etc.) has a high risk and is not suitable for all investors. The content of this speculation (including all data) is organized and published by me for the sole purpose of education and assistance in making independent investment decisions. All information herein is for your reference only and I take no responsibility.
You are hereby advised to carefully consider your investment experience, financial situation, investment objective, risk tolerance level, and consult your independent financial adviser as to the suitability of your situation prior to making any investment.
I do not guarantee its accuracy and is not liable for any loss or damage which may result directly or indirectly from such content or the receipt of any instruction or notification therewith.
Past performance is not necessarily indicative of future results.

⭕️SELL USDJPY ; Its time to sell❗️🔰You see the analysis of the US dollar against the Japanese Yen in Daily ( USDJPY , D1)❗️🔎
🔰SELL USDJPY at 125.600
✅TP ; 122.00
❌SL ; 126.300
🔰As is evident from the analysis, considering the price in the sales supply area in this range, it seems logical that the target is placed at the confluence of the demand area (orange) and the uptrend support line (white dotted line)❗️🧐
⚠️⚠️Please observe capital management and open a low volume transaction❗️❗️
I hope this analysis is useful for you🙏🏻🌹
📌Please introduce the "TRADER STREET" to your friends 🙏🏻
_______________________📈TRADER STREET📉________________________


USDJPY extends ahead of FOMC minutesUSD/JPY extends gains ahead of FOMC minutes, hawkish Fed speak buoys USD
Focus now on the release of FOMC minutes for clues on the prospect of a 50 basis point hike at the U.S. central bank's next meeting in May.
Technical bias for the pair is bullish. Scope for test of fresh multi-year high above 125 handle.
