USDJPY: Analysis daily with me!USD/JPY is rebounding towards 142.50 in Tuesday's Asian session. Improved risk sentiment weakens the safe-haven Yen and supports the US Dollar. However, a Japanese holiday is limiting further upside.
Usdjpysignals

USDJPY Moment of truth for the long-term bullish trend.The USDJPY pair has been trading within a Channel Up since the October 17 2022 High and right now the current 1W candle is very close to its bottom (Higher Lows trend-line). This offers a low risk trading set-up.
Confirmed buy will be if the price breaks and closes a 1W candle above the 1W MA50 (blue trend-line), in which case our Target will be July's Resistance at 161.500 (similar to the 2023 Bullish Leg).
If on the other hand it breaks and closes a 1W candle below the Channel Up, turn short and target the 1W MA200 (orange trend-line) at 139.500.
-------------------------------------------------------------------------------
** Please LIKE 👍, FOLLOW ✅, SHARE 🙌 and COMMENT ✍ if you enjoy this idea! Also share your ideas and charts in the comments section below! This is best way to keep it relevant, support us, keep the content here free and allow the idea to reach as many people as possible. **
-------------------------------------------------------------------------------
Disclosure: I am part of Trade Nation's Influencer program and receive a monthly fee for using their TradingView charts in my analysis.
💸💸💸💸💸💸
👇 👇 👇 👇 👇 👇

USDJPY and GBPJPY Analysis todayHello traders, this is a complete multiple timeframe analysis of this pair. We see could find significant trading opportunities as per analysis upon price action confirmation we may take this trade. Smash the like button if you find value in this analysis and drop a comment if you have any questions or let me know which pair to cover in my next analysis.

USD/JPY "The Ninja" Forex Bank Bullish Heist Plan🌟Hi! Hola! Ola! Bonjour! Hallo! Marhaba!🌟
Dear Money Makers & Robbers, 🤑 💰💸✈️
Based on 🔥Thief Trading style technical and fundamental analysis🔥, here is our master plan to heist the USD/JPY "The Ninja" Forex Bank. Please adhere to the strategy I've outlined in the chart, which emphasizes long entry. Our aim is the high-risk Red Zone. Risky level, overbought market, consolidation, trend reversal, trap at the level where traders and bearish robbers are stronger. 🏆💸Book Profits Be wealthy and safe trade.💪🏆🎉
Entry 📈 : "The vault is wide open! Swipe the Bullish loot at any price - the heist is on!
however I advise to Place buy limit orders within a 15 or 30 minute timeframe most recent or swing, low or high level. I Highly recommended you to put alert in your chart.
Stop Loss 🛑:
Thief SL placed at the recent / nearest low level Using the 1H timeframe (148.250) swing trade basis.
SL is based on your risk of the trade, lot size and how many multiple orders you have to take.
🏴☠️Target 🎯: 152.300 (or) Escape Before the Target
🧲Scalpers, take note 👀 : only scalp on the Long side. If you have a lot of money, you can go straight away; if not, you can join swing traders and carry out the robbery plan. Use trailing SL to safeguard your money 💰.
USD/JPY "The Ninja" Forex Bank Heist Plan (Day Trade) is currently experiencing a bullishness,., driven by several key factors.
📰🗞️Get & Read the Fundamental analysis, Macro Economics, COT Report, Quantitative Analysis, Intermarket Analysis, Sentimental Outlook, Positioning and future trend...
Before start the heist plan read it.👉👉👉
📌Keep in mind that these factors can change rapidly, and it's essential to stay up-to-date with market developments and adjust your analysis accordingly.
⚠️Trading Alert : News Releases and Position Management 📰 🗞️ 🚫🚏
As a reminder, news releases can have a significant impact on market prices and volatility. To minimize potential losses and protect your running positions,
we recommend the following:
Avoid taking new trades during news releases
Use trailing stop-loss orders to protect your running positions and lock in profits
💖Supporting our robbery plan 💥Hit the Boost Button💥 will enable us to effortlessly make and steal money 💰💵. Boost the strength of our robbery team. Every day in this market make money with ease by using the Thief Trading Style.🏆💪🤝❤️🎉🚀
I'll see you soon with another heist plan, so stay tuned 🤑🐱👤🤗🤩

USD/JPY SELL/SHORTBy utilizing Fibonacci retracement levels, historical patterns, , we can formulate a hypothesis that the market might follow a similar trajectory if bearish sentiment prevails.
USDJPY Trend forecast for the day on March 24 2025According to my analysis, the Forex pair USD/JPY will see a fall in the second half of the day. The Advanced Market Timing indicator is also substantiating my analysis. Use your own technical analysis for entries, stops and exis.

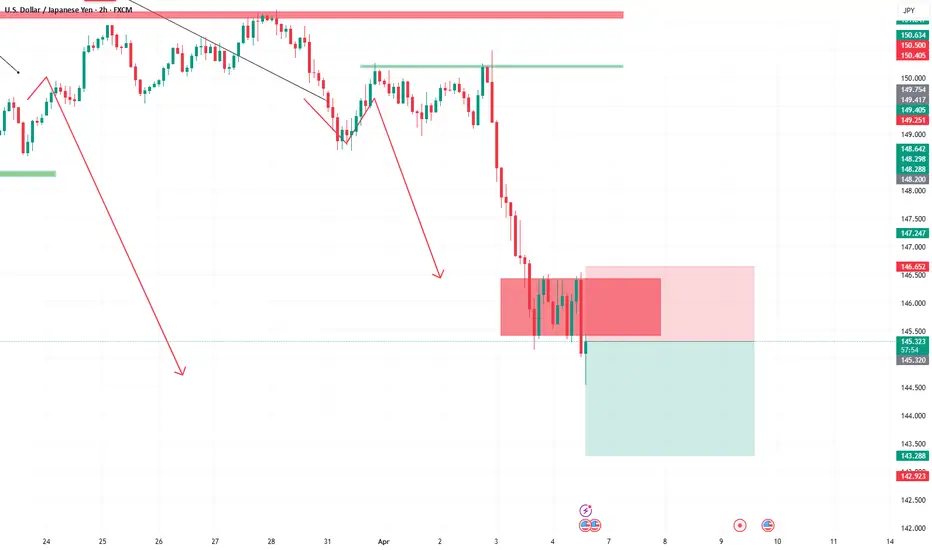
USDJPY Channel Down to make an important decision.The USDJPY pair has been trading within a Channel Down pattern since the January 10 High. During that time it technically got rejection upon every 4H MA100 (green trend-line) contact or close contact into a new Bearish Leg.
Three out of those four Bearish Legs have been -3.16% so even if a rejection does happen at the top (Lower Highs trend-line) of the Channel Down, you can still be expecting 145.350 as a Target.
If however the 4H RSI Bullish Divergence on Higher Lows prevails and causes the price to break above the Channel Down, we will accept the small loss on the short and go long instead, targeting the 2.0 Fibonacci extension at 156.000. A lower Target in that scenario can also be Resistance 2 (154.800).
-------------------------------------------------------------------------------
** Please LIKE 👍, FOLLOW ✅, SHARE 🙌 and COMMENT ✍ if you enjoy this idea! Also share your ideas and charts in the comments section below! This is best way to keep it relevant, support us, keep the content here free and allow the idea to reach as many people as possible. **
-------------------------------------------------------------------------------
Disclosure: I am part of Trade Nation's Influencer program and receive a monthly fee for using their TradingView charts in my analysis.
💸💸💸💸💸💸
👇 👇 👇 👇 👇 👇

USDJPY Intraday Trend Forecast for March 13, 2025The levels given in the chart may vary. The projection line will help us understand the probability of the move during the day. Use your own Technical Study for entries and exits.

USD/JPY "The Gopher" Forex Market Bullish Heist Plan🌟Hi! Hola! Ola! Bonjour! Hallo! Marhaba!🌟
Dear Money Makers & Thieves, 🤑 💰🐱👤
Based on 🔥Thief Trading style technical and fundamental analysis🔥, here is our master plan to heist the USD/JPY "The Gopher" Forex market. Please adhere to the strategy I've outlined in the chart, which emphasizes long entry. Our aim is the high-risk Red Zone. Risky level, overbought market, consolidation, trend reversal, trap at the level where traders and bearish robbers are stronger. 🏆💸Book Profits wealthy and safe trade.💪🏆🎉
Entry 📈 : "The vault is wide open! Swipe the Bullish loot at any price - the heist is on!
however I advise to Place Buy stop orders above the Moving average (or) Place buy limit orders within a 15 or 30 minute timeframe most recent or swing, low or high level.
Stop Loss 🛑:
Thief SL placed at the recent / swing low level Using the 1H timeframe (148.600) swing trade basis.
SL is based on your risk of the trade, lot size and how many multiple orders you have to take.
Target 🎯: 152.300 (or) Escape Before the Target
🧲Scalpers, take note 👀 : only scalp on the Long side. If you have a lot of money, you can go straight away; if not, you can join swing traders and carry out the robbery plan. Use trailing SL to safeguard your money 💰.
📰🗞️Fundamental, Macro, COT, Sentimental Outlook:
USD/JPY "The Gopher" Forex Market is currently experiencing a bullish trend,., driven by several key factors.
🔰 Fundamental Analysis
- The Bank of Japan's (BOJ) monetary policy decisions significantly impact the yen's value. The BOJ's negative interest rate policy and quantitative easing program have contributed to the yen's depreciation.
- The US Federal Reserve's interest rate decisions also influence the USD/JPY exchange rate. Higher interest rates in the US can attract investors, causing the dollar to appreciate.
- Japan's trade balance and current account deficit can impact the yen's value. A large trade deficit can lead to a depreciation of the yen.
🔰 Macroeconomic Factors
- Inflation: Japan's inflation rate has been relatively low, which can impact the BOJ's monetary policy decisions.
- GDP Growth: Japan's GDP growth rate has been slow, which can impact the yen's value.
- Unemployment Rate: Japan's unemployment rate has been relatively low, which can impact the labor market and inflation.
🔰 COT Data
- Non-Commercial Traders: These traders, including hedge funds and individual investors, hold a significant portion of the USD/JPY futures market.
- Commercial Traders: These traders, including banks and other financial institutions, hold a smaller portion of the USD/JPY futures market.
🔰 Market Sentiment Analysis
- Bullish Sentiment: Some investors are bullish on the USD/JPY due to the interest rate differential between the US and Japan.
- Bearish Sentiment: Others are bearish due to concerns about Japan's economy and the potential for the BOJ to intervene in the currency market.
🔰 Positioning
- Long Positions: Some investors have taken long positions in the USD/JPY, betting on a continuation of the uptrend.
- Short Positions: Others have taken short positions, betting on a reversal of the uptrend.
🔰 Next Trend Move
- The USD/JPY may continue its uptrend if the interest rate differential between the US and Japan remains significant.
- However, if the BOJ intervenes in the currency market or if Japan's economy shows signs of improvement, the uptrend may reverse.
🔰 Overall Summary Outlook
The USD/JPY currency pair is influenced by a combination of fundamental, macroeconomic, and market sentiment factors. While some investors are bullish on the pair due to the interest rate differential, others are bearish due to concerns about Japan's economy. The next trend move will depend on various factors, including the BOJ's monetary policy decisions and Japan's economic performance.
⚠️Trading Alert : News Releases and Position Management 📰 🗞️ 🚫🚏
As a reminder, news releases can have a significant impact on market prices and volatility. To minimize potential losses and protect your running positions,
we recommend the following:
Avoid taking new trades during news releases
Use trailing stop-loss orders to protect your running positions and lock in profits
💖Supporting our robbery plan will enable us to effortlessly make and steal money 💰💵 Tell your friends, Colleagues and family to follow, like, and share. Boost the strength of our robbery team. Every day in this market make money with ease by using the Thief Trading Style.🏆💪🤝❤️🎉🚀
I'll see you soon with another heist plan, so stay tuned 🤑🐱👤🤗🤩

JPY Market Analysis Update – Key Level at 148.000Market Overview:
📈 Strong JPY Performance:
Expectations of another BoJ rate hike have pushed the Japanese Yen to perform strongly in the Asia-Pacific region.
📊 Record Net Long Positions:
Non-commercial traders' net long yen futures surged to 96K contracts (up from 61K), setting a 30-year record according to CFTC data.
Technical Insights:
📉 Descending Channel & Reversal Setup:
While bearish pressure has been evident, momentum is showing signs of easing, hinting at a potential stabilization or near-term bounce. A reversal setup is identified in the 147.000/148.000 zone.
🎯 Key Level:
Next week, the crucial level is 148.000. Be prepared for a buy signal if prices break above, or a sell signal if they remain below this level.
Upcoming Catalysts:
⏰ Fed Policy Uncertainty:
With Fed Chair Jerome Powell indicating that rate cuts are not imminent, this policy uncertainty could favor the US Dollar in the coming week, influencing the JPY further.
Keep an eye on the Consumer Price Index, Producer Price Index, and Michigan Consumer Sentiment Index.
Stay Tuned:
I'll provide a detailed update at the beginning of next week. Follow along for more insights and actionable trading strategies!
Happy Trading!
Disclaimer:
Forex and other market trading involve high risk and may not be for everyone. This content is educational only—not financial advice. Always assess your situation and consult a professional before investing. Past performance doesn’t guarantee future results.

USD/JPY Falls from 154.80 – Is 146 the Next Target?In my post last week about USD/JPY, I mentioned that the pair could resume its decline and draw attention to the 154+ sell zone.
Indeed, USD/JPY started falling after reaching 154.80 and is now trading at 151.72, which is very close to a key horizontal support level.
Looking ahead, I expect this support to break, pushing the pair below 150 and potentially down to the next horizontal support around 146.
In conclusion, my strategy remains unchanged: I will continue looking to sell rallies, with invalidation above last week’s high.
Disclosure: I am part of Trade Nation's Influencer program and receive a monthly fee for using their TradingView charts in my analyses and educational articles.

USD/JPY Trading Plan: Resistance in Focus Before the Next DropSince the beginning of the year, USD/JPY has been in a bearish trend, with the price dropping from 159 to 151.
After reaching support around the 151 zone following Friday's NFP, the price started to reverse upward and is currently trading at 153.63.
In my view, this is just a correction of the initial leg down, and once resistance is reached, the price is likely to resume its downward trend.
The sell zone starts above 154 and extends to 155, where I will be looking for selling opportunities.
In the medium term, the price could drop to 146, with the first major support at the recent low of 151.
Disclosure: I am part of Trade Nation's Influencer program and receive a monthly fee for using their TradingView charts in my analysis.

USD/JPY "The Ninja" Forex Market Bearish Heist Plan🌟Hi! Hola! Ola! Bonjour! Hallo!🌟
Dear Money Makers & Robbers, 🤑 💰
Based on 🔥Thief Trading style technical and fundamental analysis🔥, here is our master plan to heist the USD/JPY "The Ninja" Forex market. Please adhere to the strategy I've outlined in the chart, which emphasizes short entry. Our aim is the high-risk Green Zone. Risky level, oversold market, consolidation, trend reversal, trap at the level where traders and bullish robbers are stronger. 👀 Be wealthy and safe trade.💪🏆🎉
Entry 📉 : Traders & Thieves with New Entry A Bear trade can be initiated at any price level.
however I advise placing sell limit orders within a 15 or 30 minute timeframe. Entry from the most recent or closest high level should be in retest.
Stop Loss 🛑: Using the 4h period, the recent / nearest high level
Goal 🎯: 153.000 (or) Before escape in the market
Scalpers, take note : only scalp on the Short side. If you have a lot of money, you can go straight away; if not, you can join swing traders and carry out the robbery plan. Use trailing SL to safeguard your money 💰.
📰🗞️Fundamental, Macro, COT, Sentimental Outlook:
The USD/JPY "The Ninja" Forex market is currently experiencing a mixed market sentiment. Here's a breakdown of the factors influencing its movement:
⚪Fundamental Analysis:
- The Bank of Japan's (BoJ) recent interest rate hike decision has strengthened the Japanese Yen, making it a safe-haven asset.
- The US Federal Reserve's dovish stance on interest rates has put downward pressure on the US Dollar.
🟤Macroeconomic Analysis:
- The divergent policy expectations between the Fed and BoJ might continue to act as a tailwind for the currency pair.
- Trade war fears could limit any downside movement.
🟠Commitment of Traders (COT) Report:
- Non-Commercial Traders (Speculators): Net short USD/JPY by 24,444 contracts, indicating a bearish sentiment.
- Commercial Traders (Hedgers): Net long USD/JPY by 15,101 contracts, indicating a bullish sentiment.
- Small Traders (Retail): Net short USD/JPY by 9,343 contracts, indicating a bearish sentiment.
🟣Sentimental Analysis:
- Trader sentiment is mixed, with some investors expecting a bullish movement due to the BoJ's hawkish stance, while others are bearish due to the Fed's dovish stance.
- Market sentiment is cautious ahead of the Fed's interest rate decision.
🟢Institutional and Retail Market Analysis:
- Institutional investors are watching the currency pair closely, awaiting the Fed's decision before making any significant moves.
- Retail investors are also cautious, with some taking long positions on the Yen due to its safe-haven status.
🔵Outlook:
- Based on the analysis, the USD/JPY currency pair is expected to move into a bearish direction in the short term, with a target level of 153.00. However, the movement is likely to be volatile, and investors should be cautious ahead of the Fed's interest rate decision.
⚠️Trading Alert : News Releases and Position Management 📰 🗞️ 🚫🚏
As a reminder, news releases can have a significant impact on market prices and volatility. To minimize potential losses and protect your running positions,
we recommend the following:
Avoid taking new trades during news releases
Use trailing stop-loss orders to protect your running positions and lock in profits
📌Please note that this is a general analysis and not personalized investment advice. It's essential to consider your own risk tolerance and market analysis before making any investment decisions.
📌Keep in mind that these factors can change rapidly, and it's essential to stay up-to-date with market developments and adjust your analysis accordingly.
💖Supporting our robbery plan will enable us to effortlessly make and steal money 💰💵 Tell your friends, Colleagues and family to follow, like, and share. Boost the strength of our robbery team. Every day in this market make money with ease by using the Thief Trading Style.🏆💪🤝❤️🎉🚀
I'll see you soon with another heist plan, so stay tuned 🫂

USDJPY: Massive Breakout 🇺🇸🇯🇵
USDJPY broke and closed below a significant daily support cluster.
The broken structure now turned into a strong resistance.
I expect a bearish continuation lower.
Next support - 151.3
❤️Please, support my work with like, thank you!❤️

USDJPY: Bearish Move Continues 🇺🇸🇯🇵
USDJPY looks bearish after a test of a falling trend line on a daily.
The price formed a double top and violated its neckline with
a bearish imbalance candle.
Next support - 154.73
❤️Please, support my work with like, thank you!❤️

USDJPY: Intraday Bearish Confirmation 🇺🇸🇯🇵
Earlier on Friday, I shared with you a confirmed structure
breakout on USDJPY on a daily.
This morning, retesting a broken structure, the price formed
a strong bearish confimation on an hourly.
I see a double top pattern and a violation of its neckline.
With a high probability, the price will fall and reach 155.57/ 155.18 levels.
❤️Please, support my work with like, thank you!❤️

USD/JPY "The Gopher" Forex Market Heist Plan🌟Hi! Hola! Ola! Bonjour! Hallo!🌟
Dear Money Makers & Robbers, 🤑 💰
Based on 🔥Thief Trading style technical and fundamental analysis🔥, here is our master plan to heist the USD/JPY "The Gopher" Forex market. Please adhere to the strategy I've outlined in the chart, which emphasizes long & Short entry. 👀 So Be wealthy and safe trade 💪🏆🎉
Entry 📈 : You can enter a Bull or Bear trade at any point after the PPI news.
Stop Loss 🛑: Using the 1H period, the recent / nearest Pullbacks.
Goal 🎯: Bullish Robbers TP 160.00 (or) Before
Bearish Robbers TP 155.500 (or) Before
Warning⚠️ : Our heist strategy is incompatible with Fundamental Analysis news 📰 🗞️. We'll wreck our plan by smashing the Stop Loss 🚫🚏. Avoid entering the market right after the news release.
Fundamental Outlook 📰🗞️
The upcoming PPI news is expected to be positive, with the Producer Price Index for final demand predicted to rise. This is based on the recent trend of increasing prices for final demand goods and services. In the previous month, the index for final demand goods moved up 0.7 percent, with prices for final demand foods jumping 3.1 percent. The index for final demand services also rose 0.2 percent, led by a 0.8-percent increase in margins for final demand trade services.
Upcoming Fundamental Indicators:
Interest Rate Divergence: US Federal Reserve vs. Bank of Japan
US Economic Data: Non-Farm Payroll, GDP growth rate
Japanese Economic Data: GDP growth rate, inflation rate
Trade Tensions: US-Japan trade tensions
Upcoming Market Sentiment:
Bullish Sentiment: 70%
Bearish Sentiment: 30%
Neutral Sentiment: 0%
Please note that this is a general analysis and not personalized investment advice. It's essential to consider your own risk tolerance and market analysis before making any investment decisions.
Take advantage of the target and get away 🎯 Swing Traders Please reserve the half amount of money and watch for the next dynamic level or order block breakout. Once it is resolved, we can go on to the next new target in our heist plan.
Keep in mind that these factors can change rapidly, and it's essential to stay up-to-date with market developments and adjust your analysis accordingly.
💖Supporting our robbery plan will enable us to effortlessly make and steal money 💰💵 Tell your friends, Colleagues and family to follow, like, and share. Boost the strength of our robbery team. Every day in this market make money with ease by using the Thief Trading Style.🏆💪🤝❤️🎉🚀
I'll see you soon with another heist plan, so stay tuned 🫂

USDJPY: Strong Bearish Signal?! 🇺🇸🇯🇵
USDJPY looks bearish after a 1-month-long consolidation.
Bearish breakout of a support of a sideways range is a reliable
confirmation signal.
We can expect a down move at least to 154.55 support.
❤️Please, support my work with like, thank you!❤️

USDJPY 1st 1D Golden Cross since June 2023! Bullish!The USDJPY pair has been trading within a long-term Channel Up since the October 21 2022 High. Today it formed its 1st Bullish Cross on the 1D time-frame in 1.5 year (since June 202 2023) and technically it is a very bullish development.
It is not just the standard bullish dynamics of this formation but also that last time we had a Golden Cross, the price bottomed upon the completion of a 1D MACD Bullish Cross, which we also got today and rallied to hit the Resistance 1 level.
As a result, this is a strong buy signal and our Target is just below Resistance 1 at 160.000.
-------------------------------------------------------------------------------
** Please LIKE 👍, FOLLOW ✅, SHARE 🙌 and COMMENT ✍ if you enjoy this idea! Also share your ideas and charts in the comments section below! This is best way to keep it relevant, support us, keep the content here free and allow the idea to reach as many people as possible. **
-------------------------------------------------------------------------------
💸💸💸💸💸💸
👇 👇 👇 👇 👇 👇

#UASJPY: Swing Selling is in progress, Are we heading Bears Era?Dear Traders,
Hopefully, you having a great weekend so far, we have a great opportunity on USDJPY, possible a total bearish meltdown on all the jpy pairs especially with UJ, we are on the verge of collapse. At the moment we expect price to do a small correction before it drops further. At this correction we may expect price to reverse nicely. We expect this idea to be activated by Friday when we will be having a last nfp data of the 2024. Decembers are known for bears control over jpy pairs.
thank you ;)

USDJPY Bullish Cross on 1W MACD will push it higher.The USDJPY pair is having an excellent bullish run since our September 25 buy signal (see chart below), which was right at the bottom of the 2-year Channel Up:
We're approaching our 161.800 long-term Target much faster than we expected but we've identified this time a short-term opportunity that can go along with the long-term one. We are past a 1W MACD Bullish Cross and when the previous Bullish Leg formed one on Aptil 14 2023, the price (which was already within a Channel Up) didn't stop the uptrend. On the contrary it extended it up until a little after a 1D Golden Cross was formed.
As a result we can target additionally 160.000 within a 2-month time-frame.
-------------------------------------------------------------------------------
** Please LIKE 👍, FOLLOW ✅, SHARE 🙌 and COMMENT ✍ if you enjoy this idea! Also share your ideas and charts in the comments section below! This is best way to keep it relevant, support us, keep the content here free and allow the idea to reach as many people as possible. **
-------------------------------------------------------------------------------
💸💸💸💸💸💸
👇 👇 👇 👇 👇 👇

USD/JPY "The Ninja" Bank Money Heist Plan on Bullish SideOla! Ola! My Dear Robbers / Money Makers & Losers, 🤑 💰
This is our master plan to Heist USD/JPY "The Ninja" Bank based on Thief Trading style Technical Analysis.. kindly please follow the plan I have mentioned in the chart focus on Long entry. Our target is Red Zone that is High risk Dangerous level, market is overbought / Consolidation / Trend Reversal / Trap at the level Bearish Robbers / Traders gain the strength. Be safe and be careful and Be rich.
Entry : Can be taken Anywhere, What I suggest you to Place Buy Limit Orders in 15mins Timeframe Recent / Nearest Swing Low
Stop Loss 🛑 : Recent Swing Low using 2h timeframe
Attention for Scalpers : If you've got a lot of money you can get out right away otherwise you can join with a swing trade robbers and continue the heist plan, Use Trailing SL to protect our money 💰.
Warning : Fundamental Analysis news 📰 🗞️ comes against our robbery plan. our plan will be ruined smash the Stop Loss. Don't Enter the market at the news update.
Loot and escape on the target 🎯 Swing Traders Plz Book the partial sum of money and wait for next breakout of dynamic level / Order block, Once it is cleared we can continue our heist plan to next new target.
Support our Robbery plan we can easily make money & take money 💰💵 Follow, Like & Share with your friends and Lovers. Make our Robbery Team Very Strong Join Ur hands with US. Loot Everything in this market everyday make money easily with Thief Trading Style.
Stay tuned with me and see you again with another Heist Plan..... 🫂

USDJPY: Pullback Movement Continues 🇺🇸🇯🇵
Following my yesterday's trading idea, USDJPY nicely respected
a key horizontal support bounced from that.
Analyzing a 4H time frame, I see one more bullish confirmation today.
This time, the price formed a double bottom pattern and violated its neckline.
Growth will most likely continue, at least to 152.9
❤️Please, support my work with like, thank you!❤️
