Analysing the Volatility Spike on the USD/JPY ChartAnalysing the Volatility Spike on the USD/JPY Chart
The USD/JPY chart offers plenty of noteworthy insights for analysis:
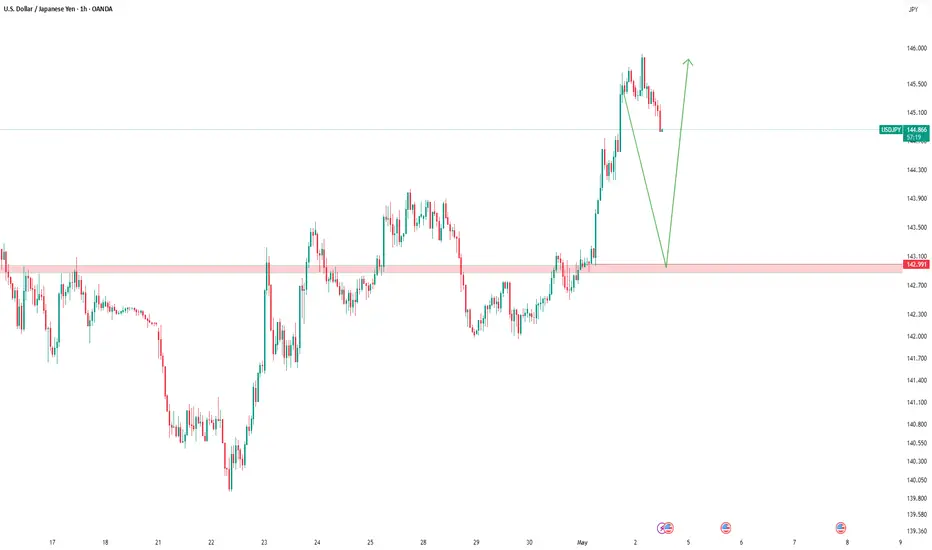
→ A one-month low was recorded today (marked by the arrow);
→ This was followed by a sharp upward reversal, with a series of large bullish candlesticks forming on the intraday chart.
Why Is USD/JPY Moving Sharply Today?
The primary driver appears to be recent statements from Bank of Japan Governor Kazuo Ueda.
According to Trading Economics, this morning Ueda:
→ warned of rising core inflation risks linked to increasing food prices;
→ indicated that the Bank of Japan is prepared to adjust its monetary policy in order to achieve a stable inflation target.
Latest data show that Japan’s core inflation unexpectedly rose to 3.5% — the highest level in two years — reinforcing the case for further rate hikes. However, what's particularly striking is that despite Ueda’s hawkish tone, the yen is weakening.
Technical Analysis of the USD/JPY Chart
Yen fluctuations formed a downward trajectory (marked in orange) in the second half of May, partly driven by US dollar weakness. Following a period of relative calm, the market has shifted into high gear — the ATR indicator is climbing sharply from multi-month lows, breaking through resistance at the 143.0 level.
This aggressive price action on the USD/JPY chart today suggests we may be witnessing an attempted bullish breakout from the channel. In light of this, it is possible that the surge in volatility reflects a fundamental shift in market sentiment — one that could potentially lead to the development of an upward trend.
This article represents the opinion of the Companies operating under the FXOpen brand only. It is not to be construed as an offer, solicitation, or recommendation with respect to products and services provided by the Companies operating under the FXOpen brand, nor is it to be considered financial advice.
Usdjpytrade

USD/JPY "The Gopher" Forex Bank Bullish Heist Plan (Swing Trade)🌟Hi! Hola! Ola! Bonjour! Hallo! Marhaba!🌟
Dear Money Makers & Robbers, 🤑 💰💸✈️
Based on 🔥Thief Trading style technical and fundamental analysis🔥, here is our master plan to heist the USD/JPY "The Gopher" Forex Market. Please adhere to the strategy I've outlined in the chart, which emphasizes long entry. Our aim is to escape near the high-risk Yellow MA Zone. Risky level, overbought market, consolidation, trend reversal, trap at the level where traders and bearish robbers are stronger. 🏆💸"Take profit and treat yourself, traders. You deserve it!💪🏆🎉
Entry 📈 : The vault is wide open! Swipe the Bullish loot at any price - the heist is on!
Place buy limit orders most recent or swing, low level for Pullback entries.
Stop Loss 🛑:
📍 Thief SL placed at the recent/swing low level Using the 4H timeframe (138.500) Day/Swing trade basis.
📍 SL is based on your risk of the trade, lot size and how many multiple orders you have to take.
🏴☠️Target 🎯: 147.500 (or) Escape Before the Target
🧲Scalpers, take note 👀 : only scalp on the Long side. If you have a lot of money, you can go straight away; if not, you can join swing traders and carry out the robbery plan. Use trailing SL to safeguard your money 💰.
💰💵💸USD/JPY "The Ninja" Forex Money Heist Plan is currently experiencing a bullishness,., driven by several key factors. .☝☝☝
📰🗞️Get & Read the Fundamental, Macro, COT Report, Quantitative Analysis, Sentimental Outlook, Intermarket Analysis, Future trend targets & Overall Score... go ahead to check 👉👉👉🔗🔗🌎🌏🗺
⚠️Trading Alert : News Releases and Position Management 📰 🗞️ 🚫🚏
As a reminder, news releases can have a significant impact on market prices and volatility. To minimize potential losses and protect your running positions,
we recommend the following:
Avoid taking new trades during news releases
Use trailing stop-loss orders to protect your running positions and lock in profits
💖Supporting our robbery plan 💥Hit the Boost Button💥 will enable us to effortlessly make and steal money 💰💵. Boost the strength of our robbery team. Every day in this market make money with ease by using the Thief Trading Style.🏆💪🤝❤️🎉🚀
I'll see you soon with another heist plan, so stay tuned 🤑🐱👤🤗🤩

USD/JPY Analysis: Bearish Bias with Multi-Market Confluence!📉 USDJPY Technical Breakdown – Yen Strength in Focus 📉
In this video, we take a close look at the USD/JPY, which is currently under pressure and trending to the downside 🔽. The bearish momentum is clear, but there are several key factors to consider before positioning ourselves for a potential short 📊.
🔍 First, it’s important to monitor the equity markets. If we start to see a pullback or sell-off in the stock indices 🏦📉, that could translate into further yen strength, adding weight to a USD/JPY short bias 💴💪.
Another key piece of confluence is comparing the DXY (Dollar Index) 📈 with the JXY (Japanese Yen Index) 📉. This gives us deeper insight into the relative strength of each currency and helps confirm our directional bias before entering a trade ⚖️.
🔁 Coming back to the USD/JPY chart, we’re watching for a retracement into a Fibonacci point of interest, which could provide a high-probability area to enter a sell setup. If price reacts from that level and confirms with structure, we could have a clean opportunity for continuation 🔂🎯.
⚠️ This is not financial advice — always conduct your own analysis and manage risk accordingly.

USD/JPY Dips FurtherUSD/JPY Dips Further
USD/JPY declined below 144.50 and is currently consolidating losses.
Important Takeaways for USD/JPY Analysis Today
- USD/JPY is trading in a bearish zone below the 146.10 and 144.90 levels.
- There is a short-term bearish trend line forming with resistance at 144.25 on the hourly chart at FXOpen.
USD/JPY Technical Analysis
On the hourly chart of USD/JPY at FXOpen, the pair started a steady decline from well above the 146.00 zone. The US Dollar gained bearish momentum below the 145.00 support against the Japanese Yen.
The pair even settled below the 144.50 level and the 50-hour simple moving average. There was a spike below 144.00 and the pair traded as low as 143.72. It is now consolidating losses with a bearish angle. Immediate resistance on the USD/JPY chart is near the 23.6% Fib retracement level of the recent decline from the 146.10 swing high to the 143.42 low at 144.25.
There is also a short-term bearish trend line forming with resistance at 144.25. The first major resistance is near the 144.90 zone and the 50% Fib retracement level of the recent decline from the 146.10 swing high to the 143.42 low.
If there is a close above the 144.90 level and the hourly RSI moves above 50, the pair could rise toward 145.50. The next major resistance is near 146.10, above which the pair could test 147.50 in the coming days.
On the downside, the first major support is near 143.70. The next major support is near the 143.20 level. If there is a close below 143.20, the pair could decline steadily. In the stated case, the pair might drop toward the 142.00 support.
This article represents the opinion of the Companies operating under the FXOpen brand only. It is not to be construed as an offer, solicitation, or recommendation with respect to products and services provided by the Companies operating under the FXOpen brand, nor is it to be considered financial advice.

USDJPY:Is it a beginning of major bullish trend? Read CaptionThe price of USDJPY has shown a mixed volume, making it difficult to determine the trend. However, if we analyse the data, we can see that USD is gaining strength in the coming time. This could be due to the strong news coming in this week, which may divert the USDJPY towards the 150 price region. There are four potential targets that price could hit and surpass. Please use this analysis solely for educational purposes, as it does not provide any guarantees.
Good luck and trade safely.
Thanks for your support! 😊
If you’d like to help us out, here are a few things you can do:
- Like our ideas
- Comment on our ideas
- Share our ideas
Team Setupsfx_
❤️

USDJPY and GBPJPY Further drop?Hello traders, this is a complete multiple timeframe analysis of this pair. We see could find significant trading opportunities as per analysis upon price action confirmation we may take this trade. Smash the like button if you find value in this analysis and drop a comment if you have any questions or let me know which pair to cover in my next analysis.

USD/JPY Multi-Timeframe Trading Plan – Week AheadUSD/JPY is trending higher short-term but remains below key resistance on the daily chart. The daily timeframe shows an inverted head-and-shoulders forming, with a neckline at 152. Until that breaks, rallies into 148–150 are likely to fade. The 1-hour chart shows a rising wedge from 142 to 148.5 with support around 145.0. Momentum is slowing, warning of potential exhaustion near 148.
On the 15-minute chart, recent price action shows a bull flag and a double bottom, offering buy zones at 146.10–146.30. The plan for early week is to long dips to this zone, targeting 146.80–147.20 with stops below 145.90. Watch for fades around 147.50–148.00 mid-week. A break above 148.00 opens room to 150.00; below 145.00, momentum shifts bearish.
Strategy: Buy pullbacks early in the week; fade rallies near 148 mid-week. Flip long above 148.00 or short below 145.00. Use tight stops and manage risk per trade.

USDJPY .. LONGOANDA:USDJPY
Price is nearing a critical level around .
No setup, no trade. For me, a solid plan always comes before any prediction.
****If the zone is broken and confirmed with a retest, I’ll adjust my plan accordingly for a possible reverse trade.
USDJPY: Continue to increase in the uptrend channel!USD/JPY's next hurdle is 142.60-142.65. A break above could trigger short-covering, pushing the pair to 143.00, then 143.40-143.45. Sustained buying above 144.00 would confirm a near-term bottom and open the door for a significant rally.

USD/JPY "The Gopher" Forex Bank Heist Plan (Swing/Day)🌟Hi! Hola! Ola! Bonjour! Hallo! Marhaba!🌟
Dear Money Makers & Robbers, 🤑💰✈️
Based on 🔥Thief Trading style technical and fundamental analysis🔥, here is our master plan to heist the USD/JPY "The Gopher" Forex Market. Please adhere to the strategy I've outlined in the chart, which emphasizes short entry. Our aim is the Green Zone. Risky level, oversold market, consolidation, trend reversal, trap at the level where traders and bullish robbers are stronger. 🏆💸"Take profit and treat yourself, traders. You deserve it!💪🏆🎉
Entry 📈 : "The vault is wide open! Swipe the Bearish loot at any price - the heist is on!
however I advise to Place sell limit orders within a 15 or 30 minute timeframe most nearest or swing, low or high level for Pullback Entries.
Stop Loss 🛑:
📌Thief SL placed at the nearest/swing High or Low level Using the 1D timeframe (148.800) Day/Scalping trade basis.
📌SL is based on your risk of the trade, lot size and how many multiple orders you have to take.
Target 🎯: 140.000 (or) Escape Before the Target
💰💵💸USD/JPY "The Gopher" Forex Market Heist Plan (Swing/Day Trade) is currently experiencing a Bearish trend.., driven by several key factors.👇👇👇
📰🗞️Get & Read the Fundamental, Macro, COT Report, Quantitative Analysis, Sentimental Outlook, Intermarket Analysis, Future trend targets... go ahead to check 👉👉👉🔗🔗
Detailed Explanation Recap ✨
Fundamentals: Policy divergence + trade risks ⚖️ favor JPY 💪.
Macro: US slowdown 📉 + Japan resilience 🌱 lift JPY.
Global Markets: Risk-off flows 🛡️ + yield dynamics 📜 boost JPY.
COT: Speculative unwinding 📉 aligns with bearish pressure.
Seasonality: Mild JPY edge in April 🌸.
Intermarket: USD weakness 💸 across assets aids JPY.
Quantitative: Technicals confirm bearish 📉.
Sentiment: Broad bearish tilt 😟, retail as contrarian 🚨.
Trend Prediction: Downward bias 📉 across timeframes.
Outlook: Strong bearish case 🐻 with clear targets.
⚠️Trading Alert : News Releases and Position Management 📰 🗞️ 🚫🚏
As a reminder, news releases can have a significant impact on market prices and volatility. To minimize potential losses and protect your running positions,
we recommend the following:
Avoid taking new trades during news releases
Use trailing stop-loss orders to protect your running positions and lock in profits
💖Supporting our robbery plan 💥Hit the Boost Button💥 will enable us to effortlessly make and steal money 💰💵. Boost the strength of our robbery team. Every day in this market make money with ease by using the Thief Trading Style.🏆💪🤝❤️🎉🚀
I'll see you soon with another heist plan, so stay tuned 🤑🐱👤🤗🤩

USDJPY Long PositionUSDJPY pair is currently positioned at a key support zone, where price action has historically reversed direction. Following a recent rebound from this level, the pair retested the support area. Given the broader uptrend structure (characterized by higher highs and higher lows), this retest presents a potential opportunity to enter long positions, contingent on bullish confirmation at this critical juncture.
Key Observations:
Established Uptrend: The pair’s consistent upward trajectory on higher time frames supports a bullish bias.
Support Retest: The current pullback to the support zone aligns with typical price behavior in trending markets, where retests of prior levels often precede trend resumptions, but a decisive close below the support would invalidate the bullish setup, potentially signaling a trend reversal or deeper correction.
Risk Management Strategy: A prudent approach would involve placing a stop-loss below the support zone to protect against a breakdown, while targeting the next resistance level for profit-taking.
Final Assessment:
The setup aligns with bullish momentum, provided the support holds.

USD/JPY Bullish Breakout Setup: Key Resistance at 144.939 and TaEntry Point: ~144.037
Stop Loss: ~144.939 (above the recent resistance zone)
Resistance Zone: Between 144.037 and 144.939 (highlighted by purple area)
First Target Point (EA Target Point): ~139.731 (Bearish target if reversal happens)
Second Target Point (Bullish EA Target Point): ~148.737
Current Price:
As of the chart, price is around 143.743, slightly below the entry point.
Possible Scenarios:
Bullish Breakout:
If price breaks and closes above 144.939, expect strong bullish momentum toward 148.737.
Confirmation: Look for strong bullish candles with volume above the resistance zone.
Bearish Rejection:
If price fails to break 144.939 and shows bearish reversal patterns (e.g., bearish engulfing), a pullback toward 144.037 or even down to 139.731 is likely.
Additional Notes:
The orange circles highlight key points where price respected trendlines and support zones — showing strong buyer interest.
A rising trendline (drawn underneath recent lows) supports the ongoing bullish structure.
Risk-Reward seems well balanced: small risk (~90 pips) for a potential reward (~400+ pips).
Summary:
Bias: Cautiously bullish, but watch carefully around the 144.939 resistance.
Action: Wait for a clean breakout or a rejection pattern before deciding.

#USDJPY: 2050+ Pips Swing Buy| Trend Confirmed| Comment Views? **FX:USDJPY** A significant market movement has confirmed, indicating the potential for a substantial bullish swing that could reach approximately 2050 pips. Three targets have been identified, allowing you to select the one that aligns best with your analysis. The primary catalyst for this move is the reversal of the Japanese Yen (JPY) to a bearish trend. It is crucial to employ precise risk management techniques and exercise caution during this period.
Good luck and trade safely.
Thanks for your support! 😊
If you want to help us out, here are a few things you can do:
- Like our ideas
- Comment on our ideas
- Share our ideas
Team Setupsfx_
❤️

USDJPY Short Term Buy Trading Plan Update!!!Hi Traders, on April 23rd I shared this idea "USDJPY Short Term Buy Trading Plan"
I expected bullish continuation higher from the marked Fibonacci support zones. You can read the full post using the link above.
Price reached the first Fibonacci support zone, respected it and bounced higher as expected!!!
If you enjoy this idea, don’t forget to LIKE 👍, FOLLOW ✅, SHARE 🙌, and COMMENT ✍! Drop your thoughts and charts below to keep the discussion going. Your support helps keep this content free and reach more people! 🚀
-------------------------------------------------------------------------------------------------------------------
Disclosure: I am part of Trade Nation's Influencer program and receive a monthly fee for using their TradingView charts in my analysis.

USD/JPY Analysis: Exchange Rate Falls Below 140 Yen per DollarUSD/JPY Analysis: Exchange Rate Falls Below 140 Yen per Dollar Today
As shown on the USD/JPY chart today, the exchange rate between the US dollar and Japanese yen has fallen below 140 yen per dollar – marking the first time this has occurred in 2025. Since the beginning of the year, the rate has dropped by approximately 11%.
Among the main driving factors is the White House's tariff policy, which has triggered a sell-off in US government bonds and a weakening of the dollar. One of the more recent developments includes the release of the Consumer Price Index report by the Bank of Japan, which revealed that the CPI remained steady at 2.2%, despite analysts (according to ForexFactory) forecasting a rise to 2.4%.
It’s possible that, due to the lack of inflationary pressure in Japan, the yen is in a relatively stronger position compared to the US currency, where concerns persist that trade wars and Trump’s push for lower interest rates may lead to a spike in inflation and a devaluation of the dollar.
Technical Analysis of the USD/JPY Chart
It’s worth noting that the psychological level of 140 yen per dollar has acted as key support since late 2023. On the rare occasions when the rate has dipped below this mark, the bulls have soon regained confidence, prompting a reversal.
It’s quite possible we may witness a similar attempt on the USD/JPY chart in the coming weeks or even days. However, the current outlook remains bearish, as the price has broken below the Descending Wedge pattern (marked with black lines), indicating that supply is outweighing demand.
This article represents the opinion of the Companies operating under the FXOpen brand only. It is not to be construed as an offer, solicitation, or recommendation with respect to products and services provided by the Companies operating under the FXOpen brand, nor is it to be considered financial advice.

Japanese Yen seems poised to appreciate further against weaker UFrom a technical perspective, the daily Relative Strength Index (RSI) is already flashing slightly oversold conditions and warrants some caution for bearish traders. Hence, it will be prudent to wait for some near-term consolidation or a modest bounce before positioning for an extension of the USD/JPY pair's well-established downtrend witnessed over the past three months or so.
In the meantime, attempted recovery might now confront some resistance near the 141.60-141.65 region. This is followed by the 142.00 round figure and the 142.40-142.45 hurdle, above which a fresh bout of a short-covering move could lift the USD/JPY pair to the 143.00 mark en route to the 143.25-143.30 zone. Any further move up, however, might still be seen as a selling opportunity.
On the flip side, a sustained break and acceptance below the 141.00 mark could be seen as a fresh trigger for bearish traders and makes the USD/JPY pair vulnerable. The subsequent downfall below the 140.45-140.40 intermediate support might expose the 140.00 psychological mark. The downward trajectory could extend to the 2024 yearly swing low, around the 139.60-139.55 region.

#USDJPY: Huge Risk To Buy Read The Description
Trading JPY pairs is risky due to the market’s volatility.
USDJPY fell below our buying zone due to JPY’s bullishness and USD’s weakness. While USD has yet to recover, JPY is consolidating. The market is undecided, leading to unusual market movements. We have three targets in this chart analysis. Use it as an alternative bias and have your own analysis and trade management.
Thanks for your support. We expect it to increase, helping us post more analysis.
Much Love🧡
Team Setupsfx

USD/JPY Bearish Reversal Setup – Short from Resistance ZoneCurrent Price: ~146.252
EMA 30 (Red): ~146.573
EMA 200 (Blue): ~146.662
The price is below both EMAs, suggesting short-term bearish momentum.
📉 Trade Setup:
Entry Point: 146.551 (marked on the chart)
Stop Loss (SL): 148.514 (above resistance zone)
Take Profit (TP): 142.374 (marked as “EA TARGET POINT”)
Risk/Reward Ratio (RR): Approx. 1:2.5+
📌 Zone Analysis:
Resistance Zone: 147.6 – 148.5 (highlighted in purple)
Previous highs rejected from this level multiple times.
Sellers appear to be defending this zone strongly.
Support Zone: 142.3 – 143.0
Previous accumulation zone marked for the TP.
🧠 Bias & Interpretation:
Bearish Bias: Confirmed by:
Price rejection from resistance.
Below both EMA 30 & EMA 200.
Bearish engulfing patterns near the resistance zone.
Potential Strategy: Short from 146.551 targeting 142.374 with tight SL at 148.514.
⚠️ Watch for:
Any bullish crossover between EMA 30 and EMA 200 could shift momentum.
False breakouts above the resistance zone before actual reversal.
Key U.S. or Japan news that may cause volatility.

USDJPY Breakdown?Hello traders, this is a complete multiple timeframe analysis of this pair. We see could find significant trading opportunities as per analysis upon price action confirmation we may take this trade. Smash the like button if you find value in this analysis and drop a comment if you have any questions or let me know which pair to cover in my next analysis.

USD/JPY "The Ninja" Forex Bank Heist Plan (Swing/Scalping Trade)🌟Hi! Hola! Ola! Bonjour! Hallo! Marhaba!🌟
Dear Money Makers & Robbers, 🤑 💰💸✈️
Based on 🔥Thief Trading style technical and fundamental analysis🔥, here is our master plan to heist the USD/JPY "The Ninja" Forex Bank. Please adhere to the strategy I've outlined in the chart, which emphasizes long entry. Our aim is the high-risk Red Zone. It's Risky level, overbought market, consolidation, trend reversal, trap at the level where traders and bearish robbers are stronger. 🏆💸"Take profit and treat yourself, traders. You deserve it!💪🏆🎉
Entry 📈 : "The heist is on! Wait for the MA breakout then make your move - Bullish profits await!"
however I advise to Place Buy stop orders above the Moving average 151.500 (or) Place buy limit orders within a 15 or 30 minute timeframe most recent or swing, low or high level.
📌I strongly advise you to set an "alert (Alarm)" on your chart so you can see when the breakout entry occurs.
Stop Loss 🛑:
Thief SL placed at the nearest / swing low level Using the 5H timeframe (149.500) Day / swing trade basis.
SL is based on your risk of the trade, lot size and how many multiple orders you have to take.
🏴☠️Target 🎯: 155.000 (or) Escape Before the Target
🧲Scalpers, take note 👀 : only scalp on the Long side. If you have a lot of money, you can go straight away; if not, you can join swing traders and carry out the robbery plan. Use trailing SL to safeguard your money 💰.
💵💰USD/JPY "The Ninja" Forex Bank Heist Plan (Swing/Scalping Trade) is currently experiencing a bullishness,., driven by several key factors.
📰🗞️Get & Read the Fundamental, Macro, COT Report, Quantitative Analysis, Sentimental Outlook, Intermarket Analysis, Future trend targets.... go ahead to check 👉👉👉🔗
⚠️Trading Alert : News Releases and Position Management 📰 🗞️ 🚫🚏
As a reminder, news releases can have a significant impact on market prices and volatility. To minimize potential losses and protect your running positions,
we recommend the following:
Avoid taking new trades during news releases
Use trailing stop-loss orders to protect your running positions and lock in profits
💖Supporting our robbery plan 💥Hit the Boost Button💥 will enable us to effortlessly make and steal money 💰💵. Boost the strength of our robbery team. Every day in this market make money with ease by using the Thief Trading Style.🏆💪🤝❤️🎉🚀
I'll see you soon with another heist plan, so stay tuned 🤑🐱👤🤗🤩

USD/JPY "The Ninja" Forex Bank Bullish Heist Plan🌟Hi! Hola! Ola! Bonjour! Hallo! Marhaba!🌟
Dear Money Makers & Robbers, 🤑 💰💸✈️
Based on 🔥Thief Trading style technical and fundamental analysis🔥, here is our master plan to heist the USD/JPY "The Ninja" Forex Bank. Please adhere to the strategy I've outlined in the chart, which emphasizes long entry. Our aim is the high-risk Red Zone. Risky level, overbought market, consolidation, trend reversal, trap at the level where traders and bearish robbers are stronger. 🏆💸Book Profits Be wealthy and safe trade.💪🏆🎉
Entry 📈 : "The vault is wide open! Swipe the Bullish loot at any price - the heist is on!
however I advise to Place buy limit orders within a 15 or 30 minute timeframe most recent or swing, low or high level. I Highly recommended you to put alert in your chart.
Stop Loss 🛑:
Thief SL placed at the recent / nearest low level Using the 1H timeframe (148.250) swing trade basis.
SL is based on your risk of the trade, lot size and how many multiple orders you have to take.
🏴☠️Target 🎯: 152.300 (or) Escape Before the Target
🧲Scalpers, take note 👀 : only scalp on the Long side. If you have a lot of money, you can go straight away; if not, you can join swing traders and carry out the robbery plan. Use trailing SL to safeguard your money 💰.
USD/JPY "The Ninja" Forex Bank Heist Plan (Day Trade) is currently experiencing a bullishness,., driven by several key factors.
📰🗞️Get & Read the Fundamental analysis, Macro Economics, COT Report, Quantitative Analysis, Intermarket Analysis, Sentimental Outlook, Positioning and future trend...
Before start the heist plan read it.👉👉👉
📌Keep in mind that these factors can change rapidly, and it's essential to stay up-to-date with market developments and adjust your analysis accordingly.
⚠️Trading Alert : News Releases and Position Management 📰 🗞️ 🚫🚏
As a reminder, news releases can have a significant impact on market prices and volatility. To minimize potential losses and protect your running positions,
we recommend the following:
Avoid taking new trades during news releases
Use trailing stop-loss orders to protect your running positions and lock in profits
💖Supporting our robbery plan 💥Hit the Boost Button💥 will enable us to effortlessly make and steal money 💰💵. Boost the strength of our robbery team. Every day in this market make money with ease by using the Thief Trading Style.🏆💪🤝❤️🎉🚀
I'll see you soon with another heist plan, so stay tuned 🤑🐱👤🤗🤩

USDJPY hourly trend analysis for April 04, 2025USDJPY is bearish with a short signal confirmation with stop loss at 146.29. Further downtrend will take the support level at 144.435.

USD/JPY "The Ninja" Forex Bank Heist Plan (Day / Scalping Trade)🌟Hi! Hola! Ola! Bonjour! Hallo! Marhaba!🌟
Dear Money Makers & Robbers, 🤑 💰💸✈️
Based on 🔥Thief Trading style technical and fundamental analysis🔥, here is our master plan to heist the USD/JPY "The Ninja" Forex Bank . Please adhere to the strategy I've outlined in the chart, which emphasizes long entry. Our aim is the high-risk Red Zone. Risky level, overbought market, consolidation, trend reversal, trap at the level where traders and bearish robbers are stronger. 🏆💸"Take profit and treat yourself, traders. You deserve it!💪🏆🎉
Entry 📈 : "The vault is wide open! Swipe the Bullish loot at any price - the heist is on!
however I advise to Place buy limit orders within a 15 or 30 minute timeframe most recent or swing, low or high level.
Stop Loss 🛑:
Thief SL placed at the recent/swing low level Using the 1H timeframe (148.600) Day / scalping trade basis.
SL is based on your risk of the trade, lot size and how many multiple orders you have to take.
🏴☠️Target 🎯: 152.400 (or) Escape Before the Target
🧲Scalpers, take note 👀 : only scalp on the Long side. If you have a lot of money, you can go straight away; if not, you can join swing traders and carry out the robbery plan. Use trailing SL to safeguard your money 💰.
USD/JPY "The Ninja" Forex Bank Heist Plan (Day/Scalping Trade) is currently experiencing a bullishness,., driven by several key factors.
📰🗞️Get & Read the Fundamental, Macro, COT Report, Quantitative Analysis, Sentimental Outlook, Intermarket Analysis, Future trend targets.. go ahead to check 👉👉👉🔗
⚠️Trading Alert : News Releases and Position Management 📰 🗞️ 🚫🚏
As a reminder, news releases can have a significant impact on market prices and volatility. To minimize potential losses and protect your running positions,
we recommend the following:
Avoid taking new trades during news releases
Use trailing stop-loss orders to protect your running positions and lock in profits
💖Supporting our robbery plan 💥Hit the Boost Button💥 will enable us to effortlessly make and steal money 💰💵. Boost the strength of our robbery team. Every day in this market make money with ease by using the Thief Trading Style.🏆💪🤝❤️🎉🚀
I'll see you soon with another heist plan, so stay tuned 🤑🐱👤🤗🤩
