Usdjpy signal USD/JPY is sitting at multi-decade highs shy of 154.00 in the European session on Monday. The Japanese Yen continues to be undermined by the BoJ’s uncertain outlook about future rate hikes. Intervention fears and persistent geopolitical tensions could help limit losses for the safe-haven JPY.
From a technical perspective, the post-US CPI breakout through a two-week-old trading range resistance near the 152.00 mark favors bullish traders. That said, the Relative Strength Index (RSI) on the daily chart – though it has eased from higher levels – is hovering near overbought territory. This makes it prudent to wait for some near-term consolidation or a modest pullback before positioning for any further appreciating move. In the meantime, the multi-decade high, around the 153.25-153.30 region, now seems to act as an immediate hurdle, above which the USD/JPY pair could aim to reclaim the 154.00 round figure.
On the flip side, any meaningful corrective decline below the overnight swing low, around the 152.75 zone, is more likely to attract fresh buyers and remain limited near the trading range breakout point, now turned support, near the 152.00 mark. The said handle should now act as a strong base for the USD/JPY pair, which, if broken decisively, might prompt some profit-taking and pave the way for a slide towards the 151.40 intermediate support en route to the 151.00 round figure. Some follow-through selling will suggest that spot prices have topped out in the near term and shift the bias in favor of bearish traders.
USD/JPY is the forex ticker that shows the value of the US Dollar against the Japanese Yen. It tells traders how many Yen are needed to buy a US Dollar. The Dollar-Yen is one of the most traded forex pairs - second only to EUR/USD - and is a benchmark for Asian economic health and even the global economy. View the live Dollar-Yen rate with the USD/JPY chart and improve your technical and fundamental analysis with the latest USD/JPY forecast, news and analysis.
Confirm Chart
Usdjpytrade

usd jpy buy USD/JPY ascends following a US inflation report indicating reacceleration, challenging levels that might prompt intervention. Rising inflation figures push Treasury yields higher and boost the US Dollar. Market anticipates future Fed actions with keen interest in upcoming monetary policy minutes.
From a technical standpoint, the USD/JPY is trading at levels that were seen in the 1990s. With the major extending its gains past 152.00, that exposes as the next resistance level, the June 1990 highest peak at 155.78, followed by the 1990’s high at 160.32. On the flip side, the first support would be the psychological 152.00 level, followed by the Tenkan-Sen at 151.77 and the April 5 low of 150.81.
USD/JPY is the forex ticker that shows the value of the US Dollar against the Japanese Yen. It tells traders how many Yen are needed to buy a US Dollar. The Dollar-Yen is one of the most traded forex pairs - second only to EUR/USD - and is a benchmark for Asian economic health and even the global economy. View the live Dollar-Yen rate with the USD/JPY chart and improve your technical and fundamental analysis with the latest USD/JPY forecast, news and analysis.

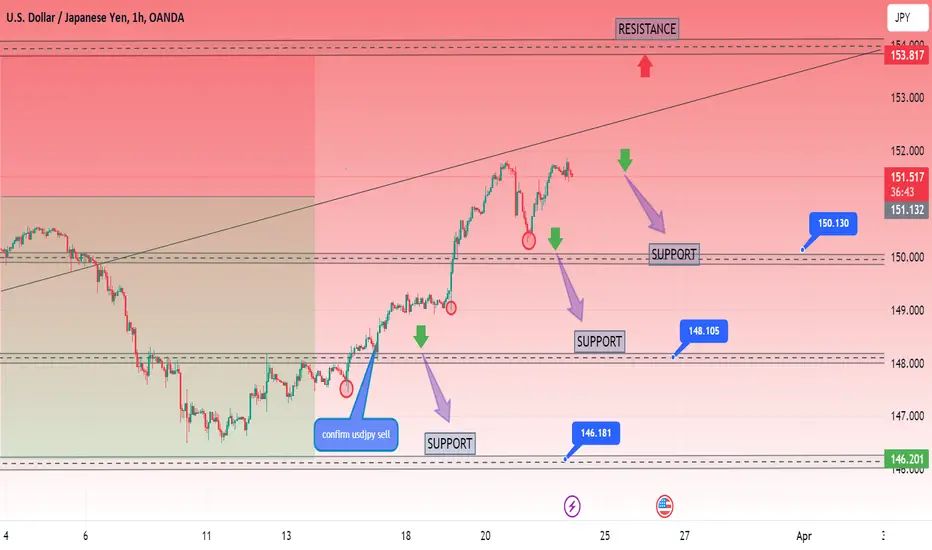
Usdjpy short USD/JPY is the forex ticker that shows the value of the US Dollar against the Japanese Yen. It tells traders how many Yen are needed to buy a US Dollar. The Dollar-Yen is one of the most traded forex pairs - second only to EUR/USD - and is a benchmark for Asian economic health and even the global economy. View the live Dollar-Yen rate with the USD/JPY chart and improve your technical and fundamental analysis with the latest USD/JPY forecast, news and analysis.
The Japanese Yen struggles to capitalize on the overnight modest uptick against the USD. The BoJ’s dovish stance undermines the JPY, though intervention fears limit the downside. Reduced bets for a June Fed rate cut should lend support to the Greenback and USD/JPY.
Once surpassed, the next support emerges at the Senkou Span A at 10.17, followed by the Kijun-Sen at 149.23. Further weakness in the pair could send it toward the Senkou Span B at 148.93, well inside the Ichimoku Cloud (Kumo).
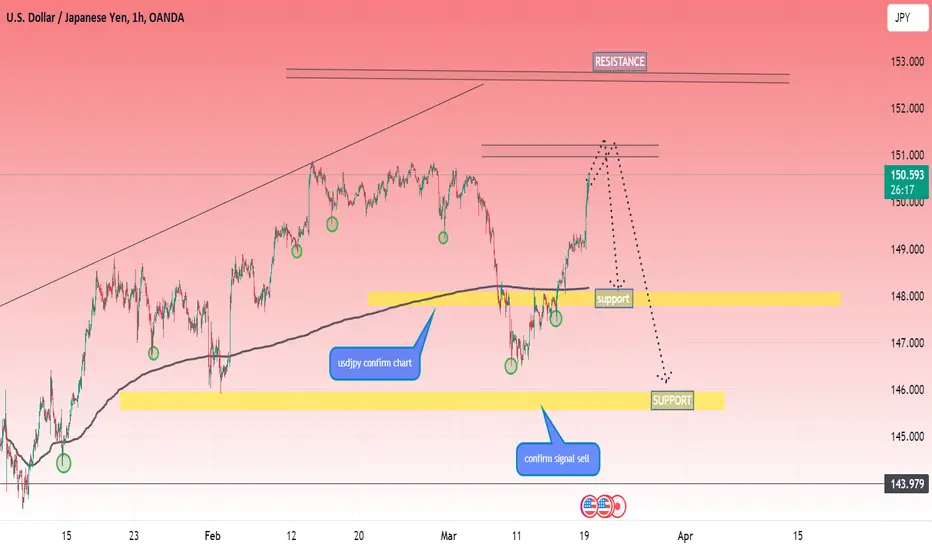
Confirm signal

usdjpy shortUSD/JPY is the forex ticker that shows the value of the US Dollar against the Japanese Yen. It tells traders how many Yen are needed to buy a US Dollar. The Dollar-Yen is one of the most traded forex pairs - second only to EUR/USD - and is a benchmark for Asian economic health and even the global economy. View the live Dollar-Yen rate with the USD/JPY chart and improve your technical and fundamental analysis with the latest USD/JPY forecast, news and analysis.
The Japanese Yen fails to lure buyers despite intervention fears and the risk-off impulse. The BoJ’s cautious outlook continues to undermine the JPY and lend support to USD/JPY. Reduced bets for a June Fed rate cut lift the USD to a multi-week top and act as a tailwind.
From a technical perspective, the range-bound price action witnessed over the past two weeks or so might still be categorized as a bullish consolidation phase against the backdrop of the recent rally from the March swing low. Moreover, oscillators on the daily chart are holding comfortably in the positive territory and have also eased from overbought conditions, suggesting that the path of least resistance for the USD/JPY pair is to the upside. That said, it will still be prudent to wait for a move beyond a multi-decade high, around the 152.00 mark set last week, before positioning for any further gains.

USDJPY Technical Analysis and Trade IdeaThe USDJPY currency pair has recently exhibited a bullish trend. However, it has been consolidating sideways for an extended period, lacking a clear directional bias. In our video analysis, we explore a couple of scenarios and provide detailed insights regarding price action considerations. Notably, we look for heightened volatility as liquidity is tested both above and below the current range. We anticipate a trend to emerge at some point. Currently, we are examining a 15-minute chart for potential trade opportunities, as discussed in the video. As always, this information is strictly for educational purposes and should not be construed as financial advice.

USDJPY SELL | Day Trading AnalysisHello Traders, here is the full analysis.
I think we can soon see more fall from this range! GOOD LUCK! Great SELL opportunity USDJPY
I still did my best and this is the most likely count for me at the moment.
Support the idea with like and follow my profile TO SEE MORE.
Traders, if you liked this idea or if you have your own opinion about it, write in the comments. I will be glad 🤝
Patience is the If You Have Any Question, Feel Free To Ask 🤗
Just follow chart with idea and analysis and when you are ready come in THE GROVE | VIP GROUP, earn more and safe, wait for the signal at the right moment and make money with us💰

USDJPY - SELL SIGNALThe drop in FX volatility after last week’s action is being helped by the PBoC's stabilisation of the Yuan and should not help the Yen, which remains the most popular funding currency for carry trades.
Verbal interventions in Japan and the softer Dollar momentum are helping a bit, but the current environment suggests a recovery in JPY remains even more strictly tied to US rates breaking lower.
My call remains bearish on USD/JPY moving forward, but in the very short term, the pair may retest the 152.00+ ‘verbal intervention’ area.
Guys, what do you think? Leave a comment with your thoughts.

usdjpy signalUSD/JPY is the forex ticker that shows the value of the US Dollar against the Japanese Yen. It tells traders how many Yen are needed to buy a US Dollar. The Dollar-Yen is one of the most traded forex pairs - second only to EUR/USD - and is a benchmark for Asian economic health and even the global economy. View the live Dollar-Yen rate with the USD/JPY chart and improve your technical and fundamental analysis with the latest USD/JPY forecast, news and analysis.
From a technical perspective, last week's swing high, around the 151.85 region, could act as an immediate hurdle. Some follow-through buying beyond the multi-decade high, around the 152.00 mark touched in November 2022, will be seen as a fresh trigger for bullish traders. The USD/JPY pair might then build on its well-established uptrend witnessed since January 2023. On the flip side, the 151.00 mark now seems to have emerged as strong support, below which spot prices could accelerate the fall to the 150.25 region. This is followed by the 150.00 psychological mark, which, if broken, will expose the next relevant support near the 149.35-149.30 region before the pair eventually drops to the 149.00 round-figure mark.

UsdJpy sellUSD/JPY is the forex ticker that shows the value of the US Dollar against the Japanese Yen. It tells traders how many Yen are needed to buy a US Dollar. The Dollar-Yen is one of the most traded forex pairs - second only to EUR/USD - and is a benchmark for Asian economic health and even the global economy. View the live Dollar-Yen rate with the USD/JPY chart and improve your technical and fundamental analysis with the latest USD/JPY forecast, news and analysis.
The Japanese Yen edges higher following the release of Japanese consumer inflation data. The uncertainty over the BoJ’s future policy steps keeps a lid on any further positive move. A modest US Dollar downtick exerts some pressure, though the downside remains limited.
The USD/JPY pair finds support after correcting to near 150.27 in the European session on Thursday. The asset rebounds as the US Dollar recovers after refreshing a five-day low. The US Dollar Index (DXY) bounces back from 103.17 as the Federal Reserve’s (Fed) latest economic projections showed that the United States growth rate for 2024 was revised higher to 2.1% from 1.4% forecasted in December’s policy meeting.
usd jpy shortUSD/JPY is the forex ticker that shows the value of the US Dollar against the Japanese Yen. It tells traders how many Yen are needed to buy a US Dollar. The Dollar-Yen is one of the most traded forex pairs – second only to EUR/USD – and is a benchmark for Asian economic health and even the global economy. View the live Dollar-Yen rate with the USD/JPY chart and improve your technical and fundamental analysis with the latest USD/JPY forecast, news and analysis.
USD/JPY is the forex ticker that shows the value of the US Dollar against the Japanese Yen. It tells traders how many Yen are needed to buy a US Dollar. The Dollar-Yen is one of the most traded forex pairs – second only to EUR/USD – and is a benchmark for Asian economic health and even the global economy. View the live Dollar-Yen rate with the USD/JPY chart and improve your technical and fundamental analysis with the latest USD/JPY forecast, news and analysis.
The USD/JPY pair exhibits strength above the crucial support of 149.00 in the early New York session. The asset clings to gains as market expectations for the Bank of Japan (BoJ) delaying its plans to exit negative interest rates and scrap Yield Curve Control (YCC) have escalated.
USDJPY H2 / Possible Reversal from OB and Supply Area✅💡Hello Traders!
This is my idea related to USDJPY H2. I expect another retracement in the OB level and after that I will execute a long trade in case of confirmation. I see the price to go up until the level of 149.500.
Wait for confirmation!
Apply Risk Management!
Traders, if my proposal resonates with you or if you hold a divergent viewpoint regarding this trade, feel free to share your thoughts in the comments. I welcome the opportunity to hear your perspectives.
____________________________________
Follow, like, and comment to see my content:
www.tradingview.com

usdjpy sell USD/JPY is the forex ticker that shows the value of the US Dollar against the Japanese Yen. It tells traders how many Yen are needed to buy a US Dollar. The Dollar-Yen is one of the most traded forex pairs – second only to EUR/USD – and is a benchmark for Asian economic health and even the global economy. View the live Dollar-Yen rate with the USD/JPY chart and improve your technical and fundamental analysis with the latest USD/JPY forecast, news and analysis.
Although Powell's remarks leaned towards the hawkish side, they were nothing new: they merely echoed the sentiment expressed in the previous central bank meeting. In this context, traders took today’s developments as “no news is good news”, giving little incentive to yields and greenback’s bulls to charge.

USDJPY SELL USD/JPY: Japanese Yen remains confined in a multi-week-old trading band against USDThe Japanese Yen struggles to capitalize on Tuesday’s Tokyo CPI-inspired gains. The BoJ policy uncertainty is holding back the JPY bulls from placing fresh bets. Subdued USD price action caps USD/JPY ahead of US data, Powell’s testimony.The USD/JPY pair falls sharply to the psychological support of 150.00 in early American session on Tuesday as hopes of Bank of Japan (BoJ) quitting the decade-long expansionary policy stance have escalated.USD/JPY is the forex ticker that shows the value of the US Dollar against the Japanese Yen. It tells traders how many Yen are needed to buy a US Dollar. The Dollar-Yen is one of the most traded forex pairs – second only to EUR/USD – and is a benchmark for Asian economic health and even the global economy. View the live Dollar-Yen rate with the USD/JPY chart and improve your technical and fundamental analysis with the latest USD/JPY forecast, news and analysis CONFIRM SIGNAL

USDJPY SELL CONFIRM SIGNAL USD/JPY tumbles to 150.00 as prospects of BoJ exiting dovish policy stance deepensUSD/JPY slumps to 150.00, hoping the BoJ will exit the dovish policy stance sooner. Japan’s Murai is optimist on a positive cycle of rising growth, improving wage outlook. Fed Powell is expected to maintain a hawkish narrative on interest rates.The USD/JPY pair falls sharply to the psychological support of 150.00 in early American session on Tuesday as hopes of Bank of Japan (BoJ) quitting the decade-long expansionary policy stance have escalated.USD/JPY is the forex ticker that shows the value of the US Dollar against the Japanese Yen. It tells traders how many Yen are needed to buy a US Dollar. The Dollar-Yen is one of the most traded forex pairs – second only to EUR/USD – and is a benchmark for Asian economic health and even the global economy. View the live Dollar-Yen rate with the USD/JPY chart and improve your technical and fundamental analysis with the latest USD/JPY forecast, news and analysis CONFIRM


usd jPY LONGThe Japanese Yen drifts lower on Friday and moves away from over a two-week high. The BoJ policy uncertainty and the risk-on environment undermine the safe-haven JPY. Hawkish Fed expectations underpin the USD and remain supportive of the momentum.
rom a technical perspective, any subsequent move up is likely to confront stiff resistance near the 150.65-150.70 region. This is closely followed by a multi-month peak, around the 150.90 zone touched on February 13, which if cleared decisively will be seen as a fresh trigger for bullish traders. Given that oscillators on the daily chart are holding comfortably in the positive territory, the USD/JPY pair might then climb to the 151.45 hurdle en route to the 152.00 neighbourhood, or a multi-decade peak set in October 2022 and retested in November 2023.

USD JPY Long The Japanese Yen drifts lower on Friday and moves away from over a two-week high. The BoJ policy uncertainty and the risk-on environment undermine the safe-haven JPY. Hawkish Fed expectations underpin the USD and remain supportive of the momentum.
USD/JPY is the forex ticker that shows the value of the US Dollar against the Japanese Yen. It tells traders how many Yen are needed to buy a US Dollar. The Dollar-Yen is one of the most traded forex pairs – second only to EUR/USD – and is a benchmark for Asian economic health and even the global economy. View the live Dollar-Yen rate with the USD/JPY chart and improve your technical and fundamental analysis with the latest USD/JPY forecast, news and analysis.
Confirm Chart

USDJPYPair : USDJPY ( U.S Dollar / Japanese Yen )
Description :
Rising Wedge as an Corrective Pattern in Short Time Frame with the Breakout of the Lower Trend Line
RSI - Divergence
Break of Structure
Completed " 123 " Impulsive Waves

USDJPY → About to Breakout to New Highs? Let's Maximize Profits!USDJPY is on its third leg up in this bull channel that started at 141.000. We're near the top of Resistance Zone, is a long justified?
How do we trade this? 🤔
We need confirmation of a breakout to justify a long. After the initial bull run to 152.000, USDJPY pulled back with three legs to 140.200 and followed with a run to our current position of just over 149.000. The price action is technically at a new high in this run which could be the top of the third and final leg up.
Given the two strong bull bar closes on February 2nd and 8th and the lack of a sell signal, I do not believe this leg is over yet. What we need is a close above the Resistance Zone at 150.000 followed by a test of the top of Resistance as support. Once we see that support, it's reasonable to enter a long position with a 1:2 Risk/Reward Ratio. Take half profits at 1:1 Risk/Reward which is 151.200, move the stop loss up to the entry price to lock in profits, then swing the second half above the previous 152.000 high. 152.000 is a significant resistance area and I would be cautious to assume we'll make it to that price, however, the trend is our friend until the very end. Until we have a reason to change our bias, we must remain long.
💡 Trade Idea 💡
Long Entry: 150.385
🟥 Stop Loss: $149.250
✅ Take Profit #1: $151.200
✅ Take Profit #2: $152.650
⚖️ Risk/Reward Ratio: 1:2
🔑 Key Takeaways 🔑
1. Two strong legs up in a micro bull channel.
2. Third leg in progress, strong bull bar closes on February 2nd and 8th, indicating more upward momentum.
3. Near the top of the Resistance Zone, wait for a close above and test of Resistance as Support.
4. Enter a 1:2 Risk/Reward trade taking half profits at 1:1 Risk/Reward.
5. RSI at 63.00 and above the moving average, supports long bias.
💰 Trading Tip 💰
The longer a trend continues after 3 legs, the probability of that trend continuing lessens. Because of this decreased probability, we ought to reduce our risk when entering trades.
⚠️ Risk Warning! ⚠️
Past performance is not necessarily indicative of future results. You are solely responsible for your trades. Trade at your own risk!
Like 👍 and Follow to learn more about:
1. Reading Price Action
2. Chart Analysis
3. Trade Management
4. Trading Psychology

USDJPYPair : USDJPY ( U.S Dollar / Japanese Yen )
Description :
Bullish Channel as an Correction Pattern in Short Time Frame with the Breakout of the Lower Trend Line
Break of Structure
Consolidation Phase
Completed " 1234 " Impulsive Waves
RSI - Divergence

Usdjpy short USD/JPY is the forex ticker that shows the value of the US Dollar against the Japanese Yen. It tells traders how many Yen are needed to buy a US Dollar. The Dollar-Yen is one of the most traded forex pairs – second only to EUR/USD – and is a benchmark for Asian economic health and even the global economy. View the live Dollar-Yen rate with the USD/JPY chart and improve your technical and fundamental analysis with the latest USD/JPY forecast, news and analysis.
Inflation in Japan printed better-than-expected for the month of January, coming in at 2.2% vs the prior 2.6%. Markets appear to have bushed aside the recent easing of price pressures as inflation has been falling every month since October’s 3.3%. Instead they remain focused on the fact that the headline measure remains above 2% and the core figure surpassed expectations of 1.8% to come in at 2%.
The Japanese Yen (JPY) strenghtens during the Asian session on Tuesday following the release of slightly hotter-than-expected Japanese consumer inflation figures, which revived bets for an imminent shift in the Bank of Japan's (BoJ) policy stance.

Usdjpy Japanese Yen remains supported by reviving BoJ pivot bets, US data in focus
The Japanese Yen (JPY) strenghtens during the Asian session on Tuesday following the release of slightly hotter-than-expected Japanese consumer inflation figures, which revived bets for an imminent shift in the Bank of Japan's (BoJ) policy stance.
USD/JPY is the forex ticker that shows the value of the US Dollar against the Japanese Yen. It tells traders how many Yen are needed to buy a US Dollar. The Dollar-Yen is one of the most traded forex pairs – second only to EUR/USD – and is a benchmark for Asian economic health and even the global economy. View the live Dollar-Yen rate with the USD/JPY chart and improve your technical and fundamental analysis with the latest USD/JPY forecast, news and analysis. [

USDJPY M15 / Potential Long Move, Waiting for Confirmation✅Hello Traders!
This is my idea related to USDJPY M15. I want to see the BOSS from the price of 149.870 to be taken, after that, I will look for a long entry and the target will be above the higher boss.
Traders, if you liked my idea or if you have a different vision related to this trade, write in the comments. I will be glad to see your perspective.
____________________________________
Follow, like, and comment to see my content:
www.tradingview.com
