14.07.2025 #USDMXNBUY 18.6500 | STOP 18.5700 | TAKE 18.7500 | Price movement in a wide local range around a strong support level.
USDMXN
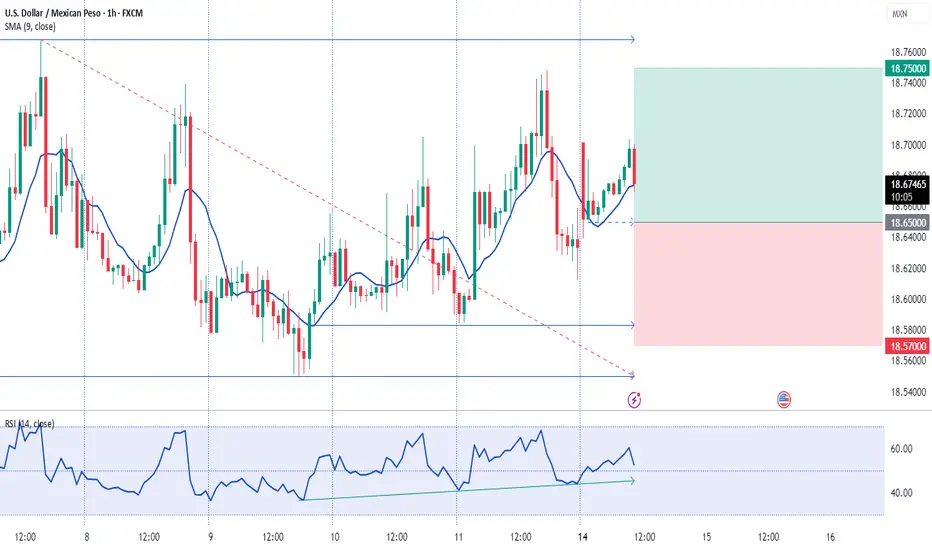
USD/MXN Testing Downtrend Resistance – Bearish Channel Remains IThe USD/MXN pair continues to grind lower within a well-defined descending channel, marked by a series of lower highs and lower lows since April. Although the pair has shown short-term stability near 18.58 support, the broader trend remains bearish.
Price is currently testing the channel’s upper boundary near 18.70, with both the 50-day and 200-day SMAs well above current levels, reinforcing the downside bias. Any bounce is likely to face headwinds unless bulls manage to push the pair back above 19.07 and 19.49 — prior swing levels and confluence zones with moving averages.
Indicators:
MACD remains below zero, showing persistent bearish momentum despite some recent flattening.
RSI sits at 36, indicating mild oversold conditions but with no strong reversal signal yet.
Key Levels:
Support: 18.58 (recent low and channel support).
Resistance: 18.70 (channel top), followed by 19.07 and 19.49.
Conclusion:
USD/MXN remains pressured within a bearish structure. A breakout above 18.70 may trigger short-covering toward the 19.00–19.50 zone, but bears remain in control while price stays beneath key moving averages. Watch for a decisive break of either channel boundary to determine directional bias going forward.
-MW

RSI divergent, suggesting a bounceThe USDMXN has been in a descending channel since spring of this year, but is near channel support with a strongly divergent RSI. Since the MXN has gained about 10% against the US Dollar since the beginning of the year, however rate differentials are tightening, the appetite for MXN at current levels may be waning. It's not time to be outright bullish the USD over the MXN, but a break back above the 18.8500 level may suggest that time may be near.
Is Mexico's Peso at the Crossroads?The recent imposition of U.S. sanctions on three Mexican financial institutions - CIBanco, Intercam Banco, and Vector Casa de Bolsa - has ignited a crucial debate over the Mexican peso's stability and the intricate dynamics of U.S.-Mexico relations. Washington accuses these entities of laundering millions for drug cartels and facilitating fentanyl precursor payments, marking the first actions under new anti-fentanyl legislation. While these institutions collectively hold a relatively small portion of Mexico's total banking assets (less than 3%), the move carries significant symbolic weight and prompts a re-evaluation of the peso's outlook. The Mexican government, under President Claudia Sheinbaum, swiftly rejected the allegations, demanding concrete evidence and initiating its investigations, including the temporary regulatory intervention of CIBanco and Intercam to safeguard depositors.
Economically, the peso faces a nuanced landscape. Before the sanctions, the Mexican peso (MXN) demonstrated remarkable resilience, appreciating significantly against the dollar, bolstered by Mexico's comparatively higher interest rates and robust trade flows with the U.S. However, the recent divergence in monetary policy, with **Banxico** easing rates while the U.S. Federal Reserve maintains a hawkish stance, now presents a potential headwind for the peso. While analysts generally suggest limited systemic risk to Mexico's broader financial system from these targeted sanctions, the action introduces an element of uncertainty. It raises concerns about potential capital flight, increased compliance costs for other Mexican financial institutions, and a possible erosion of investor confidence, factors that could exert downward pressure on the peso.
Geopolitically, these sanctions underscore the escalating U.S. campaign against fentanyl trafficking, now intricately linked with broader trade and security tensions. President Donald Trump's past threats of punitive tariffs on Mexican imports - aimed at curbing drug flows - highlight the volatile nature of this bilateral relationship. The sanctions serve as a potent political message from Washington, signaling its resolve to combat the fentanyl crisis on all fronts, including financial pipelines. This diplomatic friction, coupled with the ongoing complexities of migration and security cooperation, creates a challenging backdrop for the USD/MXN exchange rate. While the U.S. and Mexico maintain a strong intergovernmental relationship, these pressures test the limits of their collaboration and could influence the peso's trajectory in the medium term.

USDMXN | 26.06.2025BUY 18.8700 | STOP 18.8100 | TAKE 18.9500 | The Bank of Mexico will probably not increase interest rates in the coming months. we expect the pair to resume its growth towards the level of 19.0000.

USDMXN | 21.06.2025BUY 19.1500 | STOP 18.7500 | TAKE 19.7000 | The Bank of Mexico is expected to continue its rate easing cycle next week, despite recent reports on Mexican inflation suggesting risks are skewed to the upside. Inflation in May exceeded the bank's 3% target, raising concerns that the central bank will continue to cut rates. From a technical perspective, the price is moving upwards within a long-term channel in the medium term and is pushing away from the strong support level of 18.8200.

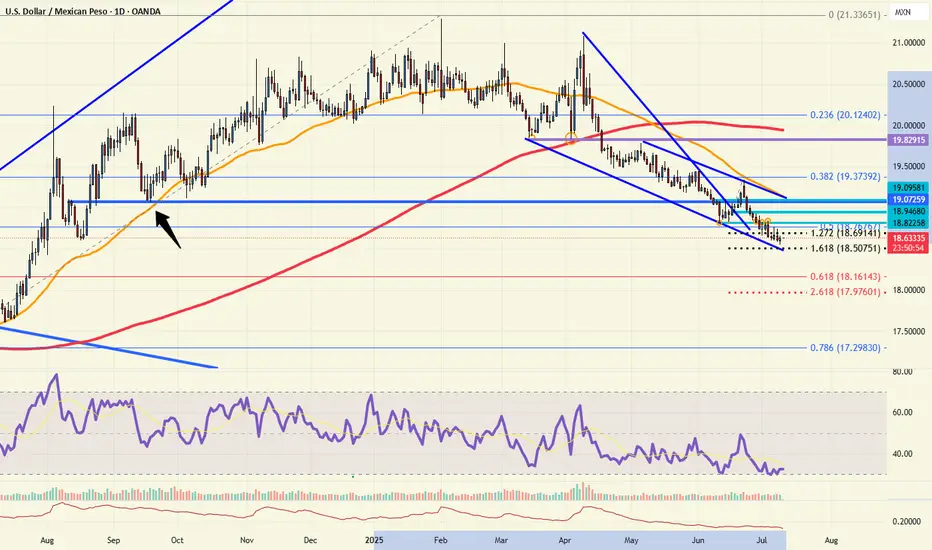
USD/MXN: Bearish Momentum Persists, Testing Key SupportUSD/MXN continues to grind lower, maintaining a persistent downtrend that has remained intact since mid-April. The pair is currently hovering near a short-term support area just above 19.00, with little sign of bullish reversal as of now.
🔍 Technical Breakdown
Bearish Structure: Price remains below both the 50-day (19.63) and 200-day (20.02) SMAs, with both averages now pointing lower — confirming the strength of the ongoing bearish trend.
Momentum Indicators:
MACD remains firmly in negative territory with a persistent bearish histogram, suggesting downside momentum is not yet exhausted.
RSI is approaching oversold levels, currently at 34. While not yet in extreme territory, it hints that the pair may be nearing a potential short-term pause or bounce.
Support & Resistance:
Price is testing a minor support zone around 19.00, with the next significant level lower coming in near 18.58, a level last seen in early Q3 2023.
On the upside, initial resistance stands at the breakdown point near 19.49, followed by stronger resistance at the confluence of moving averages.
⚙️ Outlook
USD/MXN is trading firmly within a well-defined downtrend, marked by lower highs and lower lows. As long as price remains below the 50-day SMA, the bias remains bearish. While the RSI suggests some caution is warranted as the pair approaches oversold conditions, there is no definitive bullish divergence or reversal pattern yet.
If the current support gives way, bears could target deeper retracements. Conversely, a sustained rebound back above 19.49 would be needed to challenge the bearish structure.
-MW

USDMXN: The Mexican Peso Continues to StrengthenOver the last four trading sessions, the USD/MXN pair has dropped more than 1.5% in favor of the Mexican peso as the U.S. dollar continues to weaken in the short term. The index that measures the strength of the U.S. dollar (DXY) remains consistently below the 100-point level, highlighting the broad weakness of the currency. This has, in part, allowed the current bullish bias of the Mexican peso to persist over the short term.
Downtrend Remains Intact
Since the early days of April, selling pressure has been strong enough to sustain a steady downtrend. However, as the price continues to fall, notable signs of neutrality have started to emerge, which could pave the way for short-term bullish corrections as bearish momentum begins to show signs of exhaustion.
RSI
Lower lows in USD/MXN and higher lows in the RSI have generated a bullish divergence in the short term, suggesting a persistent price imbalance and potential loss of bearish strength in recent sessions. This could open the door for buying corrections to materialize in the upcoming trading sessions.
TRIX
The TRIX line remains oscillating below the 0 level, indicating that the dominant bias over the past few weeks is still bearish. However, if the line continues to flatten, it may signal a possible pause in recent selling momentum.
Key Levels to Watch:
19.24: A near-term indecision zone that may act as a barrier for potential buying corrections.
19.00: A key support level aligned with an important psychological zone. Price movement below this level could provide further room for the current bearish pattern to continue.
19.70: A critical resistance level, corresponding to the highest point of the past two months. A move back toward this area could signal the end of the current downtrend.
Written by Julian Pineda, CFA – Market Analyst

USD/MXN: The Mexican Peso Faces Strong NeutralityOver the last five trading sessions, USD/MXN fluctuations have shown a variation of barely 1%, indicating the emergence of sustained neutrality in the pair's recent moves. For now, the slight bearish bias in USD/MXN has managed to maintain a steady downward trend, as the Mexican peso benefits from short-term weakness in the U.S. dollar—as shown by the DXY index, which continues to trade below the 100-point mark, highlighting persistent weakness in the U.S. currency.
Potential Downtrend:
Since early April, bearish moves have begun to form a steady downtrend, bringing the price close to the 19 pesos per dollar level. So far, no significant bullish correction has reversed the current selling trend. However, it is important to note that the recent neutral tone could undermine the bearish bias of the past few months. If this neutrality continues, it could give way to a new phase of prolonged sideways trading in the short term.
MACD:
The MACD histogram has been hovering around the 0 line for several sessions, indicating that the moving averages are in a neutral zone, with no clear bullish or bearish dominance. If this pattern persists, the current neutrality could lead to a more defined consolidation range.
RSI:
The RSI line has started forming higher lows while USD/MXN prices have marked lower lows—resulting in a bullish divergence. This could signal room for potential upward corrections in the short term.
Key Levels to Watch:
19.24 pesos per dollar: A current barrier where price action has shown strong neutrality; it could serve as a starting point for potential short-term bullish corrections.
19.70 pesos per dollar: A critical resistance at the highest level the pair has reached in recent weeks. Sustained bullish movement near this zone could mark the end of the prevailing downtrend.
19.00 pesos per dollar: A significant psychological support. Continued bearish moves approaching this level could revive the forgotten bearish sentiment and strengthen the current downtrend line.
Written by Julian Pineda, CFA – Market Analyst

USD/MXN Eyes Breakdown Toward Key Support LevelsThe USD/MXN daily chart is displaying signs of continued weakness:
Downtrend Intact: The pair trades firmly below its 50-day and 200-day moving averages, reinforcing bearish control.
MACD Bearish: Momentum remains to the downside with the MACD line below zero and the signal line.
Key Support Zones: Price is approaching horizontal support at 19.07; a break could expose 18.58 as the next downside target.
Resistance to Watch: Former support near 19.49 now acts as initial resistance.
RSI Holding Lower: The RSI is drifting below 40, showing bearish momentum without reaching oversold territory.
If the pair closes below 19.07, it may accelerate the bearish trend toward the 18.58 handle.
-MW

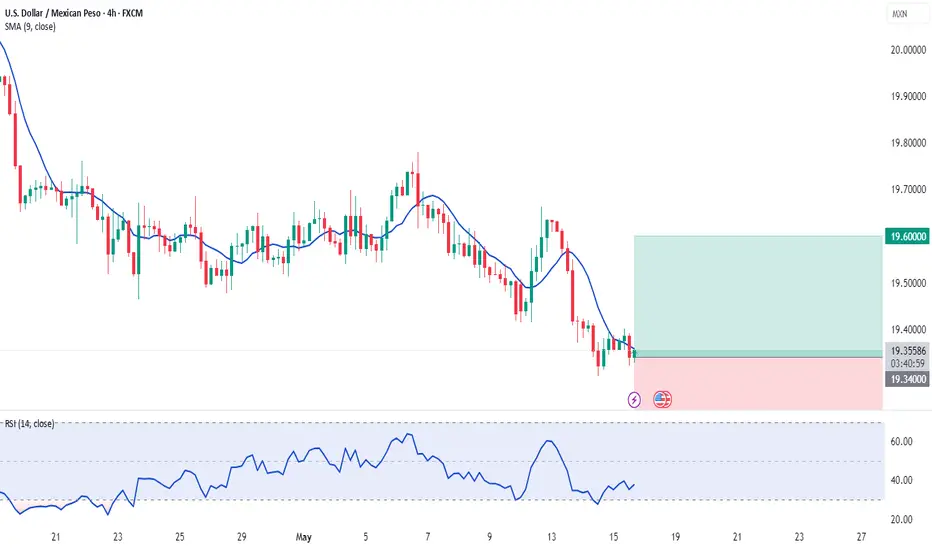
USDMXN | 19.05.2025BUY 19.3700 | STOP 19.2900 | TAKE 19.4700 | Movement inside the medium-term channel.

USDMXN | 15.05.2025BUY 19.3400 | STOP 19.1000 | TAKE 19.4000 | Technical view on resumption of growth to the nearest resistance from local support.
USD/MXN Mirrors 2017 Reversal; Elliott Wave Pointing Lower Back in 2016–2017, we first saw a very sharp recovery on USD/MXN, but when Trump took office in January 2017, the market reversed strongly lower, falling all the way from 22 to 17.60, lost nearly 20% . That very similar pattern is now becoming visible again with 2024–2025 price action. Last year, after Trump won the US election, we saw significant depreciation of the Mexican peso, but since he has officially taken office in January, we’re seeing a complete reversal—just like in 2017.
In fact, the Mexican peso has been gaining nicely over the past few months, likely based on speculation that Trump will find the agreement and trade deals with other countries, particularly related to tariffs. Since no one really benefits from trade wars, it’s not surprising that even Trump’s recent remarks reflect an acknowledgment of the global situation being unsustainable, especially when it comes to CHINA-US trade.
With that in mind, markets in general are likely to recover, and we’re already seeing some nice rebounds. And when stocks are in recovery mode, commodity currencies—including the peso—tend to perform well.
Looking at USD/MXN specifically, we’re seeing a strong reversal down from February highs, just like in 2017. The current drop hasn't even retraced 38.2% of the 2024 rally yet, which suggests more downside is likely—ideally toward the 19.00 area, maybe even 18.00 by year-end.
From an Elliott Wave perspective, it's useful to zoom in on smaller time frames. The structure doesn’t look like completed impulse yet, so technically there can be more weakness coming. Resistance for wave four rally sits around the 19.77–19.84 zone, which aligns with Fibonacci projections for wave four, as well as swing lows from March and April.
This area could serve as a nice resistance of the current bounce, especially if the Fed delivers any dovish remarks this week. No rate cuts are expected, but even a hint at future cuts could send the US yields lower, which would weigh on the dollar and support risk assets—meaning commodity currencies could outperform.
In that case, USD/MXN could ideally fall back below 19.50.
Elliott Wave analysis also helps define clear invalidation levels, very important when it comes to potential trade setups. In this scenario, 20.16 is a key level to watch. A break above it would overlap with the start of the current move and signal that the bears are finished for now, thus I would need to adjust the view accordingly.
Grega

Mexican Peso Faces Potential Short-Term PressureThe Mexican Peso is approaching a significant supply area, a confluence of factors that suggests a potential short-term bearish trend. Daily retail trader positions show a notable concentration of long positions, while seasonal patterns hint at a shift in market sentiment. This combination creates an environment ripe for a short position on futures or a long position in CFDs, if the bearish bias strengthens.
This convergence of supply, bullish retail sentiment, and seasonal influence raises the possibility of a corrective move in the Mexican Peso. The sustained presence of long positions in the daily market could be vulnerable to a price reversal, particularly as seasonal factors typically favor a weaker Peso during this period. While a short position on the future market presents the opportunity for profit on any price decline, astute investors should closely monitor the market's reaction to key economic releases for confirmation of the short-term bearish bias.
Caveat: This analysis is based on current market conditions and should not be considered financial advice. Further technical analysis and fundamental assessments are recommended before making any trading decisions.
✅ Please share your thoughts about 6M1! in the comments section below and HIT LIKE if you appreciate my analysis. Don't forget to FOLLOW ME; you will help us a lot with this small contribution.


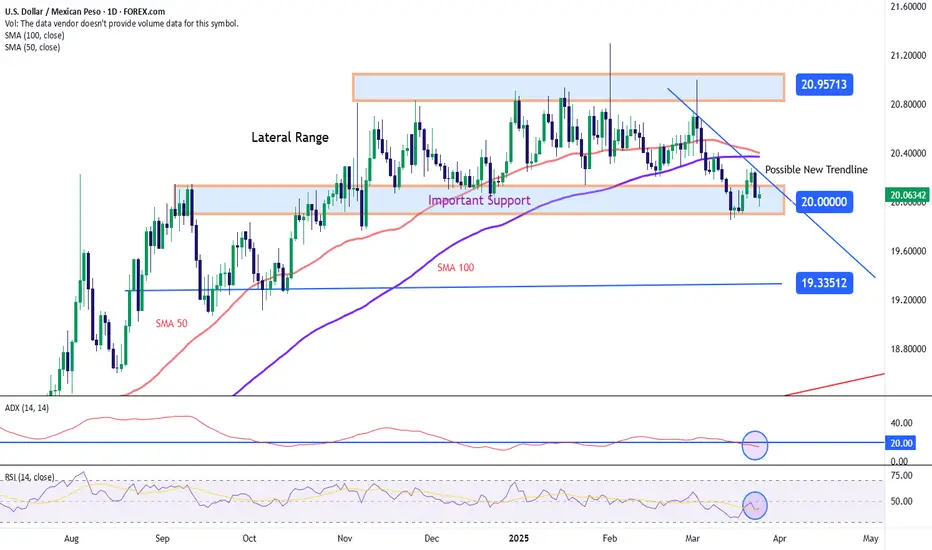
USD/MXN Continues to Fall Below the 20 Pesos per Dollar LevelOver the past five trading sessions, the USD/MXN pair has declined by more than 2%, as the Mexican peso continues to gain ground against the U.S. dollar. This bullish trend in the peso is partly driven by the ongoing weakness in the U.S. dollar, as reflected in the DXY index, which has fallen to 99 points, its lowest level in the past year.
The dollar’s weakness stems from the growing political and economic uncertainty generated by the global trade war, triggering a broad wave of dollar selling as capital exits the U.S. If this trend continues, the Mexican peso could maintain its bullish momentum in the short term.
Lateral Range Breakout
Since November 2024, USD/MXN had been trading within a sideways range, with resistance at 20.94 pesos per dollar and support at 20.00. In recent sessions, bearish pressure broke through this support, and as selling momentum builds, this could mark the start of a more meaningful downtrend.
MACD
The MACD histogram remains below the neutral zero line, indicating strong bearish momentum based on recent moving average trends. If the histogram continues to show deeper negative values, selling pressure could intensify further in the short term.
RSI
Currently, lower lows in price and higher lows in the RSI suggest the presence of a bullish divergence—an imbalance in recent selling momentum. This could create an opportunity for short-term bullish corrections to emerge.
Key Levels to Watch:
20.33 pesos per dollar: A key resistance level, aligned with the 100-period moving average. A return to this area could reactivate the previous range.
20.00 pesos per dollar: Another important resistance, now acting as a potential retest zone after previously serving as support. This could be a target for short-term pullbacks.
19.33 pesos per dollar: A significant support level, aligned with the neutral zone from September 2024. A move toward this level could reinforce the consolidation of a consistent bearish trend in upcoming sessions.
Written by Julian Pineda, CFA – Market Analyst


Liberation Day: Fear or greed in the air? We are less than hour out from the Liberation Day tariff announcements. The U.S. is preparing to roll out reciprocal tariffs on all countries, with rates set at 10%, 15%, and 20%, according to Sky News.
Investors hoping for certainty may be disappointed—this could mark the start of a longer phase of trade battles.
Mexico, once again, is reading the room. President Sheinbaum has confirmed Mexico won’t respond with tit-for-tat tariffs. They understand that the way to deal with Trump is to treat him with kid gloves.
Meanwhile, gold hit another record high, reaching $3,149.04 on Tuesday before pulling back a little. Buyers might have a better setup around the parallel pivot line to position for further upside.

USD/MXN Remains Neutral Around the 20 Pesos per Dollar ZoneOver the past two trading sessions, USD/MXN has maintained a steady neutral movement, showing barely 1% total variation in price. This growing neutral bias has persisted as the market continues to await how a potential trade war could affect the Mexican peso. Recent comments from President Trump suggested that the tariffs may not officially come into effect on April 2, adding to the uncertainty. Major moves in the pair could resume as new updates on the tariff situation emerge in the coming sessions.
Broad Sideways Range:
The pair continues to move within a clear sideways range, between the resistance at 20.95 pesos per dollar and the key support at 20.00. Recent bearish moves have been insufficient to break through this level decisively, leaving the sideways structure dominant in the USD/MXN market.
ADX Indicator:
The ADX line has remained below the 20 level in recent sessions, indicating that recent movements lack the strength to be considered trend-driven. This continues to point to a neutral market environment in the pair.
RSI Indicator:
A similar situation is seen in the RSI, with the line hovering near the neutral 50 level, suggesting that buying and selling pressure remain in balance. For now, this neutrality is helping reinforce the support barrier currently holding in USD/MXN.
Key Levels:
20.95 pesos per dollar – A key resistance level aligned with the recent highs. Sustained buying above this zone could reactivate bullish momentum and lead to a potential breakout from the current range.
20.00 pesos per dollar – The most important short-term support , matching the lower boundary of the broader sideways channel. Bearish moves below this level could lead to stronger downward pressure in the sessions ahead.
19.33 pesos per dollar – A distant support level , located around neutral price zones seen in September 2024. Selling pressure that reaches this level could confirm the beginning of a new bearish trend in USD/MXN.
By Julian Pineda, CFA – Market Analyst

US Dollar Weakens: Hedge Funds Shift to Short PositionsThe U.S. dollar, long considered a bastion of stability, is facing a significant shift in sentiment as hedge funds begin to adopt a bearish stance. This reversal, marking a notable change since the period following Donald Trump's election, is driven by a complex interplay of economic uncertainties and evolving market expectations.
Factors Driving the Bearish Turn:
• Shifting Federal Reserve Expectations:
o A key driver of this bearish sentiment is the evolving outlook on the Federal Reserve's monetary policy. Initially, expectations of a strong dollar were bolstered by projections of limited Fed rate cuts. However, growing concerns about the fragility of the U.S. economy have led to increased expectations of multiple rate reductions. This shift in expectations weakens the dollar's appeal.
• Economic Uncertainty and Trade Policies:
o Concerns surrounding potential trade wars and the impact of certain economic policies are also weighing on the dollar. Uncertainty about future trade relations and their potential impact on U.S. economic growth is creating apprehension among hedge fund managers.
o The impacts of possible public sector job cuts, and restrictive immigration policies, are also adding to the economic uncertainty.
• Data from the CFTC:
o Data from the Commodity Futures Trading Commission (CFTC) reveals a clear trend. Speculative traders have moved from holding significant long-dollar positions to net short positions, indicating a substantial shift in market sentiment.
• Global Economic Factors:
o The relative strength of other global economies also plays a role. If other global economies are showing signs of stronger growth, that can also put downward pressure on the dollar.
Implications of a Weaker Dollar:
• Impact on Global Trade:
o A weaker dollar can have significant implications for global trade, potentially making U.S. exports more competitive while increasing the cost of imports.
• Inflationary Pressures:
o A depreciating dollar can also contribute to inflationary pressures within the U.S. as import prices rise.
• Investment Flows:
o Changes in the dollar's value can influence international investment flows, as investors adjust their portfolios in response to currency fluctuations.
Market Analysis:
• Analysts are closely monitoring these developments, with some revising their dollar forecasts downward. The shift in hedge fund positioning underscores the growing uncertainty surrounding the U.S. economic outlook.
• It is important to understand that the currency markets are very dynamic, and things can change rapidly.
• The effects of political events, and world wide economic changes can have very large effects on the dollar.
In essence, the shift in hedge fund sentiment reflects a growing recognition of the complex economic challenges facing the U.S. As these challenges unfold, the dollar's trajectory will remain a key focus for investors and policymakers alike.

2 reasons the peso rally may not be over The USD/MXN has fallen over 2.5% in the past five trading sessions, dropping below 19.9 per USD for the first time since November 2024.
Two key factors could be driving this move:
1.
Investor distrust in the U.S. dollar – Market confidence is weakening due to Trump’s inconsistent tariff threats and other unpopular policies.
In contrast, the Sheinbaum government’s kid-glove handling of Trump is securing favourable trade concessions.
2.
Attractive interest rate differential – With Banxico’s benchmark rate at 9.5%, the peso remains appealing for carry trades.
The Federal Reserve’s decision this week could widen this gap further. Last week’s subdued U.S. inflation data is helping to fuel speculation of earlier Fed rate cuts, which may continue to support the peso despite trade uncertainties.

wait and watch... if breakout below then go for short. It seems that USD MNX is on breakout. If it close below then go for short.
